The importance of RNA tertiary structure is evident from the growing number of published high resolution NMR and X-ray crystallographic structures of RNA molecules. These structures provide insights into function and create a knowledge base that is leveraged by programs such as Assemble, ModeRNA, RNABuilder, NAST, FARNA, Mc-Sym, RNA2D3D, and iFoldRNA for tertiary structure prediction and design. While these methods sample native-like RNA structures during simulations, all struggle to capture the native RNA conformation after scoring. The authors propose RSIM, an improved RNA fragment assembly method that preserves RNA global secondary structure while sampling conformations. This approach enhances the quality of predicted RNA tertiary structure, provides insights into the native state dynamics, and generates a powerful visualization of the RNA conformational space.
Keywords: conformation, Monte Carlo, RNA tertiary structure prediction, aptamer, noncanonical base-pairing
Abstract
The importance of RNA tertiary structure is evident from the growing number of published high resolution NMR and X-ray crystallographic structures of RNA molecules. These structures provide insights into function and create a knowledge base that is leveraged by programs such as Assemble, ModeRNA, RNABuilder, NAST, FARNA, Mc-Sym, RNA2D3D, and iFoldRNA for tertiary structure prediction and design. While these methods sample native-like RNA structures during simulations, all struggle to capture the native RNA conformation after scoring. We propose RSIM, an improved RNA fragment assembly method that preserves RNA global secondary structure while sampling conformations. This approach enhances the quality of predicted RNA tertiary structure, provides insights into the native state dynamics, and generates a powerful visualization of the RNA conformational space. RSIM is available for download from http://www.github.com/jpbida/rsim.
INTRODUCTION
Recent studies show that RNA tertiary structure and native dynamics play critical roles in regulating the catalytic activity, ligand binding, and overall function of RNA. For example, the catalytic core of the hammerhead ribozyme apparently exists as an ensemble of rapidly interconverting structures (Blount and Uhlenbeck 2005; Furtig et al. 2008). This rapid exchange is required for function and allows for coordination of Mg2+ ions that precisely position certain atoms involved in catalysis. Likewise, the HIV-1 TAR RNA samples a range of conformations that can be selectively stabilized by various small molecule ligands (Bailor et al. 2010). Finally, it has been suggested that the structural flexibility of tRNA directly affects translational efficiency in the ribosome (Söll and RajBhandary 1995; Ledoux et al. 2009).
These studies not only emphasize the necessity of an accurate understanding of RNA tertiary structure but also illustrate the importance of native state dynamics (rather than rigidity) in RNA function. This dynamic nature of RNA makes identifying the functional structure of the molecule challenging. Existing RNA tertiary structure prediction software programs such as Assemble (Jossinet and Westhof 2005; Jossinet et al. 2010), FARNA (Das and Baker 2007), Mc-Sym (Parisien and Major 2008), ModeRNA (Rother et al. 2011), RNA2D3D (Martinez et al. 2008), and RNAbuilder (Flores et al. 2010) can produce thousands of predictions for a single sequence. Similarly, molecular dynamics programs such as NAST (Jonikas et al. 2009) and iFoldRNA (Ding et al. 2008; Sharma et al. 2008) generate thousands of trajectories. These predictions are usually filtered by score and clustered into groups of similar structures to simplify the interpretation, and in all cases, this final filtering rarely identifies the most native-like conformation.
Recently, Das et al. reported an extension of FARNA (Das et al. 2010). Termed fragment assembled RNA with full atom refinement (FARFAR), the method improves the quality of RNA structure prediction for noncanonical regions by introducing an all-atom energy function. This function augments the FARNA approach by including scores based on simple electrostatic considerations and backbone hydrogen bonding. This revision allowed FARFAR to identify RNA tertiary structures with heavy atom root-mean-squared deviation (RMSD) within 2 Å of the native conformation for 14 small benchmark RNAs with lengths between 6 and 13 nucleotides (nt). However, the effectiveness of FARFAR declined as the length of the RNA molecules increased, having an average RMSD of 6.5 Å for the 11 benchmarks >13 nt in length. This limitation is, in part, because the sampling method used by both FARNA and FARFAR prevents stepwise conformational changes without disruption of the global secondary structure. This limits the ability of the applications to explicitly define the secondary structure and reduce the size of the conformational space to be sampled.
Here, we report a novel approach to RNA tertiary structure prediction that overcomes limitations inherent in both FARFAR and FARNA. Our approach, RSIM, is illustrated in Figure 1. RSIM provides a fully automated application predicting RNA tertiary structures from secondary structure constraints using fragment assembly. These tertiary structures are further refined with Monte Carlo simulations utilizing a novel sampling method, an expanded statistical potential, and a diverse fragment library (Supplemental Table S1). Finally, RSIM tracks simulation paths during refinement. This allows representation of the predicted RNA conformational space as a graph with secondary structures as nodes and simulation paths as edges. Graph theoretic analysis can then be applied to predict regions in the conformational space most likely to contain native-like RNA structures. We present a comparison of our approach with FARNA by analyzing eight challenging benchmark RNAs. We then use RSIM to provide examples of local dynamics predictions for the anti-NF-κB-p50 RNA aptamer (Lebruska and Maher 1999; Cassiday and Maher 2001), whose structure has been studied at high resolution in bound and free forms (Huang et al. 2003; Reiter et al. 2008).
FIGURE 1.
RSIM RNA structure prediction workflow. (A) Initial RNA secondary structure constraints are defined from suboptimal secondary structures predicted using the ViennaRNA folding algorithm (Hofacker et al. 1994). (B) Multiple tertiary structures for each secondary structure are generated using guided fragment assembly. (C) Monte Carlo simulations using closed moves and a statistical potential are performed for each initial tertiary structure. (D) A graph representation is generated of the conformational space with nodes being secondary structures, colored by score, and edges being simulation paths.
RESULTS AND DISCUSSION
Identifying secondary structure constraints for initial RNA structures
The number of possible conformations for even small RNA molecules is immense, requiring sampling methods to efficiently search the conformational space for prediction of native-like structures. One strength of Fragment Assembly of RNA (FARNA) (Das and Baker 2007) is its ability to restrict the searched conformational space by exploiting correlations between torsion angles in RNA fragments extracted from the database of high resolution structures. Even using FARNA, however, conformational sampling remains the computational bottleneck for accurate structure prediction.
To reduce the size of the conformational space sampled, RSIM uses secondary structure constraints to generate a diverse set of initial tertiary structures for refinement with Monte Carlo simulations. For benchmarking against FARNA, the top ten suboptimal secondary structures as predicted by the ViennaRNA thermodynamic folding algorithm (Hofacker et al. 1994) were used. However, constraints can be generated from any secondary structure prediction program. The web server CompaRNA (T Puton, K Rother, Ł Kozłowski, E Tkalińska, and J Bujnicki, in prep.) provides a continuously updated ranking of RNA secondary structure prediction programs, with CentroidFold (Hamada et al. 2009; Sato et al. 2009), Contrafold (Do et al. 2006), and McQFold (Metzler and Nebel 2008) performing the best in pairwise comparison tests. MC-Fold (Parisien and Major 2008) is not currently evaluated by the CompaRNA server but is also an excellent choice.
Generating tertiary structures with guided fragment assembly
Programs such as RNA2D3D (Martinez et al. 2008) can rapidly generate a tertiary structure for a given secondary structure. However, the generated tertiary structure often has steric clashes or unrealistic loop conformations. Additionally, we sought to generate a diverse set of initial tertiary structures, a goal not currently possible in RNA2D3D. RSIM provides an automated method to convert a secondary structure into a series of fragment assembly steps to ensure that each base-pairing constraint is met.
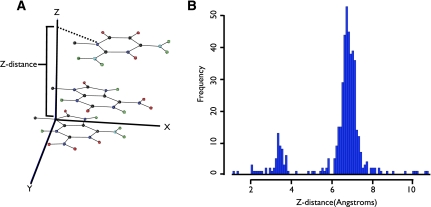
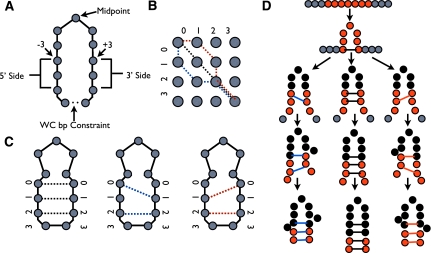
The process of converting a secondary structure into fragment assembly steps begins with the hairpin loops in the secondary structure. For each hairpin loop, RSIM chooses a midpoint between the first and last nucleotide in the loop. The position of this midpoint is guided by the observation that the distance traveled by 3 nt along the axis perpendicular to the plane of the first nucleotide has two discrete distributions (Fig. 2). One distribution is centered at 3.5 Å, while the other is centered at 7.0 Å. These discrete step sizes set a maximum asymmetry of 2:1 or 1:2 for the number of nucleotides 3′ and 5′ of the midpoint position. All possible positions of the midpoint occurring at or between nucleotides that preserve this ratio are identified.
FIGURE 2.
RNA backbone travels discrete distances that support 2:1 maximum ratios for bulges. (A) A 3-nt fragment with only the atoms in the bases shown in the coordinate system of the 5′ nt. The Z-distance is given as the distance along the z-axis from the first nt to the last nt in the fragment. (B) Histogram of Z-distance for 3-nt fragments in the ribosome (pdb_id=1FFK) such that the first and last nt have Z-axis oriented within 25 degrees. Two distributions of Z-distances account for a compressed and expanded backbone conformation that can account for, at most, a 2:1 ratio of nt in a given bulge.
Once the midpoint is identified, a fragment assembly step is defined with a single constraint bringing the nucleotide −3 and +3 of the midpoint position into a base-paired conformation. This creates an interior loop between the final base pair constraint and the base pair created by the initial fragment assembly step. All possible sets of constraints that match nucleotides on the 5′ side and 3′ side of the interior loop in 1:1, 2:1, or 1:2 ratios are enumerated (Fig. 3). Fragment assembly steps are generated for each set of constraints.
FIGURE 3.
Generating tertiary structures with guided fragment assembly. (A) The midpoint in a hairpin loop preserves a 2:1 or 1:2 ratio between the 5′ and 3′ sides. (B) All possible pairing constraints can be mapped to the problem of identifying all paths (red, black, blue) between (0,0) and (3,3) on a 4 × 4 lattice, using only the moves (+1,+1), (+1,+2), and (+2,+1). (C) Illustration of secondary structure constraints (red, black, blue) identified from paths on 4 × 4 lattice. (D) Fragment assembly steps for the three constraint sets generated for the given midpoint in the hairpin loop. Positions being moved are shown as red circles, previously moved positions are shown as black circles, and positions not yet moved are shown as gray circles. The three possible constraint sets are shown as red, black, or blue lines.
A planar base pair orientation is the default constraint used by RSIM when matching nucleotides in a 1:1 ratio. In the cases of 2:1 or 1:2 matching, RSIM requires a planar interaction between the two nucleotides closest to the final constraint in the bulge and allows the third nucleotide to adopt any conformation. Using manual editing of RSIM configuration files, this default behavior can be adjusted to build structures with specific types of noncanonical base-pairings and stacking interactions.
Similar approaches are taken to generate fragment assembly steps for bulges, interior loops, helices, and multiloops. For bulges, interior loops, and helices, the same process is used with the omission of the midpoint selection step and the additional requirement that all enumerated constraint sets preserve the secondary structure constraints. In the case of multiloops, limited success was achieved by first generating all helices that are independent of the multiloop closure and then obtaining the remaining base-pair constraint that leads to the closure of the multiloop with the same process as loops, using generic distance constraints when acting on the base pairs in the multiloop (Supplemental Fig. S1).
Each set of fragment assembly steps is used to build a tertiary structure from 3-nt fragments found in high resolution X-ray crystal and NMR structures. Fragments are stored at three resolutions: a virtual bond model based on the C1′ atoms, a virtual bond model plus atoms defining the plane of the bases, and an all-atom model (Supplemental Fig. S2). When inserting fragments at arbitrary positions, RSIM first updates the virtual bond model of the RNA molecule and checks for clashes. If no clashes are present, the atoms of the bases are added, and constraints are checked. Finally, if the constraints are met, the remaining backbone atoms are added, and the phosphate-oxygen bond lengths are checked at the boundaries of the newly inserted fragment.
When performing the initial fragment assembly step to bring the −3 and +3 nt from the midpoint into a planar conformation, we noticed (unexpectedly) that certain sequences were unable to obtain the constraint. We, therefore, determined the loop propensity for all sequences by generating 20 million random conformations for every possible RNA pyrimidine/purine sequence of length 6 or 7 and stored the fragment sets that were able to meet the planar constraint between the first and last nucleotide in a loop database (Supplemental Table S2). This result may indicate that particular sequences (such as those commonly found in triloops and tetraloops [Gutell et al. 2000; Huang et al. 2005; Lisi and Major 2007]) have a greater propensity for looping, and this information could be useful for filtering secondary structure predictions. It is also possible that a bias exists in the PDB or fragment library. Until future studies are performed to improve secondary structure prediction, we ensure tertiary structures are generated for all secondary structures regardless of the sequences near the midpoint position by threading sequences through the successful loop conformations in the database.
Performing Monte Carlo simulations with closed moves
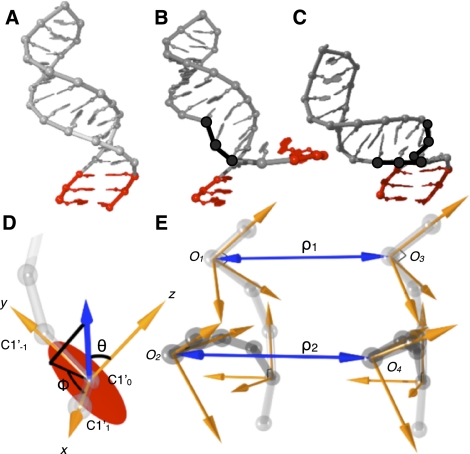
A principal limitation of FARNA (Das and Baker 2007) is its inability to sample alternative RNA conformations while preserving secondary structure contacts. When the FARNA algorithm substitutes an RNA fragment into a randomly selected position within an RNA whose structure is to be predicted, the resulting small local changes in bond torsion angles have large effects on the global RNA conformation, typically disrupting RNA secondary structure (Fig. 4A,B). RSIM avoids this problem by identifying pairs of RNA fragments whose substitution is compensatory, introducing only local structural changes and preserving the global RNA conformation (Fig. 4C). This closed moves improvement allows the RNA fragment assembly process to sample plausible RNA conformations while preserving a specified secondary structure.
FIGURE 4.
Improved sampling efficiency in RSIM using closed moves. (A) Initial conformation of example RNA molecule. (B) Insertion of random RNA trinucleotide fragment (black) from known high resolution structure library replaces corresponding sequences and disrupts base pairs (red). (C) The closed moves approach replaces pairs of trinucleotide fragments selected to preserve global secondary structure after substitution. (D) To identify appropriate pairs of compensatory RNA fragments, the fragment library is aligned to a local coordinate system with the C1′ atom of first nt being the origin, the C1′ atom of the following nt being along the x-axis, and the C1′ atom of the previous nt defining the positive y-direction. The xy-plane is shown (red circle). The vector defining the relative position of another fragment (blue arrow) sets the coordinate system. (E) Pair of trinucleotide fragments (dark gray) substituted into a prior RNA conformation (light gray). Pairs of trinucleotide fragments are found such that the distance and orientation of connections are preserved. Fragments are first filtered for preservation of distance ρ within 1 Å, followed by filtering for preservation of the relative orientation of the local coordinate systems defined by angles θ and ϕ.
Quickly identifying pairs of fragments that preserve the global conformation of the RNA molecule is essential if thousands of conformations are to be tested. For a 30-nt RNA molecule, we find a probability ∼10−5 for randomly selecting a compensatory pair of RNA fragments from a library of 14,400 trinucleotides (Supplemental Table S1) such that local conformation is changed while secondary structure is preserved. To overcome this inefficiency and reduce the required computational time, RSIM indexes the fragment database and performs a systematic search using closed moves. Fragments are aligned to a local coordinate system (Fig. 4D), and the relative positions of fragment termini are clustered using k-means clustering with indexing based on spatial position. The systematic search first identifies pairs of clusters that meet the constraint that the distance between terminal C1′ atoms, ρ1 and ρ2, is within 1 Å (Fig. 4E). The members of each cluster are then systematically searched for pairs that preserve the relative orientation of the termini defined by angles θ1, θ2, ϕ1, and ϕ2 within a threshold. Identified fragment pairs are substituted into the structure, and the resulting new RNA conformation is tested for steric clashes resulting from overlap of van der Waals radii and for backbone continuity defined by inter-phosphate bond lengths.
Developing a statistical potential
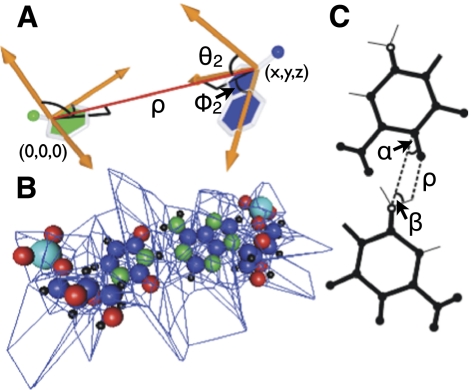
Several groups have previously reported thoughtful metrics that could be used as statistical potentials for predicting RNA structure by detecting and rewarding native-like RNA conformations. As a replacement for the Rosetta coarse-grained energy function utilized in FARNA (Das and Baker 2007), we began by exploiting the 100-member doublet library proposed by Sykes and Levitt (2005). To create a scoring function, RSIM represents each member of the doublet library by a five-dimensional Gaussian distribution (Fig. 5A) of x, y, z, ϕ2, and θ2. For each local nucleotide pair (C1′ atoms within 15 Å), the sum of all cluster values was recorded. For a given conformation, the score is then given as the sum of negative logs of the cluster values for each nucleotide pair. We confirmed that this doublet library score effectively discriminates between the top 500 decoy (nonnative but plausible) structures generated by FARNA and the corresponding native structures (Supplemental Table S3): the mean value of the Gaussian distribution representation of the 100-member library for particular residues in the decoy set was found to be 7%, 7%, 2%, and 2% for residues G, A, U, and C, respectively, whereas the native structures gave corresponding values of 10%, 12%, 4%, and 7%.
FIGURE 5.
Statistical potentials. (A) Base doublet quality is analyzed through five variables x, y, z, ϕ2, and θ2 that define the relative position of any two bases. (B) Voronoi polyhedra are constructed around all atoms so that volumes, surfaces, and neighbors can be determined quantitatively. Atoms that share faces with the bounding box are considered unpacked. A U-A base pair is shown as an example. (C) Hydrogen bond probability is scored based on parameters θ1, θ2, and ρ based on the model proposed by Lemieux and Major (2002).
As previously reported, the doublet library performs poorly in bulge and noncanonical regions (Sykes and Levitt 2005). To overcome this limitation, RSIM also incorporates a molecular packing statistic in the scoring metric. Proposed by Voss and Gerstein (2005), molecular packing is measured by calculating the volume of Voronoi polyhedra (Rycroft 2009) constructed around each atom (Fig. 4B). Three base atoms define the plane of the base. These atoms have independent packing volumes. For each atom, the probability of being packed and the volume when packed were deduced from ribosome crystal structure data (Ban et al. 2000). The negative logarithm of this probability was used as a scoring metric. We find that the FARNA-generated RNA decoy structures show similar volumes for each base atom but significantly underpack the guanine N2, adenine N3, uracil O2, and cytosine O2 atoms compared to native structures (Supplemental Table S3).
To prevent the scoring function from inadvertently improving the doublet library and packing scores by a trivial increase in the average number of residue-residue contacts, RSIM also defines a graph-order metric. The graph order for a particular residue is measured by counting the total number of Voronoi polyhedra faces shared with other residues. The FARNA decoy set is characterized by average graph orders of 5.28, 5.31, 5.42, and 5.38 for residues G, A, U, and C, respectively. Interestingly, the native structures of benchmark RNAs, ribosomes, and other small RNAs tend to have the highest graph orders for guanine and the lowest graph orders for adenine, with cytosine and uracil having intermediate values (Supplementl Table S3). The probability of each graph-order value was calculated from the ribosome crystal structure data, and the negative logarithm of this probability was used as a scoring metric.
Finally, RSIM incorporates the hydrogen bonding probability calculated from relative donor and acceptor positions (Fig. 5C) described by Lemieux and Major (2002). We find that the hydrogen bonding score is highly correlated with the doublet library score and again contributes little in bulged and stacked regions of RNA structure. On average, the FARNA-generated decoys have 30% fewer hydrogen bonds than the corresponding native structures (Supplemental Table S3).
RSIM then uses an overall scoring function with a composite score combining the metrics described above. The RSIM score smoothly incorporates higher resolution metrics after lower resolution metrics are first satisfied. The score is given by
 |
where S1 is the sum of the graph order, backbone volume, and residue volume metrics, S2 is the sum of the atom volume and atom packing metrics, S3 is the sum of the hydrogen bonding and doublet library metrics, and μi is the upper quartile for the score Si as calculated over the ribosome crystal structures.
We observe a mild correlation between the C4′ atom RMSD from the native RNA structure and the composite score in our benchmark simulations with an average Pearson correlation of 0.31 (Supplemental Fig. S3). The low resolution (S1), medium resolution (S2), and high resolution (S3) scores were characterized by C4′ RMSD correlations of 0.19, −0.06, and 0.28, respectively.
Generating a conformational space using closed moves
Initial RNA tertiary structures generated by RSIM are minimized using the statistical potential and a Monte Carlo method with closed move sampling. Throughout the simulation, RSIM tracks the secondary structure of the conformation using the matching constraints that generated initial tertiary structures. This allows visualization of the entire conformational space as a graph with secondary structures as nodes and closed moves as edges. For RNAs characterized by a distinct global minimum energy structure, nearby structures in the conformational space are likely to have native-like structures.
Benchmarking against FARNA
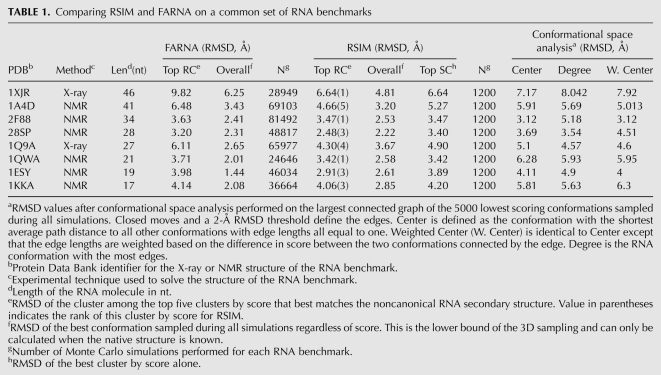
When reporting RNA tertiary structure prediction for an initial set of benchmark RNAs, the FARNA (Das and Baker 2007) analysis used the best of the top five predicted clusters based on matching noncanonical secondary structure informed by the known native RNA structures. For comparison, Table 1 reports the best RSIM predicted RNA tertiary structures from the top five clusters (Top RC) along with the top cluster predicted without any knowledge of the native structure (Top SC). Table 1 demonstrates that RSIM outperforms FARNA for all benchmarks, improving by an average of 1.3 Å C4′ atom RMSD when using the top cluster approach. Structure prediction is improved in six of eight cases (average 0.74 Å RMSD) when taking the best cluster based on score alone. It is further important to note that these results were accomplished with 20-fold fewer simulations, where each simulation has a run time comparable to that of the FARNA program.
TABLE 1.
Comparing RSIM and FARNA on a common set of RNA benchmarks
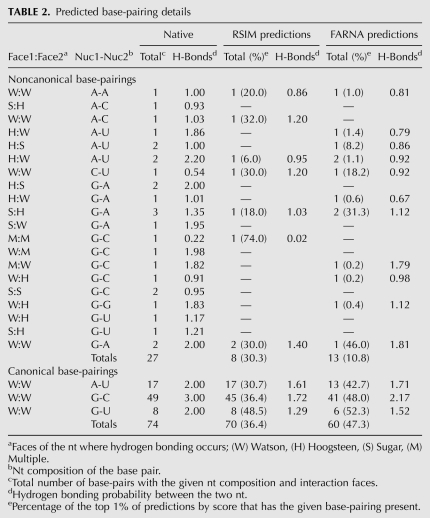
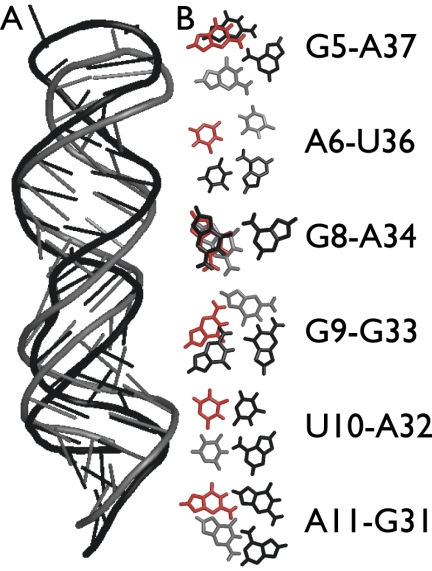
The top 1% of predictions by score for FARNA (n = 500) and RSIM (n = 50) were evaluated for the prevalence of the 74 canonical and 27 noncanonical base-pairings that occur in the high resolution structures of the native conformations of the eight benchmarks. Table 2 uses interaction faces (Parisien et al. 2009) and nucleotide composition to categorize base-pairings predicted in the benchmarks. We see that both RSIM and FARNA struggle to capture noncanonical base-pairings, with RSIM being superior, predicting 8/27 with an average frequency of 30.3% and FARNA predicting 13/27 with an average frequency of 10.8%. For canonical base-pairings, RSIM outperforms FARNA, predicting 70/74 in 36.4% of the top 1% of predictions, compared to 60/74 identified in 47.3% of the top 1% of predictions for FARNA. The best scoring prediction by RSIM for the loop D/loop E arm of the Escherichia coli 5S rRNA molecule (pdb_id 1a4d) captured 1/6 noncanonical base-pairings (Fig. 6). Only 2/6 of the possible noncanonical pairs were observed in the top 1% of all predictions. The limited ability of FARNA and RSIM to capture noncanonical base-pairings may result from the low frequency of RNA library fragments that support helices containing base-base interactions on the Hoogsteen and sugar faces of bases. Optimization of the fragment library to include a balanced distribution of fragments from such helices might improve noncanonical base-pairing prediction. However, the frequency of such interactions in the PDB is extremely low (Supplemental Table S4), and computational approaches will be needed to generate additional sets of fragments.
TABLE 2.
Predicted base-pairing details
FIGURE 6.
Predicted noncanonical base-pairings in loop D/loop E arm of E. coli 5S rRNA. (A) Comparison of NMR structure (pdb_id 1a4d) of loop D/loop E arm of E. coli 5S rRNA (black) and the best RSIM prediction by score (gray). (B) Noncanonical base pairs appearing in the NMR structure (black), relative position of same bases in best scoring RSIM prediction (gray), best prediction of base pair occurring in top 1% of RSIM predictions by score (red). Only one of the six noncanonical base pairs occurred in the RSIMs best scoring structure, and only two were present in the top 1% of all RSIM predictions by score.
Applying secondary structure clustering and graph theoretic analysis to conformational space
The ability to represent the RNA conformational space as a graph is a feature of the RSIM approach. This provides opportunities to leverage graph theoretic metrics to identify regions most likely to contain native-like RNA conformations and to cluster the graph representations of the conformational spaces from sequence variants to identify a common functional tertiary structure.
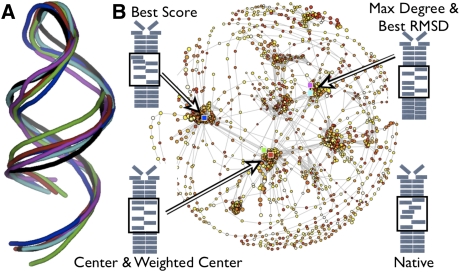
To explore these ideas, RSIM was used to predict the structure of the 29-nt anti-NF-κB p50 RNA aptamer that was identified by in vitro selection in our laboratory and subsequently studied extensively (Lebruska and Maher 1999; Cassiday and Maher 2001; Cassiday et al. 2002; Huang et al. 2003; Ghosh et al. 2004). This RNA was selected in vitro for the ability to bind to the DNA-binding NF-κB p502 protein homodimer and has been shown to mimic DNA by creating an unusually wide major groove (Reiter et al. 2008). Interestingly, the top scoring cluster of predicted structures (Fig. 7A, blue) does not feature this wide major groove (Fig. 7A, black). However, the conformation with the largest number of edges (hence, the greatest sampling) (Fig. 7A, purple) has an unusually wide major groove and the correct relative base orientations. This observation is important because it suggests that the anti-NF-κB p50 RNA aptamer dynamically samples an ensemble of conformations including the functional structure seen in X-ray and NMR experiments. In this case, the graph theoretic analysis did not improve the overall ability to predict native-like structures over secondary structure clustering alone (Table 1). However, these metrics provide unique insights into likely RNA dynamics, highlighting RNA tertiary structures that are important for stabilizing or destabilizing certain regions of the conformational space.
FIGURE 7.
Predicted RNA tertiary structures and graph representation of conformational space. (A) Ribbon diagram through the C4′ backbone atoms of predicted conformations for the 29-nt anti-NF-κB p50 RNA aptamer based on the secondary structure cluster with the best overall score (blue), Graph Center (red), Weighted Center (green), Maximal Degree (purple), and RMSD (cyan) compared to the native conformation identified experimentally by NMR (black) (Reiter et al. 2008). (B) Graph representation of conformational space with simulation paths (gray lines) and conformations colored by low (red) to high (yellow) score with radius proportional to the RMSD from the native structure. Colored squares are locations of backbone conformations shown in A with the same coloring scheme. Secondary structure diagrams show the relative base positions with arrows pointing to each region of the space, with the native structure illustrated on the bottom right.
Extending accurate tertiary RNA structure prediction to longer molecules
The RSIM sampling approach reported here extends the reach of fragment-based RNA tertiary structure prediction to RNA molecules >40 nt in length. We found that, for the longest benchmark RNA, 1xjr (46 nt), RSIM improved the overall best-sampled conformation by 1.4 Å RMSD (6.25 Å to 4.8 Å). As RNA length increases, the accuracy of secondary structure prediction becomes increasingly important.
Prediction of native state dynamics and functional structures
As described above, RSIM extends the FARNA approach for RNA structure prediction while providing insight into the native state dynamics of the RNA molecules being simulated. Obviously, the statistical potential provides no information about the time required to move along a given simulation path. However, the coarse-grained conformational space could be used to direct shorter molecular dynamics simulations in order to estimate transition rates. Beyond insight into native dynamics, the RSIM conformational space graph representation reduces the dimensionality of the simulation data in a way that is amenable to machine learning and clustering. For example, one possible approach to identify functional RNA conformations would leverage experimental data to generate graph representations of conformational spaces for both functional and nonfunctional RNA sequence variants. It might then be possible to identify regions in the conformational space that are significantly enriched for functional variants.
Limitations
The described implementation of RSIM does not automate the prediction of pseudoknotted RNA structures and requires hand editing of configuration files for complicated branched structures. However, prediction of such structures is not incompatible with any aspect of the algorithm, and these capabilities will be implemented in future versions. Interestingly, we have also found that ∼2% of initial RNA conformations remained “locked” in conformations from which no possible closed moves are identifiable in the current RNA fragment library. This limitation may be overcome by increasing the size of the RNA fragment library or by reducing constraints until moves are possible.
METHODS
Simulations
The current implementation of RSIM is limited to single-stranded RNA molecules without pseudoknots. To compare its prediction performance against FARNA, all eight of the single-stranded RNA molecules were chosen from the published set of FARNA benchmarks (Das and Baker 2007). Initial tertiary structures were generated from the top 10 secondary structures by energy, with C1′ atoms of the first and last nucleotide of each RNA molecule being held within 15 Å throughout the simulations. For each RNA sequence, 120 initial structures were generated, 12 from each secondary structure. Monte Carlo simulations using the metropolis criteria were performed under constant temperature until 1000 accepted moves or 50,000 steps were made. After all simulations were completed, the clustering methods described above were applied to identify native-like conformations.
Constructing the conformational space
The RNA conformational space was constructed by creating nodes representing the top 5000 conformations (by score) sampled during any of the simulations. Edges between conformations were generated from simulation paths or a 2-Å pairwise RMSD threshold within a secondary structure cluster. After graph construction, the Center, Weighted Center, and Maximal Degree nodes were identified. The Center is defined as the node that has the shortest average distance to all other nodes with edge lengths all equal to 1, whereas the Weighted Center uses edge lengths equal to the difference in score. The Maximal Degree node is defined as the node with the largest number of edges.
Secondary structure clustering
Secondary structure clustering identified all RNA conformations with identical secondary structures defined by the planar and stacking constraints. The top five secondary structure clusters based on the lowest scoring structure in each cluster were determined.
SUPPLEMENTAL MATERIAL
Supplemental material is available for this article.
ACKNOWLEDGMENTS
We acknowledge the helpful assistance of Karen Magee and the Mayo Clinic Research Computing Facility and the members of the Maher laboratory. This work was supported by the Mayo Foundation and by NIH grant GM068128 to L.J.M.
Footnotes
Article published online ahead of print. Article and publication date are at http://www.rnajournal.org/cgi/doi/10.1261/rna.027201.111.
REFERENCES
- Bailor MH, Sun X, Al-Hashimi HM 2010. Topology links RNA secondary structure with global conformation, dynamics, and adaptation. Science 327: 202–206 [DOI] [PubMed] [Google Scholar]
- Ban N, Nissen P, Hansen J, Moore PB, Steitz TA 2000. The complete atomic structure of the large ribosomal subunit at 2.4 Å resolution. Science 289: 905–920 [DOI] [PubMed] [Google Scholar]
- Blount KF, Uhlenbeck OC 2005. The structure-function dilemma of the hammerhead ribozyme. Annu Rev Biophys Biomol Struct 34: 415–440 [DOI] [PubMed] [Google Scholar]
- Cassiday LA, Maher LJ III 2001. In vivo recognition of an RNA aptamer by its transcription factor target. Biochemistry 40: 2433–2438 [DOI] [PubMed] [Google Scholar]
- Cassiday LA, Lebruska LL, Benson LM, Naylor S, Owen WG, Maher LJ III 2002. Binding stoichiometry of an RNA aptamer and its transcription factor target. Anal Biochem 306: 290–297 [DOI] [PubMed] [Google Scholar]
- Das R, Baker D 2007. Automated de novo prediction of native-like RNA tertiary structures. Proc Natl Acad Sci 104: 14664–14669 [DOI] [PMC free article] [PubMed] [Google Scholar]
- Das R, Karanicolas J, Baker D 2010. Atomic accuracy in predicting and designing noncanonical RNA structure. Nat Methods 7: 291–294 [DOI] [PMC free article] [PubMed] [Google Scholar]
- Ding F, Sharma S, Chalasani P, Demidov VV, Broude NE, Dokholyan NV 2008. Ab initio RNA folding by discrete molecular dynamics: From structure prediction to folding mechanisms. RNA 14: 1164–1173 [DOI] [PMC free article] [PubMed] [Google Scholar]
- Do CB, Woods DA, Batzoglou S 2006. CONTRAfold: RNA secondary structure prediction without physics-based models. Bioinformatics 22: e90–e98 [DOI] [PubMed] [Google Scholar]
- Flores SC, Wan Y, Russell R, Altman RB 2010. Predicting RNA structure by multiple template homology modeling. Pac Symp Biocomput 2010: 216–227 [DOI] [PMC free article] [PubMed] [Google Scholar]
- Furtig B, Richter C, Schell P, Wenter P, Pitsch S, Schwalbe H 2008. NMR-spectroscopic characterization of phosphodiester bond cleavage catalyzed by the minimal hammerhead ribozyme. RNA Biol 5: 41–48 [DOI] [PubMed] [Google Scholar]
- Ghosh G, Huang DB, Huxford T 2004. Molecular mimicry of the NF-κB DNA target site by a selected RNA aptamer. Curr Opin Struct Biol 14: 21–27 [DOI] [PubMed] [Google Scholar]
- Gutell RR, Cannone JJ, Shang Z, Du Y, Serra MJ 2000. A story: Unpaired adenosine bases in ribosomal RNAs. J Mol Biol 304: 335–354 [DOI] [PubMed] [Google Scholar]
- Hamada M, Kiryu H, Sato K, Mituyama T, Asai K 2009. Prediction of RNA secondary structure using generalized centroid estimators. Bioinformatics 25: 465–473 [DOI] [PubMed] [Google Scholar]
- Hofacker IL, Fontana W, Stadler PF, Bonhoeffer LS, Tacker M, Schuster P 1994. Fast folding and comparison of RNA secondary structures. Monatshefte für Chemie / Chemical Monthly 125: 167–188 [Google Scholar]
- Huang DB, Vu D, Cassiday LA, Zimmerman JM, Maher LJ III, Ghosh G 2003. Crystal structure of NF-κB (p50)2 complexed to a high-affinity RNA aptamer. Proc Natl Acad Sci 100: 9268–9273 [DOI] [PMC free article] [PubMed] [Google Scholar]
- Huang HC, Nagaswamy U, Fox GE 2005. The application of cluster analysis in the intercomparison of loop structures in RNA. RNA 11: 412–423 [DOI] [PMC free article] [PubMed] [Google Scholar]
- Jonikas MA, Radmer RJ, Laederach A, Das R, Pearlman S, Herschlag D, Altman RB 2009. Coarse-grained modeling of large RNA molecules with knowledge-based potentials and structural filters. RNA 15: 189–199 [DOI] [PMC free article] [PubMed] [Google Scholar]
- Jossinet F, Westhof E 2005. Sequence to Structure (S2S): Display, manipulate, and interconnect RNA data from sequence to structure. Bioinformatics 21: 3320–3321 [DOI] [PubMed] [Google Scholar]
- Jossinet F, Ludwig TE, Westhof E 2010. Assemble: An interactive graphical tool to analyze and build RNA architectures at the 2D and 3D levels. Bioinformatics 26: 2057–2059 [DOI] [PMC free article] [PubMed] [Google Scholar]
- Lebruska LL, Maher LJ III 1999. Selection and characterization of an RNA decoy for transcription factor NF-κB. Biochemistry 38: 3168–3174 [DOI] [PubMed] [Google Scholar]
- Ledoux S, Olejniczak M, Uhlenbeck OC 2009. A sequence element that tunes E. coli tRNAAlaGGC to ensure accurate decoding. Nat Struct Mol Biol 16: 359–364 [DOI] [PMC free article] [PubMed] [Google Scholar]
- Lemieux S, Major F 2002. RNA canonical and noncanonical base pairing types: A recognition method and complete repertoire. Nucleic Acids Res 30: 4250–4263 [DOI] [PMC free article] [PubMed] [Google Scholar]
- Lisi V, Major F 2007. A comparative analysis of the triloops in all high-resolution RNA structures reveals sequence structure relationships. RNA 13: 1537–1545 [DOI] [PMC free article] [PubMed] [Google Scholar]
- Martinez HM, Maizel JV Jr, Shapiro BA 2008. RNA2D3D: A program for generating, viewing, and comparing 3-dimensional models of RNA. J Biomol Struct Dyn 25: 669–683 [DOI] [PMC free article] [PubMed] [Google Scholar]
- Metzler D, Nebel ME 2008. Predicting RNA secondary structures with pseudoknots by MCMC sampling. J Math Biol 56: 161–181 [DOI] [PubMed] [Google Scholar]
- Parisien M, Major F 2008. The MC-Fold and MC-Sym pipeline infers RNA structure from sequence data. Nature 452: 51–55 [DOI] [PubMed] [Google Scholar]
- Parisien M, Cruz JA, Westhof E, Major F 2009. New metrics for comparing and assessing discrepancies between RNA 3D structures and models. RNA 15: 1875–1885 [DOI] [PMC free article] [PubMed] [Google Scholar]
- Reiter NJ, Maher LJ III, Butcher SE 2008. DNA mimicry by a high-affinity anti-NF-κB RNA aptamer. Nucleic Acids Res 36: 1227–1236 [DOI] [PMC free article] [PubMed] [Google Scholar]
- Rother M, Rother K, Puton T, Bujnicki JM 2011. ModeRNA: A tool for comparative modeling of RNA 3D structure. Nucleic Acids Res 39: 4007–4022 [DOI] [PMC free article] [PubMed] [Google Scholar]
- Rycroft CH 2009. VORO++: A three-dimensional Voronoi cell library in C++. Chaos 19: 041111 doi: 10.1063/1.3215722. [DOI] [PubMed] [Google Scholar]
- Sato K, Hamada M, Asai K, Mituyama T 2009. CENTROIDFOLD: A web server for RNA secondary structure prediction. Nucleic Acids Res 37: W277–W280 [DOI] [PMC free article] [PubMed] [Google Scholar]
- Sharma S, Ding F, Dokholyan NV 2008. iFoldRNA: Three-dimensional RNA structure prediction and folding. Bioinformatics 24: 1951–1952 [DOI] [PMC free article] [PubMed] [Google Scholar]
- Söll D, RajBhandary U, ed. 1995. tRNA: Structure, biosynthesis, and function. American Society for Microbiology, Washington, DC. [Google Scholar]
- Sykes MT, Levitt M 2005. Describing RNA structure by libraries of clustered nucleotide doublets. J Mol Biol 351: 26–38 [DOI] [PMC free article] [PubMed] [Google Scholar]
- Voss NR, Gerstein M 2005. Calculation of standard atomic volumes for RNA and comparison with proteins: RNA is packed more tightly. J Mol Biol 346: 477–492 [DOI] [PubMed] [Google Scholar]


