

Abstract
Metabolomics on easily accessible biofluids has the potential to provide rapid identification and distinction between stressors and inflammatory states. In the event of a radiological event, individuals with underlying medical conditions could present with similar symptoms to radiation poisoning, prominently nausea, diarrhea, vomiting and fever. Metabolomics of radiation exposure in mice has provided valuable biomarkers, and in this study we aimed to identify biomarkers of lipopolysaccharide (LPS) exposure to compare and contrast with ionizing radiation. LPS treatment leads to a severe inflammatory response and a cytokine storm, events similar to radiation exposure, and LPS exposure can recapitulate many of the responses seen in sepsis. Urine from control mice, LPS-treated mice, and mice irradiated with 3, 8 and 15 Gy of γ rays was analyzed by LCMS, and markers were extracted using SIMCA-P+ and Random Forests. Markers were validated through tandem mass spectrometry against pure chemicals. Five metabolites, cytosine, cortisol, adenine, O-propanoylcarnitine and isethionic acid, showed increased excretion at 24 h after LPS treatment (P < 0.0001, 0.0393, 0.0393, <0.0001 and 0.0004, respectively). Of these, cytosine, adenine and O-propanoylcarnitine showed specificity to LPS treatment when compared to radiation. On the other hand, increased excretion of cortisol after LPS and radiation treatments indicated a rapid systemic response to inflammatory agents. Isethionic acid excretion, however, showed elevated levels not only after LPS treatment but also after a very high dose of radiation (15 Gy), while additional metabolites showed responsiveness to radiation but not LPS. Metabolomics therefore has the potential to distinguish between different inflammatory responses based on differential ion signatures. It can also provide quick and reliable assessment of medical conditions in a mass casualty radiological scenario and aid in effective triaging.
INTRODUCTION
The threat of radiological terrorism has increased worldwide since September 11, 2001, and improved biomonitoring for exposure is a high priority. Concern about the possible release of a radiological dispersion device or contamination of food and water supplies has led to increased security and guarding of radioactive materials. Nonetheless, the intentional radiation poisoning and subsequent death of former Russian officer Alexander V. Litvinenko left traces of polonium-210 contamination across London and led to increased anxiety and hysteria for fear of exposure to radiation (1, 2). A similar accidental contamination with cesium-137 from a stolen radiotherapy device from an abandoned clinic in Goiania, Brazil in 1987 led to the screening for contamination of more than 10% of the 1.2 million residents of the area (3, 4). Furthermore, the Chernobyl nuclear disaster in 1986 prompted a considerable number of people to present with psychosomatic symptoms (e.g. vomiting, diarrhea), similar to the prodromal syndrome. Improved biodosimetry is therefore necessary to determine the extent of radiation responses, exposure to which, in combination with injuries such as burns and bacterial infections, can alter the outcome and medical intervention (5), and to distinguish such responses.
Radiation exposure leads to a subset of symptoms referred to as the prodromal syndrome, which may manifest as early as 24 h after exposure. The prodromal syndrome is characterized by a sudden onset of anorexia, nausea and vomiting, with the severity and duration of symptoms being dose dependent (6, 7). Deterioration of neurological signs and diarrhea can also be attributed to radiation, depending on the part of the body that is exposed, such as the brain or gastrointestinal system, and the dose. In case of a whole-body exposure, which may be the case in a radiological event, a combination of these symptoms is possible. However, similar symptoms may be due to other factors. During infections, bacterial toxins, in particular lipopolysaccharide (LPS), have been demonstrated to induce nausea, vomiting and diarrhea, leading to acute renal failure, septic shock and death (8-11). LPS is found in the outer wall of Gram-negative bacteria, acts as an endotoxin, and elicits immune responses in animals by activating innate immune responses and triggering secretion of pro-inflammatory cytokines in various cells types (11-13). In case of a radiological incident, individuals with a variety of infectious or inflammatory diseases could therefore exhibit symptoms similar to those of radiation poisoning. A quick, reliable method of identifying those individuals and eliminating them as potential victims thus needs to be developed.
A metabolomics approach offers the opportunity to distinguish radiation exposure from other stress responses and to potentially reduce the need for the classical and time-consuming cytogenetic analysis (14). A wide spectrum of potentially confounding inflammatory diseases such as Crohn’s disease, ulcerative colitis, and bacterial and viral infections could therefore skew the results and lead to false positives and diagnoses and unnecessary medical treatments. Metabolomics is a rapidly evolving field that aims to detect and provide quantifiable methods of all metabolites in a biofluid such as urine, blood or saliva. Metabolomic studies have provided markers for ionizing radiation exposure in mice and rats (15-18), pneumonia in pediatric patients (19), prostate and lung cancer (20, 21), and assessment of gut microbiota differences (22, 23). Identification of differential biomarker signatures could potentially be used effectively to distinguish various disease states and exposures to differing types of stress agents. A similar approach has been undertaken by examining changes in gene expression levels after exposure to different DNA-damaging and nondamaging agents, as described by Li et al., showing that ionizing radiation can be distinguished from other stressors (24). In the case of metabolomics, it could then lead to construction of portable instrumentation that can be deployed in the field for rapid identification of exposed individuals in a radiological event and more efficient triage in combination with current guidelines (25, 26).
This report describes the application of metabolomics in a study to identify biomarkers in the urine of mice that were injected intraperitoneally with LPS or exposed to 3, 8 or 15 Gy of γ rays. The objective of this study was to identify biomarker signatures of a relevant stress (infection) distinct from those of ionizing radiation to provide the potential for development of faster and more efficient identification of radiation victims in a radiological event.
MATERIALS AND METHODS
Chemicals
All chemicals were of the highest purity available, and reagents used were of HPLC grade. Debrisoquine sulfate, 4-nitrobenzoic acid (4-NBA), creatinine, cytosine, adenine hemisulfate, cortisol (hydrocortisone), isethionic acid (2-hydroxyethanesulfonate), allantoin, nicotinate, uric acid, taurine, glycine, l-carnitine, DL-homocysteine, N-acetyl-5-hydroxytryptamine, xanthine, inosine, phenylpyruvate, lipoic acid and 2-hydroxyphenylacetic acid were obtained from Sigma (St. Louis, MO). O-Propanoylcarnitine (±O-propionylcarnitine chloride) was obtained from Fisher Scientific (Hanover Park, IL). LPS from Escherichia coli O111:B4 was purchased from Sigma.
Animals and Experimental Treatments
Male C57BL/6N mice, ages 8–10 weeks old, were obtained from Charles River Laboratories, Inc. (Wilmington, MA). Mice were housed at Georgetown University under standard 12 h light and 12 h dark cycle conditions and given water and regular rodent chow ad libitum. All experimental procedures and animal handling were in accordance with animal protocols approved by the Georgetown University Animal Care and Use Committee (GUACUC). LPS was diluted in phosphate-buffered saline solution (PBS) to a final concentration of 5 μg/kg and administered to mice through intraperitoneal injection (controls were injected with PBS, n = 12; treated received LPS in PBS, n = 12). Irradiation of mice with γ rays was conducted with a 137Cs source (3 Gy, n = 10, 8 Gy, n = 11, 15 Gy, n = 8) at a dose rate of 1.67 Gy/min. Doses were selected according to survival rates and cause of death, covering the hematopoietic (8 Gy) and gastrointestinal (15 Gy) syndromes.
Urine Collection
Mice were housed in cages equipped with wire flooring (≤5 mice per cage). For urine collections, mice were transferred to metabolic cages (Techniplast USA, Exon, PA) (one per cage) for 24 h and afterward were returned to their respective home cages for another 24 h. Mice were acclimated to the metabolic cages for two urine collections prior to LPS treatment or irradiation. After treatment, urine samples were collected over a period of 15 days (seven urine collections). Each animal’s weight was recorded prior to entry in the metabolic cages. Mice that exhibited a 15% weight loss were promptly euthanized per GUACUC regulations. Urine samples were stored at −80°C until further use.
Sample Preparation and Analysis
The urine samples were analyzed using Ultra Performance Liquid Chromatography (UPLC) coupled to time-of-flight mass spectrometry (TOFMS) (Waters, Milford, MA). Specifically, protein was removed by 1:5 dilution in 50% acetonitrile. Internal standards of 4 μM debrisoquine ([M+H]+ = 176.1188 m/z) and 30 μM 4-NBA ([M−H]− = 166.0141 m/z) were used to determine the consistency of ion detection between samples. After centrifugation at 13,000g for 15 min at 4°C, 5 μl of the supernatant were injected into the UPLC-TOFMS. A Waters Acquity UPLC BEH C18 2.1 × 50-mm column was used to separate the molecules at 40°C. The mobile phase flow was set at 0.5 ml/min. The gradient mobile phase consisted of 0.1% formic acid (A) and 0.1% formic acid in acetonitrile (B). A 10-min run consisted of 0.5 min of 99% (A), 3.5 min of 80% (A), 4 min of 95% (B), 1 min of 99% (B), and finally 1 min of 99% (A). Mass spectrometry and accurate mass determination was performed with a Waters QTOF Premier® operating either in positive (ESI+) or negative (ESI-) electrospray ionization mode. The capillary voltage was set to 3200 V and the sampling cone voltage to 45 V. The desolvation gas flow was set to 800 liters/h and the temperature to 350°C. The cone gas flow was set to 25 liters/h and the temperature to 120°C. To obtain accurate mass during each run, intermittent injections of sulfadimethoxine ([M+H]+ = 311.0814 m/z and [M−H]− = 309.0658 m/z) in 50% acetonitrile at a concentration of 300 pg/ml at a rate of 40 ml/min were introduced as Lock-Spray®.
Data Processing
Chromatograms and ion spectra were acquired with the Waters software MassLynx in centroid format. Markers were extracted with the software MarkerLynx (Waters) and those with less than 100 ion counts were eliminated as noise. Prior to further analysis, each sample was normalized to its respective creatinine ([M+H]+ = 114.0667 m/z, retention time 0.32 min). Multivariate data analysis was applied to the matrix through the chemometric software SIMCA-P+ (Umetrics, Umea, Sweden). All centroid data were Pareto scaled to decrease noise and increase the importance of low-abundance ions. The data were further subjected to Principal Component Analysis (PCA) followed by Orthogonal Projection to Latent Squares (OPLS). Biomarkers were chosen based on abundance and correlation from S-plots.
To address issues of over-fitting, which is sometimes the case with large data analyses of small numbers of samples, the machine-learning algorithm Random Forests (RF) was employed through R, a programming language allowing for statistical analysis (27). RF has been used primarily for gene expression studies and recently for metabolic biomarker identification in biofluids, primarily urine and blood (16, 18, 19). Urine samples were assigned to two groups, control (PBS) or LPS-treated, and 10,000 trees were constructed with variable importances over 25 independent random forests. Multidimensional scaling (MDS) plots were constructed from either the whole set of ions or the top 100 ranked ions and the percentages of classification accuracy were calculated. Bootstrapping of the results from the 25 independent random forests was applied to determine the 95% confidence intervals of the variable importance ranks. Finally, heatmaps were constructed from the top 50 or 100 ions from the RF analysis. The samples were grouped by treatment and the metabolites were hierarchically clustered by complete linkage using the Euclidian distance. To aid in the visualization of differences between LPS and either PBS or 8 Gy, each metabolite was scaled by the maximum intensity value of that metabolite in the data set (i.e., each row was divided by the maximum value in the row before color assignment).
Molecular Ion Identification and Quantification
Metabolites that showed variable and statistically significant (P < 0.05, Mann-Whitney U test) differences between control and LPS-treated samples at 24 h after LPS treatment, either through SIMCA-P+ or RF analysis or between LPS and irradiated samples based on analysis with one-way ANOVA with Dunnett’s multiple correction test, were subjected to downstream analysis for positive identification. Initial identification of the metabolites was conducted through searches on the publicly available online databases “Madison Metabolomics Consortium Database” (MMCD) with 20 ppm tolerance and “Human Metabolome Database,” and verification was performed through tandem mass spectrometry (MS/MS) against pure chemicals. Fragmentation patterns of the pure chemicals, diluted in 50% acetonitrile or in the case of O-propanoylcarnitine spiked into urine for stabilization of the compound in the matrix, were compared to the fragmentation patterns of the metabolite in question in the biological samples with ramping collision energy between 5 and 70 eV. Additionally, markers that showed variability between LPS and radiation treatments were subjected to the same analysis and validation.
Quantification of the verified metabolites between LPS and PBS treatments was performed with the triple quadrupole spectrometer ABI QTRAP 4000® LC/MS/MS system (Applied Biosystems Inc, Foster City, CA) coupled to a Waters UPLC identical to the one coupled to the TOFMS. Samples were prepared in 50% acetonitrile with 0.1% formic acid in varying dilutions (1:5, 1:100, 1:500). All chromatographic conditions remained the same for separation of the ions, as described above. The multiple reaction monitoring (MRM) transitions were monitored in positive mode for creatinine (114.07 → 86.0 m/z), debrisoquine sulfate (176.17 → 134.0 m/z), cytosine (112.1 → 95.1 m/z), adenine (136.02 → 91.8 m/z), and cortisol (363.0 → 121.1 m/z). In negative mode, MRM transitions were monitored for 4-NBA (165.88 → 122.1 m/z) and isethionic acid (125.0 → 80.0 m/z). Quantification analysis was performed with the software Analyst (Agilent Technologies, Santa Clara, CA). O-propanoylcarnitine, however, was not quantifiable on the QTRAP. Instead, samples were run on the UPLCTOFMS with an accompanying standard curve under identical chromatographic conditions and quantification was performed with the software QuanLynx (Waters). Finally, quantification for the comparison between PBS, LPS and irradiated samples was also performed on the UPLC-TOFMS. All samples were run in duplicate, and standards were prepared in an aqueous 50% acetonitrile solution. Relative changes were calculated by the ratio of the peak area of the analyte over the peak area of the internal standard divided by the peak area of creatinine over peak area of its corresponding internal standard.
Statistical Analyses
Graphical presentations of means ± SEM were prepared using the software Prism 4 (GraphPad Software, Inc.). Means of metabolite concentration normalized to creatinine concentration between urine samples from PBS- and LPS-treated mice were compared with the Mann-Whitney U test. One-way analysis of variance (ANOVA) with Dunnett’s multiple correction test was used when comparing within multiple groups (LPS-treated or irradiated). A P value of <0.05 was considered statistically significant.
RESULTS
Twelve mice were treated with 5 μg/kg of LPS in PBS and 12 mice were treated with PBS and used as the control group. All mice tolerated the IP injection, and no fatalities occurred as a result of the treatment. Deconvolution of the chromatographic data resulted in a matrix of more than 5000 peaks for each of the positive and negative ionization modes, each peak with a pair of m/z and retention time forming a unique identifier. Each sample was normalized to its respective creatinine levels ([M+H]+ = 114.0667 m/z, retention time 0.32 min). Multivariate data analysis was conducted with the SIMCA-P+ software and RF run in R, providing complementary results by using different algorithms.
Multivariate Data Analysis with SIMCA-P+
Deconvoluted data normalized to their respective creatinine levels were initially subjected to PCA. The unsupervised PCA, where samples are not assigned to groups before the analysis, revealed patterns of clustering for the positive mode, but it did not predict a good model for the negative mode data (Supplementary Fig. 1; http://dx.doi.org/10.1667/RR2771.1.S1). The model parameters for fit and predictive ability were R2 = 0.663 and Q2 = 0.347 for positive ionization mode data. For the negative ionization mode, the values gave a model with low predictive ability (R2 = 0.617 and Q2 = 0.343). Although the PCA models were of low fit, they did aid in the identification of an outlier, as signified by its presence outside the Hotelling’s Tˆ2 distribution. Supervised OPLS was therefore performed, and samples were assigned to either the PBS or LPS group (Fig. 1). Figure 1A depicts the positive ionization mode score scatter plot with R2X(cum) = 0.733, R2Y(cum) = 1, and Q2(cum) = 0.832. Similar model predictions appear for the negative ionization mode score scatter plot as shown in Fig. 1B with R2X(cum) = 0.746, R2Y(cum) = 1, and Q2(cum) = 0.826. The same outlier that was identified from the PCA plots was also identified through OPLS analysis; therefore, it was removed from the further analysis for biomarker identification.
FIG. 1.
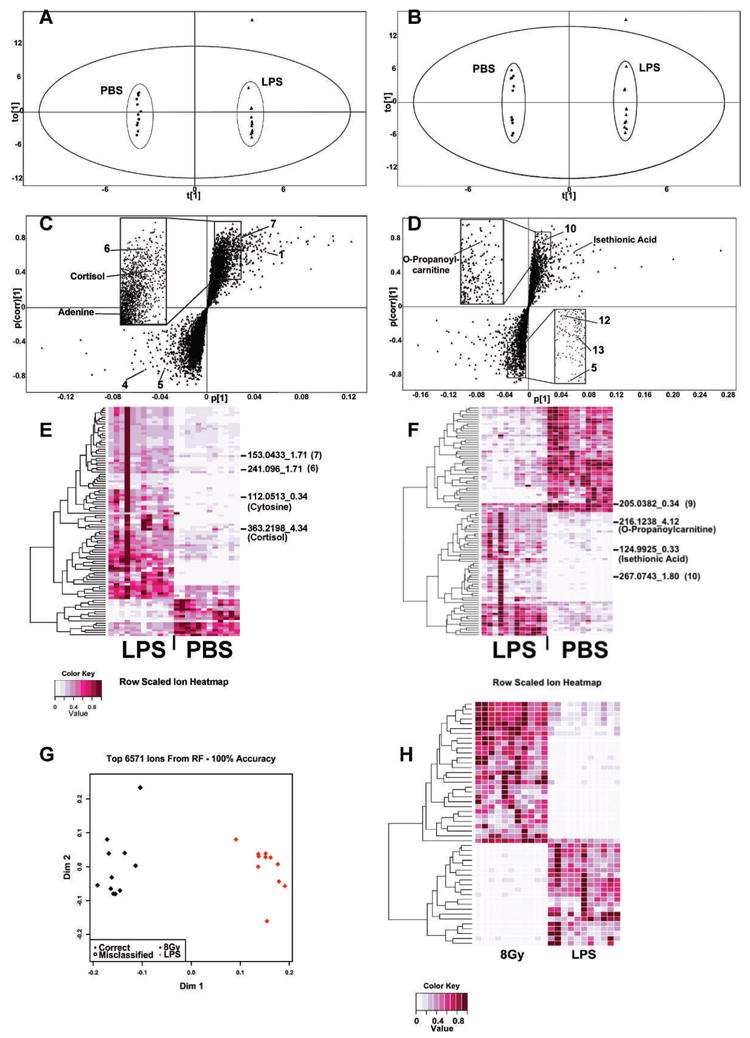
Multivariate data analysis of 24 h urine samples from LPS-treated mice and controls and comparison of urinary metabolic profiles from LPS- and 8-Gy treated mice through RF. Panels A–D were generated with the multivariate data analysis software SIMCA-P+ (Umetrics, Umea, Sweden). Panels A and B represent OPLS scores plots for positive and negative ionization modes, respectively. The samples clustered in distinct groups according to treatment, and variation within each group was minimal. One sample from the LPS-treated group was an outlier and was removed from downstream analysis of ESI+ and ESI− data. Panels C and D depict S plots for ESI+ and ESI−, respectively. Each triangle represents a unique ion with a specific m/z and retention time. Panels E and F represent heatmaps constructed from the top 100 ranked ions generated through RF. Ions of interest have been marked with their m/z and retention time and when validated through MS/MS with their identity. Clear differences in urinary metabolite excretion were observed between PBS- and LPS-treated mice. Panel G shows an MDS plot constructed from all 6,571 metabolites detected with the UPLC-TOFMS operated in negative ionization mode. Sample classification was 100% accurate, demonstrating that distinct metabolic profiles exist between the two groups. Panel H shows a heatmap constructed from the intensities of the top 50 ranked ions. It is evident that there are variable metabolites upregulated in the LPS and the 8-Gy groups.
S-plots were constructed after the removal of the outlier from the experimental set (Fig. 1C and D). A number of ions showed increased co-variation and correlation (the upper right and lower left quadrants) and were explored further. Seven ions in total were picked for further validation with pure standards in ESI+ and six ions in ESI−. The identity of four ions was confirmed through MS/MS. In particular, as summarized in Table 1, [M+H]+ = 363.2146 m/z and retention time of 4.34 min was identified as cortisol. [M+H]+ = 136.0617 m/z and retention time of 2.10 min was determined to be adenine. [M−H]− = 216.1242 m/z and retention time of 3.92 min was identified as O-propanoylcarnitine and [M−H]− = 124.9925 m/z with retention time of 0.33 min was determined to be isethionic acid. The rest of the markers labeled on the S-plots were tested against potential candidates; however, their identity was not verified. In particular, 1, 4, 5, 6, 7, 10, 12 and 13 were tested against glycine, l-carnitine, homocysteine (Na+ form), O-propanoylcarnitine (Na+ form), N-acetyl-5-hydroxytryptamine (Na+ form), xanthine, inosine, phenylpyruvate and 2-hydroxyphenylacetic acid, respectively, and none of these ions matched the experimental ions.
TABLE 1.
Identification of Urinary Biomarkers in Mice Treated with LPS
| Marker no. | Retention time (min) | Mass (m/z)
|
Predicted | ppm error | Empirical formula | Identity | Relative to controls | |
|---|---|---|---|---|---|---|---|---|
| ESI mode | Found | |||||||
| 1 | 2.99 | pos | 76.0395 | — | — | Unknown | ↑ | |
| 2 | 0.34 | pos | 112.0513 | 112.0510 | 2.68 | C4H5N3O | Cytosine | ↑ |
| 3 | 4.34 | pos | 363.2198 | 363.2146 | 14.32 | C21H30O5 | Cortisol | ↑ |
| 4 | 0.3 | pos | 162.1138 | — | — | Unknown | ↓ | |
| 5 | 1.81 | pos | 158.0263 | — | — | Unknown | ↓ | |
| 6 | 1.71 | pos | 241.096 | — | — | Unknown | ↑ | |
| 7 | 1.71 | pos | 153.0433 | — | — | Unknown | ↑ | |
| 8 | 2.1 | pos | 136.0617 | 136.0622 | 3.67 | C5H5N5 | Adenine | ↑ |
| 9 | 0.34 | neg | 205.0382 | — | — | Unknown | ↓ | |
| 10 | 1.8 | neg | 267.0743 | — | — | Unknown | ↑ | |
| 11 | 3.92 | neg | 216.1242 | 216.1236 | 2.78 | C10H19NO4 | O-Propanoylcarnitine | ↑ |
| 12 | 2.39 | neg | 163.0397 | — | — | Unknown | ↓ | |
| 13 | 1.82 | neg | 167.034 | — | — | Unknown | ↓ | |
| 14 | 0.33 | neg | 124.9925 | 124.9922 | 2.4 | C2H6O4S | Isethionic Acid | ↑ |
Notes. Biomarkers that exhibit differences between urine samples of control (PBS-treated mice) and treated (LPS-treated mice) as determined through SIMCA-P+ and/or Random Forests. Markers 2, 3, 8, 11, 12 and 15 have been verified through tandem mass spectrometry (MS/MS) against pure chemical standards. Markers 1, 4–7, 9–10 and 13–14 exhibit significant differences; however, their identity remains to be verified.
Multivariate Data Analysis with Random Forests
The original data matrix, prior to the removal of the outlier that was identified through SIMCA-P+, was also analyzed with RF, a machine-learning algorithm that was developed for gene expression analyses but has been used effectively in metabolomic analyses (16, 18, 19). Construction of MDS plots revealed successful classification of the samples in their respective LPS- or PBS-treated groups for both ionization modes. In particular, the ESI+ data gave 100% classification accuracy when all the ions or the top 100 were used. The ESI− data gave a 95.8% classification when the total ion number was used and 100% with the top 100 ions. Heatmap construction with the top 100 metabolites of importance, as determined through RF, revealed one outlier (fourth lane from the left, Fig. 1E and F) in the LPS group. The outlier was the same one identified through analysis with SIMCA-P+; therefore, classification of it as such through two different multivariate data analysis methods provides increased confidence for exclusion from further analysis. Markers that were identified with SIMCA-P+ were also identified through RF, and a number of them have been noted on Fig. 1E and F. In particular, unknown markers 6, 7 and 10 and validated cortisol, O-propanoylcarnitine and isethionic acid overlapped between the two methods. RF, however, identified two additional markers, one designated as number 9 in Table 1 with [M−H]− = 205.0382 m/z and retention time of 0.34 min, validated against but not identified as lipoic acid, and one with [M+H]+ = 112.0513 m/z and retention time of 0.34 min, validated as cytosine.
Furthermore, to determine if there were distinct metabolic profiles between an inflammatory response and radiation, RF was performed on the LPS and 8-Gy groups, the 8-Gy treatment being chosen for comparison based on published data from Tyburski et al. showing distinct metabolite changes compared to controls (17). An MDS plot with all the ions identified through the UPLC-TOFMS operated in negative ionization mode resulted in 100% classification accuracy and a heatmap constructed from the top 50 ranked metabolites showed striking differences in metabolite intensities (Fig. 1G and H).
Quantification of Validated Markers and Time-Course Studies
Quantification of the validated markers was performed on a triple-quadrupole MS, which provides a wider dynamic range leading to increased accuracy and sensitivity in quantification. Concentrations (μM) were calculated from a standard curve of pure chemicals in 50% acetonitrile from 100 μM to 0.8 μM and monitoring of an internal standard, debrisoquine, for the positive ionization mode and 4-NBA for the negative ionization mode. The markers were subsequently normalized to the respective creatinine concentrations. Figure 2A, C and E depicts the increased urinary excretion of the positive ionization mode markers cytosine (112.1 → 95.1 m/z) (P < 0.0001), cortisol (363.0 → 121.1 m/z) (P = 0.0393), and adenine (136.02 → 91.8 m/z) (P = 0.0393) in mice treated with LPS relative to the urine of mice treated with PBS. Figure 3C depicts the increased LPS treated mice urinary excretion of the negative ionization mode marker isethionic acid (125.0 → 80.0 m/z] (P= 0.0004). O-propanoylcarnitine, however (Fig. 3A), was quantified with the UPLC-TOFMS, which also showed increased urinary excretion in association with LPS exposure (P < 0.0001). All the results from the quantification were consistent with the initial trend assessment of relative changes obtained from the marker extraction through MarkerLynx.
FIG. 2.
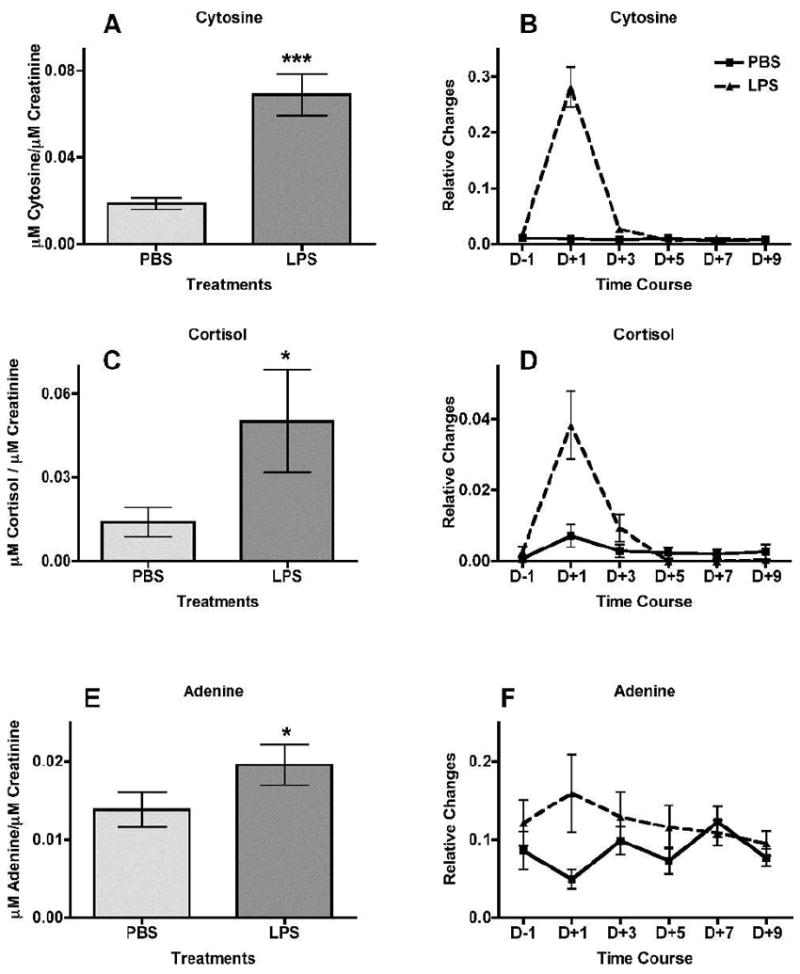
Treatment of mice with intraperitoneal injection of lipopolysaccharide (LPS, ▲) in phosphate buffered saline (PBS, ■, used as control) leads to increased urinary excretion of cytosine, cortisol and adenine at 24 h post-treatment (n = 12 for PBS and n = 11 for LPS, after removal of an outlier). These three ions were detected at the positive ionization mode. Urine samples were collected at 24 h prior to LPS treatment and subsequently at day 1 (24 h after treatment), day 3, day 5, day 7 and day 9. The levels of cytosine, cortisol and adenine (panels A, C and E, respectively), at 24 h after treatment are represented as μM of the metabolite/μM of creatinine. Panels B, D and F show the relative changes (peak area of the metabolite normalized to peak area of the respective sample’s creatinine). Mean normalized concentrations of cytosine (panel A), cortisol (panel C) and adenine (panel E) were compared to the corresponding means of controls (PBS-treated) at 24 h after treatment by the two-tailed Mann-Whitney U test and α = 0.05. Error bars represent means ± SEM; *** indicates a P value of <0.0001 for cytosine, and * indicates P = 0.0393 for both cortisol and adenine.
FIG. 3.
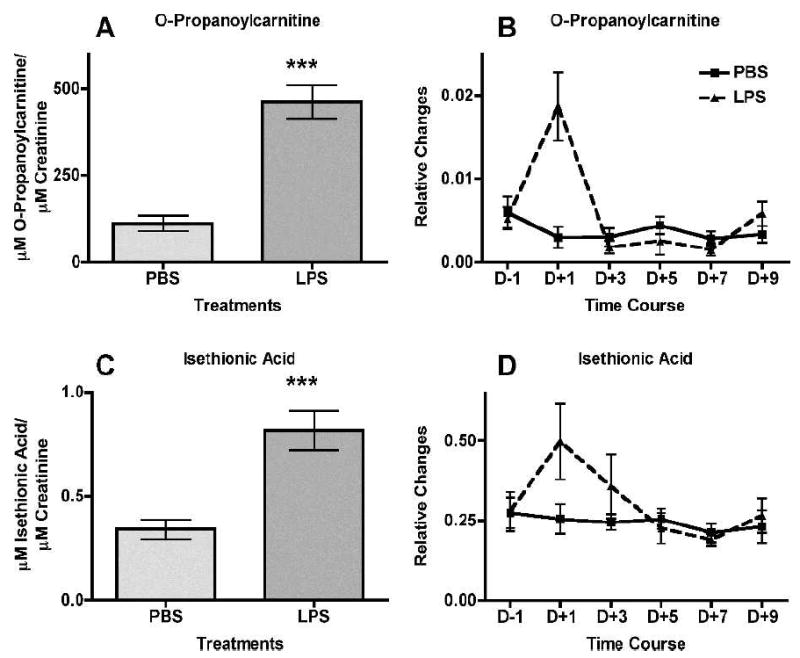
Treatment of mice with intraperitoneal injection of lipopolysaccharide (LPS, ▲) in phosphate-buffered saline (PBS, ■, used as control) leads to increased urinary excretion of O-propanoylcarnitine and isethionic acid at 24 h after treatment (n = 12 for PBS and n = 11 for LPS, after removal of an outlier). Both ions were detected at the negative ionization mode. Urine samples were collected at 24 h prior to LPS treatment and subsequently at day 1 (24 h after treatment), day 3, day 5, day 7 and day 9. The levels of O-propanoylcarnitine and isethionic acid (panels A and C, respectively) at 24 h after treatment are shown as μM of the metabolite/μM of creatinine. Panels B and D show relative changes (peak area of the metabolite normalized to peak area of the respective sample’s creatinine). Mean normalized concentrations of O-propanoylcarnitine (panel A) and mean normalized peak areas of isethionic acid (panel E) were compared to the corresponding means of controls (PBS-treated) at 24 h after treatment by a two-tailed Mann-Whitney U test and α = 0.05. Error bars represent means ± SEM and *** indicates a P value of <0.0001 for O-propanoylcarnitine and 0.0004 for isethionic acid.
Based on this consistency, levels of the five biomarkers were assessed in a time-course study. Urine samples from before treatment and after LPS treatment at days +1, +3, +5, +7 and +9 were analyzed on the UPLC-TOFMS and the relative changes by normalization to creatinine levels were calculated after extraction of the markers through MarkerLynx. As depicted in Fig. 2B, D and F and Fig. 3B and D, increased levels of the five markers were evident only on the first day (+1) after treatment, with the effect being transient and returning to normal levels in subsequent urine collections.
Assessment of LPS Biomarkers in Urine from Irradiated Mice
To assess the specificity of the identified LPS markers, their presence was investigated in urine samples from γ-irradiated mice. Peak areas for each of the LPS markers were determined with the software QuanLynx and divided by the peak areas of the appropriate internal standards (debrisoquine for positive ionization mode and 4-NBA for negative ionization mode). The ratio of each marker was normalized to the ratio of creatinine for each sample and averaged for each control (PBS) and each treatment (LPS, 3, 8 and 15 Gy). The results are presented in Fig. 4. Statistical analysis with one-way ANOVA with Dunnett multiple comparison correction, where each individual group was compared to the LPS group, showed statistically significant differences with P values ranging between 0.05 (*) and 0.01 (**). The P values determined through ANOVA for cytosine, cortisol, adenine, O-propanoylcarnitine and isethionic acid were <0.0001, 0.1834, 0.0292, 0.0003 and 0.401, respectively. Cytosine, adenine and O-propanoylcarnitine exhibited the greatest differences with levels in the irradiated groups remaining at the control levels. Cortisol showed an increase in the LPS-treated group compared to the PBS group, although the difference was not statistically significant. However, the levels of the irradiated groups were similar to those of the LPS group. Isethionic acid showed an elevation in the LPS group, although it was not statistically significant in this quantification.
FIG. 4.
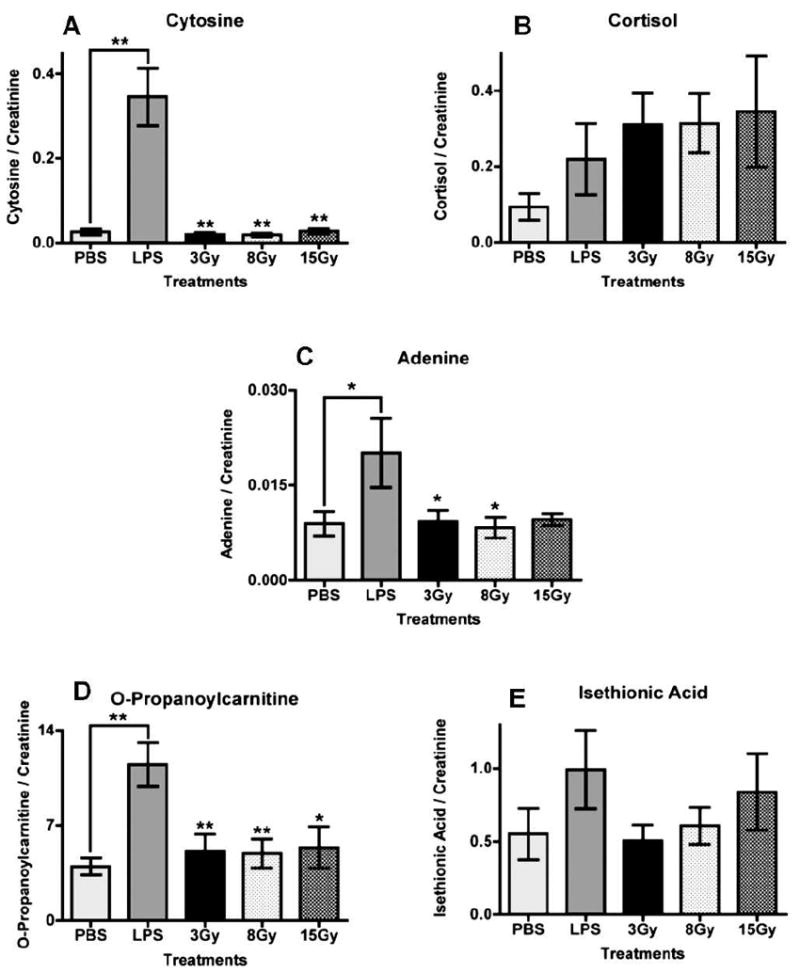
Investigation of the presence of markers (LPS-treated mice) in urine samples from mice exposed to various doses of γ radiation (3, 8 and 15 Gy) at 24 h after treatment. Mice given PBS were used as controls. Peak areas for each ion were divided by the peak area of an internal standard, debrisoquine for positive ionization mode and 4-NBA for negative. The ratio was normalized to the creatinine ratio for each sample, and mean levels for each treatment group were plotted. Data were analyzed with one-way analysis of variance (ANOVA) with Dunnett’s multiple comparison test (each group compared to LPS as the control group). The P values for panels A–E are <0.0001, 0.1834, 0.0292, 0.0003 and 0.401, respectively. Error bars represent mean values ± SEM. Asterisks represent significance at P values of <0.05 (*) and <0.01 (**).
Targeted metabolomics of taurine, nicotinate, uric acid and allantoin showed either trends of increased excretion in radiation-treated groups compared to the LPS group or no significant alterations (Supplementary Fig. 2, Supplementary Table 1; http://dx.doi.org/10.1667/RR2771.1.S1). Importantly, these markers showed statistically significant increases in the 8-Gy exposed mice compared to LPS-treated mice and no difference in excretion levels between LPS and PBS.
DISCUSSION
The threat of radiological and nuclear terrorism has become an increased concern after September 11, 2001. New methods for rapid identification of exposed individuals are necessary to facilitate effective triage of the general and at-risk populations (28). However, populations with underlying medical conditions that could mimic radiation exposure may receive unnecessary medical treatment and procedures or deplete medications from others that could benefit from them. Metabolomics of easily accessible biofluids such as urine has the potential to distinguish between different groups of individuals based on the construction of metabolic signatures. We used this method to identify metabolites in urine from LPS-treated mice to distinguish between conditions that elicit inflammatory responses, i.e. ionizing radiation and Gram-negative microbial exposure. Tyburski et al. (17, 18) and Lanz et al. (16) previously reported biomarkers of radiation exposure in mice and rats. In this study we identified markers of a relevant stressor (LPS) and compared the metabolic signatures to those of radiation to provide the potential for faster identification of radiation-exposed populations. Adenine, cytosine, O-propanoylcarnitine, isethionic acid and cortisol showed specificity to LPS exposure in comparison to urine from 3, 8 and 15 Gy γ-irradiated mice, whereas uric acid, allantoin and nicotinate were identified as differentiating radiation markers between the 8-Gy exposure group and the LPS-treated group.
As a potent endotoxin, LPS can induce hyperthermia, tachycardia, tachypnea, nausea and diarrhea (9, 10, 12, 13), symptoms that may be misinterpreted as resulting from acute radiation exposure during the response to a radiological event. In addition, LPS exposure can lead to septic shock-like state and ultimately death. Both radiation and endotoxins can also produce a strong immune response, manifested as activation of macrophages, release of cytokines such as TNF-α, IL-6 and CXC chemokines, and changes in gene expression of inducible nitric oxide synthase (iNOS) and cyclooxygenase-2 (COX-2) (9, 11, 29, 30, 31) in addition to Tx-M (11-dehydrothromboxane B2) and PGI-M (2′3-donor–6-keto-PGF1) produced by LPS (32). Moreover, both stressors elicit injury in various tissues. LPS can activate K+ channels, leading to ion perturbation, increased intracellular cAMP, and apoptosis in kidney cells (8, 33), whereas increased intracellular cAMP in immune cells protects against DNA damage-induced apoptosis (34). Although it has been reported in the literature that radiation is able to detoxify LPS by destruction of the polysaccharide moieties and alteration of the lipid A component (35), the doses required far exceed what would be likely encountered in a radiological event. However, the combination of radiation and additional exposure to LPS can lead to accelerated multiorgan failure with the necessity for an altered course of therapeutic treatment (36). Generation of a metabolic signature specific to LPS, as a surrogate for infection and sepsis, could therefore provide valuable information to medical personnel regarding the precise situation at hand and could be expanded in the future to include signatures of other stressors that could mimic the radiation responses.
As was the case with Tyburski et al. (18), there were no statistically significant differences in creatinine excretion between the control and treated groups (data not shown), indicating that glomerular filtration rates were not affected after treatment with LPS or radiation. Therefore, differences in metabolite levels should be attributed to the systemic effects of the stressors.
Purines and pyrimidines, specifically adenine and cytosine, were detected in urine samples from LPS-treated mice. In addition to their classic roles in RNA and DNA synthesis, they are involved in signal transduction and translation (37). LPS is known to cause a significant upregulation of extracellular ATP, ADP, AMP and adenosine, with a significant reduction of nucleotide hydrolysis 24 h after treatment (38). Adenosine production in particular has an anti-inflammatory role since adenosine receptor activation could contribute to reduction of lung edema often seen with LPS exposure (38, 39). Adenosine in turn can be converted to free adenine by S-adenosylhomocysteinase in the mouse liver, although this conversion is limited and slow to protect adenosine for cellular economy of this purine (40). The purine pathway in turn can be divided into the de novo and salvage pathways, with the salvage pathway having a dominant role under normal conditions. In the de novo pathway, inosine monophosphate (IMP) plays a central role in the production of AMP and GMP, with minimal conversion to adenine and guanine (37, 41). In the salvage pathway, adenine is converted to AMP with the enzymatic action of adenine phosphoribosyltransferase (APRT) (41). A deficiency of APRT can lead to accumulation of adenine, which is then excreted in the urine (41), or it is possible that adenine can be excreted as a waste product of the polyamine pathway (42, 43). The increased excretion of adenine in urine samples from LPS-treated mice could therefore be attributed to perturbations of the purine pathway with increased conversion of adenosine to adenine.
The presence of purine metabolites and cytosine in urine has been associated with immunodeficiencies in mice and humans (44, 45). Abnormally increased levels could be due to recurrent infections, whereas immunodeficient children housed in germ-free environments excrete purine metabolites below normal levels (45). It is possible that the increased cytosine in urine is based on the increased turnover of cytosine nucleotides in DNA due to increased activity of restriction and repair endonucleases, which could be acting upon altered methylation patterns (44). Additionally, increased cytosine excretion has been seen in patients with heart failure through 1H NMR, suggesting remodeling of the heart or increased catabolism in surrounding tissues (46). This is in accordance with a general phenomenon associated with LPS-induced septic shock, where LPS is responsible for heart failure and chronic cardiomyopathy by leading to diminishment of [Ca2+] and impairment of heart contractibility (47). Therefore, it is possible that exposure to LPS leads to cardiomyopathy, manifesting itself as excreted cytosine.
Although certain purine and pyrimidine markers were previously identified as markers of radiation exposure (17, 18), in this study adenine and cytosine showed specificity to LPS treatment. However, uric acid and allantoin exhibit increased levels in urine from mice exposed to 8 Gy and 15 Gy of γ rays compared to urine from LPS-treated mice (Supplementary Fig. 2; http://dx.doi.org/10.1667/RR2771.1.S1). No such change was exhibited in the urine of mice receiving 3 Gy, indicating that certain markers have the potential to be used for radiation dosimetry. Uric acid is the final product of the purine metabolism in humans and is synthesized in the liver, therefore indicating that radiationinduced excretion may be due to increased purine synthesis or direct failure of purine recycling, which leads to nucleotide depletion (48). As the most effective free radical scavenger, uric acid is decreased in the plasma of radiotherapy patients, probably as a result of oxidative stress (49). It is therefore an indication that at lower doses uric acid is being withheld in cells to cope with the oxidative stress, whereas at higher doses such as 8 Gy or 15 Gy extensive damage of cells leads to increased urinary excretion. It is also possible that at doses of 15 Gy all metabolic pathways are highly perturbed, leading to a metabolic shutdown, which can contribute to death within days. Allantoin, on the other hand, is a known marker of oxidative status in human urine, as was demonstrated by treatment of breast cancer patients with doxorubicin-based chemotherapy, which is known to induce oxidative stress (50). This has also been demonstrated in serum and plasma, leading to the conclusion that allantoin, a much more soluble compound, is a product of specific action of reactive oxygen species (ROS) on uric acid (51), since no enzymatic pathway exists in humans for the conversion of uric acid to allantoin. Although rapid induction of ROS is also attributed to LPS treatment and not only to radiation, LPS-generated ROS tend to subside and give rise to nitric oxide at later times (52), whereas radiation-generated ROS and subsequent oxidative stress are persistent (53). It is therefore possible that allantoin is produced throughout the 24-h period that was assessed in this radiation study, whereas it is not a marker of LPS treatment.
Irradiation with 8 Gy also appears to lead to significant alteration of metabolic pathways based on the statistically significant excretion of nicotinate (nicotinic acid, niacin) compared to LPS treatment (Supplementary Fig. 2; http://dx.doi.org/10.1667/RR2771.1.S1). This compound, a water-soluble vitamin of the B complex, is essential for metabolism of carbohydrates and fats. Its metabolites nicotinamide, NAD and NADP play a key role in numerous dehydrogenase reactions in the body (54, 55), and conservation of the NAD salvage pathway from nicotinamide or nicotinate is evident in bacteria such as Chlamydomonas reinhardtii (56). Nicotinamide, the downstream product from nicotinate, is known to inhibit endotoxin stimulated proinflammatory cytokine release in vitro (54). Therefore, this evidence indicates that not only are overall metabolism and energy pathways affected by the increased excretion of nicotinate, but the cytokine release is affected as well, further contributing to the hematopoietic syndrome exhibited at doses of 8 Gy of γ rays in mice.
As was mentioned previously, LPS elicits a massive inflammatory response. Cortisol, a glucocorticoid identified as one of the urinary markers of LPS exposure in this study, is one of the most important inhibitors of endogenous inflammation, and its secretion can be activated by psychological and physiological stress (57). Its LPS-dependent production is dependent on dose, as are temperature and heart rate (32), and it is thought to modulate the immune response by regulating inflammation at the genetic level (57), e.g. by suppressing IFN target genes. In IL-1α/β knockout mice, cortisol generation was lower compared to that in wild-type mice, indicating that certain cytokines may be important for the generation of protective agents against inflammatory reactions (58). The levels of cortisol and cytokines after LPS exposure do not appear to influence memory performance and selective attention or executive functions (59), although this is in contrast to the results of a study by Reichenberg et al. (60). Additionally, although patients can exhibit increased cortisol production, septic patients can exhibit insensitivity to cortisol and its benefits (57). However, given the results of this study, it may be possible that increased production of cortisol could lead to insufficient amounts for inflammatory regulation, given the increased amounts of excreted levels.
Another metabolite that displayed increased urinary excretion after LPS treatment was isethionic acid, a metabolite of taurine. Taurine has been shown to be a marker of radiation exposure (17) (Supplementary Fig. 2; http://dx.doi.org/10.1667/RR2771.1.S1) and can have cardioprotective effects, with high concentrations in various tissues (61) in addition to modulating neurotransmission (62). Isethionic acid is a normal component of tissues of higher animals, with involvement in excitability of tissues. The conversion of taurine to isethionic acid, although at a low rate, has been shown in dog heart slices and rat brain and has been observed in human urine (63, 64). Although Sturman et al. showed that most taurine is lost in urine (62), in our study we observed a high excretion of its metabolite isethionic acid, indicating that LPS modulates the conversion at a higher rate. Other studies, however, have shown that isethionic acid could be a product of intestinal bacterial activity, as has been seen with Klebsiella oxytoca (62, 64). With urinary metabolomic studies, the presence of microbial metabolites in the urine is possible and needs to be investigated further. In our study, higher levels of isethionic acid were observed only in the LPS- and 15-Gy treated mice, indicating that severe injury with endotoxins or genotoxic agents could lead to an increased presence of gastrointestinal markers in the urine.
A final metabolite exhibiting specificity to LPS treatment was identified as O-propanoylcarnitine, most commonly known as propionylcarnitine. Propionylcarnitine is a reliable marker of methylmalonic (MMA) and propionic (PA) aciduria, the two inborn errors of metabolism that were the first human diseases to be diagnosed using mass spectrometry (65). This accomplishment allowed for proof-of-concept application of metabolomics to clinical chemistry (65) and the future use of untargeted metabolomics for diagnosis. MMA and PA present with neurological symptoms, neutropenia, thrombocytopenia and non-regenerative anemia, which can all mimic sepsis (66). Increase of propionylcarnitine in urine, plasma and serum leads to depletion of carnitine levels (67-69) by traversal of the mitochondrial and cell membrane and elimination by the kidneys (70, 71), because kidneys can only absorb free carnitine. The depletion of carnitine can lead to muscle hypotonia (68); however, the presence of propionylcarnitine in the cytosol can improve energy supply and protection of plasma membranes from acidosis (70). Because propionylcarnitine is not derived from gut bacterial activity (66), its presence in urine after LPS treatment indicates a process of energy depletion of the host, through elimination of carnitine levels, and systemic inability to fight infection.
In conclusion, in case of a radiological emergency, effective triage of potentially exposed individuals will be time-sensitive. In a scenario such as this, exposure to radiation and symptoms of acute exposure could be mistaken for underlying medical conditions such as exposure to infectious agents and endotoxins, leading to delayed medical intervention. Rapid methods for distinguishing between radiation exposure and other unrelated illnesses are needed and metabolomics offers the potential to do so. Metabolic signatures specific for each agent could rapidly and effectively determine the medical course of action to be undertaken and also contribute to understanding the perturbations of the metabolic pathways. In this study, we identified increased excretion of adenine, cytosine, cortisol, O-propanoylcarnitine and isethionic acid as metabolites specific to LPS treatment. In addition, we showed that uric acid, nicotinate, taurine and allantoin exhibited statistically significant excretion after exposure to 8 Gy and 15 Gy of γ rays compared to LPS exposure, although nicotinate showed statistically significant excretion only with 8 Gy; taurine was previously identified by Tyburski et al. as a marker of 8 Gy of γ-ray exposure in mice (17). We therefore conclude that metabolomics has the potential to distinguish between different stressors, in this study between LPS and radiation treatments, with the identification of differential metabolic signatures and can lead to more rapid and effective medical intervention.
Acknowledgments
This work was funded by the National Institutes of Health (National Institute of Allergy and Infectious Diseases) grant U19 AI06773-02 and performed as part of the Columbia University Center for Medical Countermeasures against Radiation. The authors would like to acknowledge the Lombardi Comprehensive Cancer Center Proteomics and Metabolomics Shared Resource (PMSR) and Dr. Amrita Cheema, the co-director of PMSR, for their help in data acquisition and advice, as well as Dr. David J. Brenner for advice and encouragement.
Footnotes
Note. The online version of this article (DOI: http://dx.doi.org/10.1667/RR2771.1.S1) contains supplementary information that is available to all authorized users.
References
- 1.Maguire H, Fraser G, Croft J, Bailey M, Tattersall P, Morrey M, et al. Assessing public health risk in the London polonium-210 incident, 2006. Public Health. 2010;124:313–8. doi: 10.1016/j.puhe.2010.03.023. [DOI] [PubMed] [Google Scholar]
- 2.McFee RB, Leikin JB. Death by polonium-210: lessons learned from the murder of former Soviet spy Alexander Litvinenko. Semin Diagn Pathol. 2009;26:61–7. doi: 10.1053/j.semdp.2008.12.003. [DOI] [PubMed] [Google Scholar]
- 3.Anjos RM, Umisedo NK, Facure A, Yoshimura EM, Gomes PR, Okuno E. Goiania: 12 years after the 137Cs radiological accident. Radiat Prot Dosimetry. 2002;101:201–4. doi: 10.1093/oxfordjournals.rpd.a005967. [DOI] [PubMed] [Google Scholar]
- 4.The radiological accident in Goiania. Vienna: International Atomic Energy Agency; 1988. [Google Scholar]
- 5.DiCarlo AL, Ramakrishnan N, Hatchett RJ. Radiation combined injury: overview of NIAID research. Health Phys. 2010;98:863–7. doi: 10.1097/HP.0b013e3181a6ee32. [DOI] [PMC free article] [PubMed] [Google Scholar]
- 6.Donnelly EH, Nemhauser JB, Smith JM, Kazzi ZN, Farfan EB, Chang AS, et al. Acute radiation syndrome: assessment and management. South Med J. 2010;103:541–6. doi: 10.1097/SMJ.0b013e3181ddd571. [DOI] [PubMed] [Google Scholar]
- 7.Kuniak M, Azizova T, Day R, Wald N, Suyama J, Zhang A, et al. The Radiation Injury Severity Classification system: an early injury assessment tool for the frontline health-care provider. Br J Radiol. 2008;81:232–43. doi: 10.1259/bjr/25373719. [DOI] [PubMed] [Google Scholar]
- 8.Duranton C, Rubera I, L’hoste S, Cougnon M, Poujeol P, Barhanin J, et al. KCNQ1 K+ channels are involved in lipopolysaccharide-induced apoptosis of distal kidney cells. Cell Physiol Biochem. 2010;25:367–78. doi: 10.1159/000303041. [DOI] [PubMed] [Google Scholar]
- 9.Liang YC, Liu HJ, Chen SH, Chen CC, Chou LS, Tsai LH. Effect of lipopolysaccharide on diarrhea and gastrointestinal transit in mice: roles of nitric oxide and prostaglandin E2. World J Gastroenterol. 2005;11:357–61. doi: 10.3748/wjg.v11.i3.357. [DOI] [PMC free article] [PubMed] [Google Scholar]
- 10.Mathan VI, Penny GR, Mathan MM, Rowley D. Bacterial lipopolysaccharide-induced intestinal microvascular lesions leading to acute diarrhea. J Clin Invest. 1988;82:1714–21. doi: 10.1172/JCI113785. [DOI] [PMC free article] [PubMed] [Google Scholar]
- 11.Opal SM. The host response to endotoxin, antilipopolysaccharide strategies, and the management of severe sepsis. Int J Med Microbiol. 2007;297:365–77. doi: 10.1016/j.ijmm.2007.03.006. [DOI] [PubMed] [Google Scholar]
- 12.Bahador M, Cross AS. From therapy to experimental model: a hundred years of endotoxin administration to human subjects. J Endotoxin Res. 2007;13:251–79. doi: 10.1177/0968051907085986. [DOI] [PubMed] [Google Scholar]
- 13.Rittirsch D, Hoesel LM, Ward PA. The disconnect between animal models of sepsis and human sepsis. J Leukoc Biol. 2007;81:137–43. doi: 10.1189/jlb.0806542. [DOI] [PubMed] [Google Scholar]
- 14.Patterson AD, Lanz C, Gonzalez FJ, Idle JR. The role of mass spectrometry-based metabolomics in medical countermeasures against radiation. Mass Spectrom Rev. 2010;29:503–21. doi: 10.1002/mas.20272. [DOI] [PMC free article] [PubMed] [Google Scholar]
- 15.Johnson CH, Patterson AD, Krausz KW, Lanz C, Kang DW, Luecke H, et al. Radiation metabolomics. 4. UPLC-ESI-QTOFMS-based metabolomics for urinary biomarker discovery in gamma-irradiated rats. Radiat Res. 2011;175:473–84. doi: 10.1667/RR2437.1. [DOI] [PMC free article] [PubMed] [Google Scholar]
- 16.Lanz C, Patterson AD, Slavik J, Krausz KW, Ledermann M, Gonzalez FJ, et al. Radiation metabolomics. 3. Biomarker discovery in the urine of gamma-irradiated rats using a simplified metabolomics protocol of gas chromatography-mass spectrometry combined with random forests machine learning algorithm. Radiat Res. 2009;172:198–212. doi: 10.1667/RR1796.1. [DOI] [PMC free article] [PubMed] [Google Scholar]
- 17.Tyburski JB, Patterson AD, Krausz KW, Slavik J, Fornace AJ, Jr, Gonzalez FJ, et al. Radiation metabolomics. 1. Identification of minimally invasive urine biomarkers for gamma-radiation exposure in mice. Radiat Res. 2008;170:1–14. doi: 10.1667/RR1265.1. [DOI] [PMC free article] [PubMed] [Google Scholar]
- 18.Tyburski JB, Patterson AD, Krausz KW, Slavik J, Fornace AJ, Jr, Gonzalez FJ, et al. Radiation metabolomics. 2. Dose- and time-dependent urinary excretion of deaminated purines and pyrimidines after sublethal gamma-radiation exposure in mice. Radiat Res. 2009;172:42–57. doi: 10.1667/RR1703.1. [DOI] [PMC free article] [PubMed] [Google Scholar]
- 19.Laiakis EC, Morris GA, Fornace AJ, Howie SR. Metabolomic analysis in severe childhood pneumonia in the Gambia, West Africa: findings from a pilot study. PLoS One. 2010;5:12655. doi: 10.1371/journal.pone.0012655. [DOI] [PMC free article] [PubMed] [Google Scholar]
- 20.Rocha CM, Barros AS, Gil AM, Goodfellow BJ, Humpfer E, Spraul M, et al. Metabolic profiling of human lung cancer tissue by 1H high resolution magic angle spinning (HRMAS) NMR spectroscopy. J Proteome Res. 2010;9:319–32. doi: 10.1021/pr9006574. [DOI] [PubMed] [Google Scholar]
- 21.Sreekumar A, Poisson LM, Rajendiran TM, Khan AP, Cao Q, Yu J, et al. Metabolomic profiles delineate potential role for sarcosine in prostate cancer progression. Nature. 2009;457:910–4. doi: 10.1038/nature07762. [DOI] [PMC free article] [PubMed] [Google Scholar] [Research Misconduct Found]
- 22.Calvani R, Capuani G, Tomassini Miccheli A, Puccetti C, Delfini M, et al. Gut microbiome-derived metabolites characterize a peculiar obese urinary metabotype. Int J Obes (Lond) 2010;34:1095–8. doi: 10.1038/ijo.2010.44. [DOI] [PubMed] [Google Scholar]
- 23.Wikoff WR, Anfora AT, Liu J, Schultz PG, Lesley SA, Peters EC, et al. Metabolomics analysis reveals large effects of gut microflora on mammalian blood metabolites. Proc Natl Acad Sci U S A. 2009;106:3698–703. doi: 10.1073/pnas.0812874106. [DOI] [PMC free article] [PubMed] [Google Scholar]
- 24.Li HH, Aubrecht J, Fornace AJ., Jr Toxicogenomics: overview and potential applications for the study of non-covalent DNA interacting chemicals. Mutat Res. 2007;623:98–108. doi: 10.1016/j.mrfmmm.2007.03.013. [DOI] [PubMed] [Google Scholar]
- 25.McCurley MC, Miller CW, Tucker FE, Guinn A, Donnelly E, Ansari A, et al. Educating medical staff about responding to a radiological or nuclear emergency. Health Phys. 2009;96(Suppl 2):S50–4. doi: 10.1097/01.HP.0000339001.77899.15. [DOI] [PubMed] [Google Scholar]
- 26.Wilkinson D. Dealing with at-risk populations in radiological/nuclear emergencies. Radiat Prot Dosimetry. 2009;134:136–42. doi: 10.1093/rpd/ncp070. [DOI] [PubMed] [Google Scholar]
- 27.Breiman L. Random forests. Machine Learning. 2001;45:5–32. [Google Scholar]
- 28.Waselenko JK, MacVittie TJ, Blakely WF, Pesik N, Wiley AL, Dickerson WE, et al. Medical management of the acute radiation syndrome: recommendations of the Strategic National Stockpile Radiation Working Group. Ann Intern Med. 2004;140:1037–51. doi: 10.7326/0003-4819-140-12-200406150-00015. [DOI] [PubMed] [Google Scholar]
- 29.Laiakis EC, Baulch JE, Morgan WF. Cytokine and chemokine responses after exposure to ionizing radiation: implications for the astronauts. Adv Space Res. 2007;39:1019–25. [Google Scholar]
- 30.McBride WH, Chiang CS, Olson JL, Wang CC, Hong JH, Pajonk F, et al. A sense of danger from radiation. Radiat Res. 2004;162:1–19. doi: 10.1667/rr3196. [DOI] [PubMed] [Google Scholar]
- 31.Zhou H, Ivanov VN, Gillespie J, Geard CR, Amundson SA, Brenner DJ, et al. Mechanism of radiation-induced bystander effect: role of the cyclooxygenase-2 signaling pathway. Proc Natl Acad Sci U S A. 2005;102:14641–6. doi: 10.1073/pnas.0505473102. [DOI] [PMC free article] [PubMed] [Google Scholar]
- 32.McAdam BF, Mardini IA, Habib A, Burke A, Lawson JA, Kapoor S, et al. Effect of regulated expression of human cyclooxygenase isoforms on eicosanoid and isoeicosanoid production in inflammation. J Clin Invest. 2000;105:1473–82. doi: 10.1172/JCI9523. [DOI] [PMC free article] [PubMed] [Google Scholar]
- 33.Zhao W, Robbins ME. Inflammation and chronic oxidative stress in radiation-induced late normal tissue injury: therapeutic implications. Curr Med Chem. 2009;16:130–43. doi: 10.2174/092986709787002790. [DOI] [PubMed] [Google Scholar]
- 34.Naderi EH, Findley HW, Ruud E, Blomhoff HK, Naderi S. Activation of cAMP signaling inhibits DNA damage-induced apoptosis in BCP-ALL cells through abrogation of p53 accumulation. Blood. 2009;114:608–18. doi: 10.1182/blood-2009-02-204883. [DOI] [PubMed] [Google Scholar]
- 35.Csako G, Elin RJ, Hochstein HD, Tsai CM. Physical and biological properties of U.S. standard endotoxin EC after exposure to ionizing radiation. Infect Immun. 1983;41:190–6. doi: 10.1128/iai.41.1.190-196.1983. [DOI] [PMC free article] [PubMed] [Google Scholar]
- 36.Gridley DS, Miller GM, Pecaut MJ. Radiation and primary response to lipopolysaccharide: bone marrow-derived cells and susceptible organs. In Vivo. 2007;21:453–61. [PubMed] [Google Scholar]
- 37.Jurecka A. Inborn errors of purine and pyrimidine metabolism. J Inherit Metab Dis. 2009;32:247–63. doi: 10.1007/s10545-009-1094-z. [DOI] [PubMed] [Google Scholar]
- 38.Vuaden FC, de Paula Cognato G, Bonorino C, Bogo MR, de Freitas Sarkis JJ, Bonan CD. Lipopolysaccharide alters nucleotidase activities from lymphocytes and serum of rats. Life Sci. 2007;80:1784–91. doi: 10.1016/j.lfs.2007.02.015. [DOI] [PubMed] [Google Scholar]
- 39.Heller AR, Rothermel J, Weigand MA, Plaschke K, Schmeck J, Wendel M, et al. Adenosine A1 and A2 receptor agonists reduce endotoxin-induced cellular energy depletion and oedema formation in the lung. Eur J Anaesthesiol. 2007;24:258–66. doi: 10.1017/S026502150600144X. [DOI] [PubMed] [Google Scholar]
- 40.Saebo J, Ueland PM. A study on the sequestration of adenosine and its conversion to adenine by the cyclic AMP-adenosine binding protein/S-adenosylhomocysteinase from mouse liver. Biochim Biophys Acta. 1979;587:333–40. doi: 10.1016/0304-4165(79)90437-9. [DOI] [PubMed] [Google Scholar]
- 41.Nyhan WL. Disorders of purine and pyrimidine metabolism. Mol Genet Metab. 2005;86:25–33. doi: 10.1016/j.ymgme.2005.07.027. [DOI] [PubMed] [Google Scholar]
- 42.Bollee G, Dollinger C, Boutaud L, Guillemot D, Bensman A, Harambat J, et al. Phenotype and genotype characterization of adenine phosphoribosyltransferase deficiency. J Am Soc Nephrol. 2010;21:679–88. doi: 10.1681/ASN.2009080808. [DOI] [PMC free article] [PubMed] [Google Scholar]
- 43.Micheli V, Massarino F, Jacomelli G, Bartelli M, Corradi MR, Guerrini A, et al. Adenine phosphoribosyltransferase (APRT) deficiency: a new genetic mutation with early recurrent renal stone disease in kidney transplantation. Nephrol Dial Transplant. 2010;3:436–8. doi: 10.1093/ndtplus/sfq096. [DOI] [PMC free article] [PubMed] [Google Scholar]
- 44.Mills GC, Schmalstieg FC, Newkirk KE, Goldblum RM. Cytosine and orotic acid in urine of immunodeficient children. Clin Chem. 1979;25:419–24. [PubMed] [Google Scholar]
- 45.Mills GC, Schmalstieg FC, Koolkin RJ, Goldblum RM. Urinary excretion of purines, purine nucleosides, and pseudouridine in immunodeficient children. Biochem Med. 1982;27:37–45. doi: 10.1016/0006-2944(82)90006-0. [DOI] [PubMed] [Google Scholar]
- 46.Kang SM, Park JC, Shin MJ, Lee H, Oh J, Ryu DH, et al. 1H nuclear magnetic resonance based metabolic urinary profiling of patients with ischemic heart failure. Clin Biochem. 2011;44:293–9. doi: 10.1016/j.clinbiochem.2010.11.010. [DOI] [PubMed] [Google Scholar]
- 47.Wondergem R, Graves BM, Ozment-Skelton TR, Li C, Williams DL. Lipopolysaccharides directly decrease Ca2+ oscillations and the hyperpolarization-activated nonselective cation current If in immortalized HL-1 cardiomyocytes. Am J Physiol Cell Physiol. 2010;299:C665–71. doi: 10.1152/ajpcell.00129.2010. [DOI] [PMC free article] [PubMed] [Google Scholar]
- 48.Simoni RE, Gomes LN, Scalco FB, Oliveira CP, Aquino Neto FR, de Oliveira ML. Uric acid changes in urine and plasma: an effective tool in screening for purine inborn errors of metabolism and other pathological conditions. J Inherit Metab Dis. 2007;30:295–309. doi: 10.1007/s10545-007-0455-8. [DOI] [PubMed] [Google Scholar]
- 49.Roszkowski K, Gackowski D, Rozalski R, Dziaman T, Siomek A, Guz J, et al. Small field radiotherapy of head and neck cancer patients is responsible for oxidatively damaged DNA/oxidative stress on the level of a whole organism. Int J Cancer. 2008;123:1964–7. doi: 10.1002/ijc.23700. [DOI] [PubMed] [Google Scholar]
- 50.Il’yasova D, Spasojevic I, Wang F, Tolun AA, Base K, Young SP, et al. Urinary biomarkers of oxidative status in a clinical model of oxidative assault. Cancer Epidemiol Biomarkers Prev. 2010;19:1506–10. doi: 10.1158/1055-9965.EPI-10-0211. [DOI] [PMC free article] [PubMed] [Google Scholar]
- 51.Causse E, Pradelles A, Dirat B, Negre-Salvayre A, Salvayre R, Couderc F. Simultaneous determination of allantoin, hypoxanthine, xanthine, and uric acid in serum/plasma by CE. Electrophoresis. 2007;28:381–7. doi: 10.1002/elps.200600205. [DOI] [PubMed] [Google Scholar]
- 52.Hsu HY, Wen MH. Lipopolysaccharide-mediated reactive oxygen species and signal transduction in the regulation of interleukin-1 gene expression. J Biol Chem. 2002;277:22131–9. doi: 10.1074/jbc.M111883200. [DOI] [PubMed] [Google Scholar]
- 53.Spitz DR, Azzam EI, Li JJ, Gius D. Metabolic oxidation/reduction reactions and cellular responses to ionizing radiation: a unifying concept in stress response biology. Cancer Metastasis Rev. 2004;23:311–22. doi: 10.1023/B:CANC.0000031769.14728.bc. [DOI] [PubMed] [Google Scholar]
- 54.Lang R, Wahl A, Skurk T, Yagar EF, Schmiech L, Eggers R, et al. Development of a hydrophilic liquid interaction chromatography-high- performance liquid chromatography-tandem mass spectrometry based stable isotope dilution analysis and pharmacokinetic studies on bioactive pyridines in human plasma and urine after coffee consumption. Anal Chem. 2010;82:1486–97. doi: 10.1021/ac902616k. [DOI] [PubMed] [Google Scholar]
- 55.Mullangi R, Srinivas NR. Niacin and its metabolites: role of LCMS/ MS bioanalytical methods and update on clinical pharmacology. An overview. Biomed Chromatogr. 2011;25:218–37. doi: 10.1002/bmc.1522. [DOI] [PubMed] [Google Scholar]
- 56.Lin H, Kwan AL, Dutcher SK. Synthesizing and salvaging NAD: lessons learned from Chlamydomonas reinhardtii. PLoS Genet. 2010;6:e1001105. doi: 10.1371/journal.pgen.1001105. [DOI] [PMC free article] [PubMed] [Google Scholar]
- 57.Billing AM, Fack F, Turner JD, Muller CP. Cortisol is a potent modulator of lipopolysaccharide-induced interferon signaling in macrophages. Innate Immun. 2011;17:302–20. doi: 10.1177/1753425910369269. [DOI] [PubMed] [Google Scholar]
- 58.Oguri S, Motegi K, Iwakura Y, Endo Y. Primary role of interleukin-1 alpha and interleukin-1 beta in lipopolysaccharide-induced hypoglycemia in mice. Clin Diagn Lab Immunol. 2002;9:1307–12. doi: 10.1128/CDLI.9.6.1307-1312.2002. [DOI] [PMC free article] [PubMed] [Google Scholar]
- 59.Grigoleit JS, Oberbeck JR, Lichte P, Kobbe P, Wolf OT, Montag T, et al. Lipopolysaccharide-induced experimental immune activation does not impair memory functions in humans. Neurobiol Learn Mem. 2010;94:561–7. doi: 10.1016/j.nlm.2010.09.011. [DOI] [PubMed] [Google Scholar]
- 60.Reichenberg A, Yirmiya R, Schuld A, Kraus T, Haack M, Morag A, et al. Cytokine-associated emotional and cognitive disturbances in humans. Arch Gen Psychiatry. 2001;58:445–52. doi: 10.1001/archpsyc.58.5.445. [DOI] [PubMed] [Google Scholar]
- 61.Zhang X, Tenner TEJ, Lombardini JB. Inhibition of rat vascular smooth muscle cell proliferation by taurine and taurine analogues. Biochem Pharmacol. 1999;57:1331–9. doi: 10.1016/s0006-2952(99)00037-4. [DOI] [PubMed] [Google Scholar]
- 62.Sturman JA, Hepner GW, Hofmann AF, Thomas PJ. Metabolism of [35S]taurine in man. J Nutr. 1975;105:1206–14. doi: 10.1093/jn/105.9.1206. [DOI] [PubMed] [Google Scholar]
- 63.Huxtable R, Bressler R. Taurine and isethionic acid: distribution and interconversion in the rat. J Nutr. 1972;102:805–14. doi: 10.1093/jn/102.7.805. [DOI] [PubMed] [Google Scholar]
- 64.Styp von Rekowski K, Denger K, Cook AM. Isethionate as a product from taurine during nitrogen-limited growth of Klebsiella oxytoca TauN1. Arch Microbiol. 2005;183:325–30. doi: 10.1007/s00203-005-0776-7. [DOI] [PubMed] [Google Scholar]
- 65.Wikoff WR, Gangoiti JA, Barshop BA, Siuzdak G. Metabolomics identifies perturbations in human disorders of propionate metabolism. Clin Chem. 2007;53:2169–76. doi: 10.1373/clinchem.2007.089011. [DOI] [PubMed] [Google Scholar]
- 66.Ogier de Baulny H, Saudubray JM. Branched-chain organic acidurias. Semin Neonatol. 2002;7:65–74. doi: 10.1053/siny.2001.0087. [DOI] [PubMed] [Google Scholar]
- 67.Deodato F, Boenzi S, Santorelli FM, Dionisi-Vici C. Methylmalonic and propionic aciduria. Am J Med Genet C Semin Med Genet. 2006;142C:104–12. doi: 10.1002/ajmg.c.30090. [DOI] [PubMed] [Google Scholar]
- 68.Duran M, Ketting D, Beckeringh TE, Leupold D, Wadman SK. Direct identification of propionylcarnitine in propionic acidaemia: biochemical and clinical results of oral carnitine supplementation. J Inherit Metab Dis. 1986;9:202–7. doi: 10.1007/BF01799460. [DOI] [PubMed] [Google Scholar]
- 69.Lucke T, Perez-Cerda C, Baumgartner M, Fowler B, Sander S, Sasse M, et al. Propionic acidemia: unusual course with late onset and fatal outcome. Metabolism. 2004;53:809–10. doi: 10.1016/j.metabol.2003.12.025. [DOI] [PubMed] [Google Scholar]
- 70.Hulsmann WC. Biochemical profile of propionyl-l-carnitine. Cardiovasc Drugs Ther. 1991;5(Suppl 1):7–9. doi: 10.1007/BF00128237. [DOI] [PubMed] [Google Scholar]
- 71.Siliprandi N, Di Lisa F, Menabo R. Propionyl-l-carnitine: biochemical significance and possible role in cardiac metabolism. Cardiovasc Drugs Ther. 1991;5(Suppl 1):11–5. doi: 10.1007/BF00128238. [DOI] [PubMed] [Google Scholar]