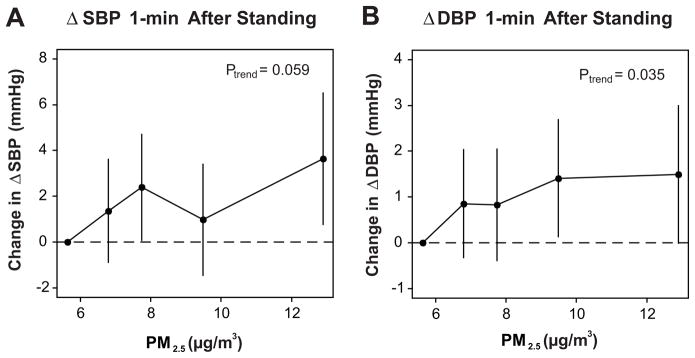
Figure 2.
Dose-response relationship between quintiles of mean PM2.5 levels 7 days prior to assessment and change in ΔSBP (A.) and ΔDBP (B.) 1 minute after standing, controlling for potential confounders as in Figure 1. Solid circles denote the magnitude of the association at quintiles of exposure and the vertical lines denote 95% confidence intervals. The x-axis shows the median PM2.5 levels (μg/m3) in each quintile.

