

Abstract
Chronic stroke patients with heterogeneous lesions, but no direct damage to the primary sensorimotor cortex, are capable of longitudinally acquiring the ability to modulate sensorimotor rhythms using grasping imagery of the affected hand. Volitional modulation of neural activity can be used to drive grasping functions of the paralyzed hand through a brain–computer interface. The neural substrates underlying this skill are not known. Here, we investigated the impact of individual patient's lesion pathology on functional and structural network integrity related to this volitional skill. Magnetoencephalography data acquired throughout training was used to derive functional networks. Structural network models and local estimates of extralesional white matter microstructure were constructed using T1-weighted and diffusion-weighted magnetic resonance imaging data. We employed a graph theoretical approach to characterize emergent properties of distributed interactions between nodal brain regions of these networks. We report that interindividual variability in patients’ lesions led to differential impairment of functional and structural network characteristics related to successful post-training sensorimotor rhythm modulation skill. Patients displaying greater magnetoencephalography global cost-efficiency, a measure of information integration within the distributed functional network, achieved greater levels of skill. Analysis of lesion damage to structural network connectivity revealed that the impact on nodal betweenness centrality of the ipsilesional primary motor cortex, a measure that characterizes the importance of a brain region for integrating visuomotor information between frontal and parietal cortical regions and related thalamic nuclei, correlated with skill. Edge betweenness centrality, an analogous measure, which assesses the role of specific white matter fibre pathways in network integration, showed a similar relationship between skill and a portion of the ipsilesional superior longitudinal fascicle connecting premotor and posterior parietal visuomotor regions known to be crucially involved in normal grasping behaviour. Finally, estimated white matter microstructure integrity in regions of the contralesional superior longitudinal fascicle adjacent to primary sensorimotor and posterior parietal cortex, as well as grey matter volume co-localized to these specific regions, positively correlated with sensorimotor rhythm modulation leading to successful brain–computer interface control. Thus, volitional modulation of ipsilesional neural activity leading to control of paralyzed hand grasping function through a brain–computer interface after longitudinal training relies on structural and functional connectivity in both ipsilesional and contralesional parietofrontal pathways involved in visuomotor information processing. Extant integrity of this structural network may serve as a future predictor of response to longitudinal therapeutic interventions geared towards training sensorimotor rhythms in the lesioned brain, secondarily improving grasping function through brain–computer interface applications.
Keywords: motor learning, skill, stroke, rehabilitation, brain–computer interface, imagery
Introduction
Chronic stroke is a leading cause of long term motor disability among adults, as rehabilitative interventions are largely unsuccessful in improving the most severe cases of motor impairment following the event (Lai et al., 2002). This lack of recovery is particularly exacerbated in the case of hand function (Krakauer, 2005). The human brain selects and executes reaching and grasping actions through the dynamic linkage of specific neuron populations into functional networks (Shadmehr and Wise, 2005). These networks are continuously sculpted through modifications of underlying anatomical microstructure, which optimize and buttress advantageous interaction patterns through experience-based plasticity mechanisms triggered by evaluation of contingent goals, actions and sensory consequences (Johansen-Berg, 2007; Holtmaat and Svoboda, 2009; Wilbrecht et al., 2010). When the brain suffers a substantial injury, such as following stroke, a proportion of the anatomical components of these networks may be compromised and result in radically perturbed functional dynamics (Honey and Sporns, 2008; Alstott et al., 2009). In a finite acute window following the event, a state of synaptic instability occurs within peri-infarct regions that allows for rapid reorganization of constituent networks (Dancause et al., 2006; Brown et al., 2007; Murphy and Corbett, 2009; Dimyan and Cohen, 2011; Yu and Zuo, 2011). Although plasticity within these networks may attenuate once the subacute phase is reached, a considerable capacity for reorganization is still maintained that continues throughout the chronic phase, as well (Ward, 2005; Nudo, 2006; Sawaki et al., 2008; Murphy and Corbett, 2009).
It has been repeatedly shown that physical training in acute, subacute and chronic stages of stroke is capable of influencing compensatory functional network interaction patterns and underlying anatomical microstructure (Nudo, 2006). This is the scientific basis for a majority of novel rehabilitation strategies that are progressively used in clinical settings, including constraint-induced movement therapy (Taub et al., 1993; Wolf et al., 2010) or active forms of robotic-assisted upper limb therapy, in which the robot amplifies intrinsic muscle forces produced by the patient to assist in the completion of a visuomotor task (Fasoli et al., 2003; Lo et al., 2010). A major limitation to these types of interventions, however, is that they fail to be inclusive of patients with severe hand function deficits, as their implementation relies on the presence of some residual motor function. In many clinical trials, this has meant the exclusion of up to 80% of otherwise eligible patients (Grotta et al., 2004; Sawaki et al., 2008). In patients experiencing severe paralysis, contingencies between overt actions and consequences can no longer be used to drive reorganization within functional brain networks, making them prone to devolution towards a maladaptive state indicative of learned disuse (Krakauer, 2006; Pomeroy et al., 2011). Several recent studies suggest that functional network organization may be impacted through operant conditioning paradigms that use neurofeedback to establish new contingencies between volitional modulation of neural activity and extrinsic sensory feedback (Jarosiewicz et al., 2008; Legenstein et al., 2010). Thus, interventions that train patients to acquire volitional control of neural activity modulation may be beneficial for this particular group of patients with stroke (Grosse-Wentrup et al., 2011a).
Motor imagery is one strategy used to condition voluntary control of neural activity in visuomotor networks. Several neuroimaging and electrophysiological studies have observed that motor imagery of grasping movements, the conscious rehearsal of egocentric motor actions without overt motor output (Jeannerod et al., 1995), engages bilateral parietofrontal networks in a similar manner to executed movements (McFarland et al., 2000; Pfurtscheller, 2000; Sharma et al., 2008, 2009a, b; Gao et al., 2010). As a result, motor imagery training has been investigated as a means of actively engaging extant motor networks in chronic stroke populations with severe hand function deficits (Sharma et al., 2006; Page et al., 2007, 2009). More recently, augmentation of motor imagery training with brain–computer interface technology, which implements exogenous contingencies between neural activity and sensory feedback, has been promoted as a possible strategy for increasing the efficacy of this type of rehabilitation through the establishment of explicit links between neural activity modulation related to covert motor intentions, and sensory consequences (Daly and Wolpaw, 2008; Wang et al., 2010b). Additionally, brain–computer interface approaches can provide direct brain control of mechanical orthoses, robotic exoskeleton devices or functional electrical stimulation systems interfaced with the impaired limb leading to restoration of function (Birbaumer and Cohen, 2007). To that end, we have previously reported that a group of patients with chronic stroke with severe hand paralysis can longitudinally learn to control a non-invasive brain–computer interface that operates a mechanical hand orthosis through volitional modulation of sensorimotor rhythms recorded over the ipsilesional hemisphere (Buch et al., 2008). The neural substrates underlying the ability of patients with stroke to successfully control volitional sensorimotor rhythm modulation through motor imagery are not known. One approach to address this question is to evaluate the impact of each individual patient's pathology on characteristics of engaged anatomical and functional cortical networks.
In the past few years, both structural and functional connectivity neuroimaging data have been increasingly modelled using an applied form of graph theory known as complex network analysis (Sporns, 2011). This analytical approach attempts to explicitly characterize both the direct and indirect extrinsic contributions to regional function in the brain (Passingham et al., 2002). Complex network graphs and other methods that quantify interactions between brain regions have recently given new insight into the spontaneous reorganization of functional and structural brain networks following stroke (Nomura et al., 2010; Wang et al., 2010a; Crofts et al., 2011; Grefkes and Fink, 2011; Rehme et al., 2011b). Several studies suggest that one property of these networks, cost-efficiency, is an important optimization principle that governs both structural and functional brain network architecture (Fornito et al., 2011). Highly cost-efficient networks preferentially employ long-range connectivity, allowing for faster and more robust information transfer between discrete brain regions, while at the same time minimizing the related energy cost of fibre pathway maintenance (Laughlin and Sejnowski, 2003; Buzsaki et al., 2004; Achard and Bullmore, 2007). This property appears to have behavioural implications as well, since it has been shown to correlate with memory and intellectual performance in both healthy volunteers and patient groups (Bassett et al., 2009; van den Heuvel et al., 2009). A related local property of network graphs, betweenness centrality, highlights specific brain regions or white matter fibre pathways that are particularly important for functional integration between distant brain areas (Rubinov and Sporns, 2010), and has been shown to predict motor hand recovery in stroke (Wang et al., 2010a). This property also reveals locations within networks where functional dynamics are more vulnerable to the impact of brain lesions (Honey and Sporns, 2008; Alstott et al., 2009). Exploration of these two properties of brain networks may lead to more insight into relationships between abnormal brain activation patterns, and behavioural deficits or recovery following stroke (Grefkes and Fink, 2011). Moreover, as these properties are described within a topological framework and can be related non-spatially, they hold a distinct advantage over voxel-based techniques for characterizing pathological changes in brain connectivity in heterogeneous stroke populations (Crofts et al., 2011).
Here, we employed a combination of neuroimaging modalities, including magnetoencephalography, and diffusion and T1-weighted structural MRI, to evaluate the impact of each individual patient's lesion pathology on their ability to modulate ipsilesional sensorimotor rhythm power (using affected hand motor imagery strategies) after longitudinal brain–computer interface training. For the first time, we use a complex network analytical approach to understand the neural substrates of voluntary modulation of neural activity through operant conditioning after chronic stroke. We hypothesized that the longitudinally acquired skill of volitional neural activity modulation would be directly related to extant parietofrontal structural network integrity facilitating communication between premotor, primary motor and posterior parietal visuomotor cortical regions normally involved in grasping function.
Patients and methods
Patients
Patients with chronic hand plegia resulting from a single subcortical or mixed (cortical and subcortical) stroke (n = 8; mean age = 58.4 ± 8.4 years, mean duration = 31.5 ± 18.2 months) were recruited from the Human Cortical Physiology and Stroke Neurorehabilitation Section of the National Institute for Neurological Disorders and Stroke (n = 6) and the Clinic of Neurology of the University of Tübingen (n = 2). Patients were included in the study if they had a history of a single stroke, and expressed residual finger extension strength rated as 0/5 on the Medical Research Council (MRC) scale (Table 1). All patients also had either a 0/5 or 1/5 MRC score for finger flexion strength and were incapable of voluntary finger extension in the plegic hand. Shoulder, elbow and finger flexor and extensor spasticity was rated as ≤3 on the Modified Ashworth Scale for all patients. These criteria ensured that the affected arm could maintain a comfortable posture while seated in the magnetoencephalography chair, and that movement of the affected hand could only be produced via passive manipulation from the attached orthosis. Cognitive function was assessed using the Mini-Mental State Examination (Folstein et al., 1975), and found to be in the normal range (all patients scored ≥23 out of 30). Patients provided written informed consent and the study was approved by the Institutional Review Board of the National Institute of Neurological Disorders and Stroke and the Ethical Committee of the Faculty of Medicine of the University of Tübingen. Individual patient lesions and group probability lesion maps can be seen in Fig. 1.
Table 1.
Patient lesion characteristics
| Patient | Age (years) | Sex | Ipsilesional hemisphere | Time post stroke (m) | Total lesion volume (cm3) | Grey matter proportion of lesion | White matter proportion of lesion | MRC score of residual finger flexion/extension (out of 5) | |
|---|---|---|---|---|---|---|---|---|---|
| SP1 | 63 | F | Right | 30 | 80.00 | 0.15 | 0.83 | 0/0 | |
| SP2 | 64 | F | Right | 69 | 25.39 | 0.17 | 0.83 | 1/0 | |
| SP3 | 53 | M | Left | 25 | 57.16 | 0.17 | 0.81 | 0/0 | |
| SP4 | 55 | M | Right | 41 | 14.93 | 0.16 | 0.83 | 1/0 | |
| SP5 | 53 | M | Left | 12 | 7.41 | 0.19 | 0.78 | 0/0 | |
| SP6 | 67 | M | Right | 14 | 4.10 | 0.26 | 0.74 | 0/0 | |
| SP7 | 44 | F | Right | 24 | 17.57 | 0.05 | 0.95 | 0/0 | |
| SP8 | 68 | M | Right | 37 | 64.10 | 0.18 | 0.80 | 1/0 | |
| Mean ± SD | 58.38 ± 8.42 | 31.50 ± 18.19 | 33.83 ± 28.95 | 0.17 ± 0.06 | 0.82 ± 0.06 | 0.37 ± 0.52/0.00 ± 0.00 | |||
F = female; M = male.
Figure 1.
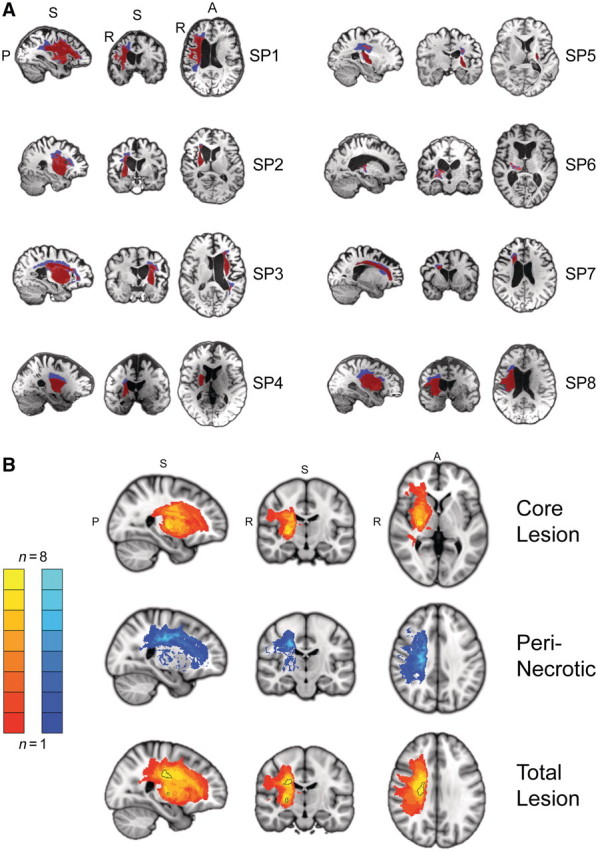
Brain lesions. (A) Sagittal, coronal and axial views of individual subject T1-weighted MRI scans with segmented brain lesions. A secondary segmentation of the total lesion was implemented to distinguish between core (red) and peri-necrotic (blue) regions based on differences in T1 signal intensity. Slices for each view are shown at the centre of gravity location for the core lesion. (B) Group core lesion (top; slices through MNI coordinate x = 26, y = −15, z = 2), peri-necrotic lesion (middle; 24, −18, 35) and total lesion (bottom; 25, −15, 29) probability maps displayed in MNI152 space. Left hemisphere lesions for Patients SP3 and SP5 have been flipped to the right-side. Two clusters (outlined in black) within the group lesion probability map show an overlap of at least seven of eight patients. The first cluster (517 mm3 volume; centre of gravity: 23.16, −14.57, 29.23) is located within the superior portion of the corona radiata, while a smaller more inferior cluster (60 mm3 volume; 25.38, −14.17, 2.87) is located in the external medullary lamina.
Experimental design
Brain–computer interface training sessions
Patients participated in an average of 15.4 ± 4.8 brain–computer interface training sessions (range 9–22) with an average frequency of 4.6 ± 0.8 sessions per week. Each training session lasted 1–2 h and was implemented on an outpatient basis.
Magnetoencephalography recordings
Neuromagnetic activity recorded from a 275-channel (seven patients) or 151-channel (one patient) magnetoencephalography array (CTF MEG™) was used to control a brain–computer interface as previously described at both the National Institutes of Health and the University of Tübingen. The magnetoencephalography apparatus was housed in a magnetically shielded room and used synthetic third gradient balancing to actively reduce interference from environmental noise. Recordings from all magnetoencephalography channels were anti-aliased with a 200-Hz cut-off, low-pass filter, and digitally sampled at 600 Hz. During recording, patients were seated alone in the shielded magnetoencephalography room with the lights slightly dimmed, and their head centrally positioned within the sensor array.
Sensorimotor rhythm-based brain–computer interface
Harmonic brain rhythms are believed to be an important mechanism underlying regional brain activity, as well as the long-range synchronization and dynamic recruitment of multiple distant brain regions into global functional networks. Regularly observable brain rhythms span several frequency bands and have been linked to important cognitive and sensorimotor functions (Palva and Palva, 2011). One of these, the sensorimotor or µ-rhythm, is believed to play an important functional role in transforming perceptual goals to motor actions (Pineda, 2005). The sensorimotor rhythm has a base µ band frequency range of 9–12 Hz, with a harmonic in the β band at 20–24 Hz, and can be recorded from scalp regions overlying the sensorimotor cortex. The terms event-related synchronization and desynchronization are commonly used to describe increases and decreases, respectively, in sensorimotor rhythm power relative to a baseline. Sensorimotor rhythm desynchronization has been repeatedly observed during the planning, execution, or even imagination of limb movements (Pfurtscheller, 1977; McFarland et al., 2000), a particularly pertinent feature for use in patients with chronic stroke with severe hand plegia. The BCI2000 software platform (www.bci2000.org) was used to estimate and classify sensorimotor rhythm state modulation, and drive the task-related visual feedback display in real-time during brain–computer interface training. Sensorimotor rhythm power estimates were derived from a cluster of 3–4 magnetoencephalography sensors selected from a subset of the array overlying the ipsilesional sensorimotor cortex, as training of this cortical region would actively engage motor networks affected by the stroke lesion. Surface EMG was recorded from extrinsic hand muscles during training sessions.
Real-time feedback and brain–computer interface training task
Patients performed up to 250 trials of a goal-oriented, one-dimensional visual feedback task per training session. The task was designed to help patients achieve volitional control of sensorimotor rhythm modulation overlying the ipsilesional sensorimotor cortex, and thus control of the orthosis (Fig. 2). As the task corresponded to the two possible orthosis states (opened or closed grasping posture of the affected hand), individual trials were initiated by the presentation of a visual target on either the upper or lower half of the right side of a monitor display. Each target was essentially a visual representation of the sensorimotor rhythm power range assigned to the corresponding orthosis action by an adaptive classifier. A square screen cursor would then begin moving at a fixed rate from left-to-right across the display with the cursor feedback updated every 200 ms. The vertical height of the cursor was a transformation of the difference between the current sensorimotor rhythm state estimate and an adaptive baseline set by the brain–computer interface classifier. The goal for the patient was to modulate sensorimotor rhythm power in the direction needed (above or below the baseline) to deflect the screen cursor towards the target, and ultimately contact the target when the cursor reached the right edge of the screen. The brain–computer interface software maintained a finite history of the mean sensorimotor rhythm power estimate from each trial and assigned this to a distribution representing observations for each target (or orthosis action) state. The baseline, defined as the midpoint between the means of these two distributions, was adaptive to account for changes in these sensorimotor rhythm power distributions over the course of training. At the conclusion of each successful trial (cursor contact with target), a simultaneous change in target colour (red to yellow) and orthosis action occurred, providing reinforcement. If the cursor failed to hit the target, no reinforcement (target colour change or orthosis action) was provided.
Figure 2.

Trial description for sensorimotor rhythm (SMR) modulation through grasping imagery training. Whole-head magnetoencephalography data were continuously recorded throughout each training block (48 trials). At the initiation of each trial, one of two targets (top-right or bottom-right edge of visual display) appeared on a projection screen positioned in front of the subject. A screen cursor appeared at the left edge of the screen 500 ms later, and began moving towards the right edge at a fixed rate. Sensorimotor rhythm power modulation was estimated from a preselected subset of the sensor array (three to four source sensors) at 150-ms intervals throughout the trial (4 s duration), and compared to an adaptive baseline that characterized the midpoint between the power distribution means for each task state (target/orthosis action conditions). The distance of the current power state from this baseline was transformed into an upwards (positive) or downwards (negative) deflection of the screen cursor's vertical position, with an update rate of 6.7 Hz. At the conclusion of the trial, if the subject successfully deflected the cursor to contact the target, two simultaneous reinforcement events occurred. The cursor and target on the display changed colours from red to yellow, and the orthosis manipulated the impaired hand's grasp posture to the alternative state (opening or closing of hand). If the cursor did not successfully contact the target, no orthosis action was initiated.
Hand orthosis
During all brain–computer interface training sessions, a mechanical orthosis was attached to the plegic hand. Fingers 2–5 (index, middle, ring and little fingers) were individually inserted into ring-like fasteners that fixed each digit at the first phalanx. Each fastener was connected to a plastic Bowden cable. Computer-gated pneumatic valves extended or retracted the cables to manipulate hand grasping posture. The orthosis had two possible movement motions: synchronous flexion or extension of the fingers resulting in hand grasp closing or opening, respectively. The hand posture limits produced by these two orthosis states were customized to each patient, so that they manipulated the hand through a safe range-of-motion. On successful trials, orthosis action triggers were synchronized in time with target colour changes in the brain–computer interface training task through a custom control circuit.
Magnetic resonance imaging data acquisition
Whole brain, single-shot echo-planar (EPI) diffusion-weighted volumes (110 non-collinear directions; b = 100 smm−2 [10 directions], 300 mm−2 [10], 500 smm−2 [10], 800 smm−2 [30] or 1100 smm−2 [50]; 60 slices; voxel size 2.5 × 2.5 × 2.5 mm3; echo time/repetition time = 76.4 ms/18.28 s) plus 10 volumes without diffusion weighting (b = 0 smm−2) were acquired for seven of the eight subjects (excluding Patient SP6) following training on a 3.0 Tesla GE Excite scanner using an 8-channel coil (GE Medical Systems). In addition structural T1-weighted (magnetization-prepared rapid gradient-echo sequence; echo time/repetition time = 2.67 ms/6.26 s, flip angle = 12°; voxel size = 0.9375 × 0.9375 × 1 mm3) and T2-weighted (echo time/repetition time = 122.52 ms/8.35 s; voxel size = 0.4688 × 0.4688 × 1.5 × mm3) volumes were acquired for all subjects.
Data analysis
Sensorimotor rhythm modulation skill
The success rate, or the proportion of trials in which patients were successful at producing the required sensorimotor rhythm power modulation that resulted in screen cursor contact with the target, was computed for trial presentations during a single training session and used as a skill measure. As the task was one-dimensional and consisted of only two states, initial success rates of ∼0.5 indicate ‘chance’ levels of performance. A paired t-test was used to compare changes in group skill (mean of first three and final three sessions) following training. To assess if individual patients showed significant changes in skill during training, the change-point test was used (Siegel and Castellan, 1988). The change-point test assumes the null hypothesis that no time trend exists in the series of performance data. Based on this assumption, skill for each session should rank on average near the median, and the cumulative sum of ranks should increase approximately linearly with session number. The maximal deviation from this expected linear increase in rank is considered as a potential ‘change-point’ and is used to divide the time series into two components. These components are then compared using a Kolmogorov–Smirnov test to determine statistical significance at α = 0.5.
Magnetoencephalography data
Preprocessing and analysis of the data was performed using the Fieldtrip toolbox for EEG/magnetoencephalography analysis, developed at the Donders Institute for Brain, Cognition and Behavior (http://www.ru.nl/neuroimaging/fieldtrip). A Discrete Fourier Transform (DFT) filter was used to remove line noise from the raw data (60 Hz for the six NIH patients, and 50 Hz for the two patients from the University of Tübingen). The data was then band-pass filtered between 0.1–50 Hz, and finally down-sampled to 120 Hz to reduce offline processing loads.
Raw signals from CTF axial gradiometers have contributions from a wide spatial range of sources inside the brain, making it difficult to interpret signal topography in sensor space. Several common source regression modelling techniques, such as beamformers, have been developed to estimate signal source locations within the brain volume, but in doing so change the inherent covariance structure of the raw time-series data that is used to derive functional connectivity estimates. Thus, to retain the time-series correlation structure of the raw sensor space data, and make spatial features of the sensor space data easier to interpret, we performed a planar gradient transformation of that data at each sensor (Bastiaansen and Knösche, 2000). All further analyses were performed on planar gradient data.
The average functional connectivity between each sensor pair for each task state was estimated by computing the phase-locking value. If the time-series of each trial for a particular sensor and task state is denoted as xn(t) for n = 1 to N, where N is the number of trials for that particular task state, a complex time–frequency power spectral density representation Xn(f, t) for xn(t), can be calculated by implementing Welch's averaged modified periodogram method with a sliding Hamming window of 1 s duration and 50% overlap between adjacent windows. Similarly, the time–frequency representation, Yn(f, t), can be calculated for the time-series recorded at a second sensor in the array, yn(t), and the phase-locking value (PLV) between the two sensors for that task state can be defined as:
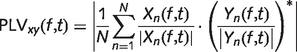 |
Phase-locking value quantifies the across-trial consistency of the phase relationship between two sensors as a function of frequency and time. Phase-locking values were calculated for all pair-wise sensor combinations for each of the two brain–computer interface task states during the feedback period (during which the patients were actively trying to deflect the screen cursor towards the target), and the mean phase-locking value was determined for the same frequency band from which sensorimotor rhythm state estimates were derived (12 Hz for six patients, 12.5 Hz for one patient, and 9 Hz for one patient). All magnetoencephalography measures were calculated for each session of training (either sensorimotor rhythm modulation or cost-efficiency). Since the number of sessions was slightly different between our patients, we then resampled each magnetoencephalography measure versus session curve to have 20 sessions. The final magnetoencephalography and behavioural measures included in the regression analysis were the average of the last three sessions taken from this resampled curve.
Functional network construction
Phase-locking value estimates for every sensor pair were used to construct a functional connectivity matrix, Wij, which represents the phase coupling between sensors i and j. The values of the main diagonal of the matrix are set to zero, Wii = 0, so that there are no self-connections. The connectivity matrix can then be thresholded and binarized to construct an undirected binary graph, G:
where T is a threshold that determines the sparseness of edges (or connections between sensor pairs) in the resulting graph.
Following the approach of Basset et al. (2009), we examined the relationship between functional network cost-efficiency observed for individual patients and their sensorimotor rhythm modulation skill (Bassett et al., 2009). For each threshold, T, applied to create the network graph, G, consisting of N nodes, the cost or connection density, C, is defined as:
The regional efficiency at each sensor, E(i), is defined as:
where Li,j is the minimum number of edges that connect sensor i to j, and N is again the total number of nodes in the network. Note that if no connection exists between i and j, then Li,j = ∞ and 1/Lij = 0. The global efficiency, E, is the mean of E(i) over all sensors. Thus, for each threshold, T, the cost-efficiency, CE, is defined as:
In general, for a given fixed number of connections (cost), a greater proportion of long-range connections results in higher global cost-efficiency as information can be shared between distant network nodes via shorter paths. One of the challenges faced when deriving a binary association matrix from a continuous connectivity measure, is determining how to select the binarization threshold in a non-arbitrary way. Furthermore, determining a single threshold that can be applied across a group of patients in an unbiased manner can also be difficult, as the connection density must be controlled to make meaningful comparisons between different network graphs. In this case, this was particularly important as the goal of the comparison was to assess how differences in the pattern of connections (as opposed to the number of connections) related to sensorimotor rhythm skill.
The major assumption of this method, that network architecture is organized in a manner that optimizes the relationship between global efficiency (a quality of how information is integrated across the brain) and cost (the number of connections maintained to share that information) has been recently supported by functional imaging studies (Achard and Bullmore, 2007; Fornito et al., 2011). To determine the optimal cost-efficient functional network architecture observed in each individual patient, we derived a series of binary, undirected networks that were defined over a range of fixed costs. For individual graphs possessing a specific cost, a threshold, T, was used that was determined by the phase-locking value distribution for the functional connectivity matrix calculated for each patient. The maximum cost-efficiency value was calculated for data acquired over the final three training sessions for each patient and then regressed against sensorimotor rhythm modulation skill from the same period, providing the most unbiased approach for assessing the relationship between these two variables. The relationship between this network measure and sensorimotor rhythm modulation skill was statistically assessed using iteratively re-weighted-least squares regression (Street et al., 1988).
This magnetoencephalography data analysis allows for the comprehensive exploration of global functional network organization after stroke, our focus of interest. On the other hand, while alternative methodologies involving source-based connectivity modelling of magnetoencephalography data (i.e. dynamic causal model) allow for more direct interpretations about specific regions involved, these are restricted to smaller or less-resolved networks (Kiebel et al., 2009). To gain insight into the local features of structural network architecture that support functional interactions related to this task, we utilized diffusion and T1-weighted MRI data to understand intersubject differences in structural connectivity.
Magnetic resonance imaging data
Preprocessing of the diffusion weighted images was performed with algorithms included in the TORTOISE software package (www.tortoisedti.org) (Pierpaoli et al., 2010). Diffusion weighted images were first corrected for motion and eddy current distortions according to Rohde et al. (2004) including proper reorientation of the b-matrix to account for the rotational component of the subject rigid body motion (Leemans and Jones, 2009). In addition, B0 susceptibility induced echo planar image distortions were corrected using an image registration based approach using B-splines (Wu et al., 2008). All corrections were performed in the native space of the diffusion weighted images. For consistency, all images were reoriented into a common space defined by the mid-sagittal plane, the anterior commissure and the posterior commissure (Bazin et al., 2007) also with appropriate rotations to the b-matrix. A non-linear diffusion tensor model was then fit to the corrected data. Tensors volumes for Patients SP3 and SP5, who had right-hemispheric lesions, were then right-left flipped, with appropriated reflections of the tensors applied as well.
Following tensor estimation, spatial normalization was performed using a non-parametric, diffeomorphic deformable image registration technique implemented in DTI-TK (www.nitrc.org/projects/dtitk/), which incrementally estimates its displacement field using a tensor-based registration formulation (Zhang et al., 2006). It is designed to take advantage of similarity measures comparing tensors as a whole via explicit optimization of tensor reorientation and includes appropriate reorientation of the tensors following deformation.
Lesion segmentation
Lesions in each patient were segmented using an iterative, partially unsupervised method. First, T2-weighted volumes were rigid-body aligned with T1-weighted volumes. These two aligned volumes were then used as multi-channel inputs to the FMRIB Automated Segmentation Tool (FAST), a part of the FMRIB Software Library (http://www.fmrib.ox.ac.uk/fsl/). FAST was used to derive partial volume estimates at each voxel for grey matter, white matter and CSF tissue classes. These partial volume estimates were then non-linearly transformed into MNI152 space using FMRIB's Non-linear Image Registration Tool, and compared to a standard map of partial volume estimates derived from the same scans (identical acquisition sequences) acquired in 120 healthy volunteers on the same scanner through the computation of a distance map (measured as the Euclidean distance between patients with stroke and healthy volunteer template grey matter, white matter, and CSF partial volume estimate vectors at each voxel location). The resulting distance map was thresholded at 0.95, and binarized to create a lesion mask in MNI space. An MNI-space ventricular mask was then used to remove any part of the lesion mask that included portions of the ventricles. The resulting lesion mask was then eroded, dilated and smoothed with a 1-mm radius spherical kernel, and transformed back into the original subject space using the inverse non-linear warp field. The mask was then used as an input mask for subsequent non-linear registration iterations. For each iteration, the inclusion of the previous lesion mask resulted in a subsequent change in the non-linear registration to the MNI template. A total of 10 iterations were performed in this manner. The final lesion masks were then visually inspected, and any artefacts present were manually corrected. A secondary segmentation of the total lesion was implemented to distinguish between core and peri-necrotic regions based on differences in T1 signal intensity.
Structural network construction
We used the Johns Hopkins University Probabilistic Fibre Atlas (http://cmrm.med.jhmi.edu) (Zhang et al., 2010) in conjunction with the segmented individual patient lesions to derive a structural connectivity matrix, and construct a weighted, undirected structural network graph. Regions of interest used as seeds and targets in the construction of the atlas, were employed as nodes in the anatomical network. Probabilistic atlas tracts were non-linearly transformed to MNI152 standard space with FMRIB's Non-linear Image Registration Tool, and used to define connections between each node based on the tractography-based connectivity matrix published by Zhang et al. (2010). For each patient, lesion segmentation masks were also non-linearly transformed into MNI152 standard space, with all tract values for voxels overlapping with the lesion mask in a particular subject set to zero. As the probability value for each tract falls off at voxels distant from its centre, this meant that lesion overlap with central regions of each tract were weighted more heavily in terms of the impact on structural connectivity. The weight for a given network connection was defined as the ratio of the spared fibre tract probability sum to the total original tract probability sum.
The resulting connectivity matrix was then subjected to one additional correction procedure. Since it is probable that the net effect of a core lesion that transects a fibre tract is greater than an effect caused by a reduction in tract volume, a custom cluster search algorithm was used to identify non-contiguous components of the tract indicative of transections following removal of tract voxels overlapping with the core lesion segmentation. If multiple components were present, with at least two of them possessing a volume ≥20% of the total tract volume, the transection was considered to be significant, and the connectivity value was set to zero. This threshold was used to eliminate erroneous or relatively minor transections that occurred along the edge of the tracts where measurement noise and normal population variance make the identification of transections less reliable. The specific use of 20% was empirically determined, as it provided the best correspondence with tract transections visually identified in one of the patient data sets. Based on these criteria, a total of 13 tract transections were identified in our patient group, with at least one significant transection defined in five of eight patients.
We decided against using a tractography-based approach to define our structural network as peri-infarct regions usually contain high amounts of glial cell aggregation that significantly affect water diffusion anisotropy in a complex manner (Budde and Frank, 2010). Under these circumstances, the relative contribution of white matter microstructure properties and gliosis to between-subject differences in measured anisotropy cannot be fully dissociated with standard diffusion MRI techniques (Newton et al., 2006; Kunimatsu et al., 2007). To avoid this confound, we implemented lesion segmentation overlaps with a probabilistic atlas of major white matter fibre bundles derived from data acquired in healthy volunteers and gain insight into the disruption of structural connectivity within the ipsilesional hemisphere (Riley et al., 2011).
Measures of nodal and edge betweenness centrality, which describe the degree to which individual brain regions and white matter fibres respectively contribute to the shortest pathway connecting other brain regions, were calculated for each patient's weighted structural connectivity matrix. The nodal betweenness centrality of a given node n is defined as:
where σij is the total number of shortest paths from node i to node j and σij(n) is the number of those shortest paths that pass through node n. The edge betweenness centrality of a given node e is defined as:
where σij is the total number of shortest paths from node i to node j and σij(n) is the number of those shortest paths that contain edge e.
Tract-based spatial statistics analysis of extralesional fractional anisotropy
To explore structural network characteristics in the contralesional hemisphere, we used a complimentary tract-based spatial statistics analysis approach that characterizes white matter microstructure relationships associated with sensorimotor rhythm modulation skill in voxels not contributing to the lesion segmentation in any patient. Fractional anisotropy maps for each patient were created from the spatially normalized tensor outputs from DTI-TK. A mean fractional anisotropy image was created and then skeletonized using a fractional anisotropy threshold of 0.2. Each subject's aligned fractional anisotropy image was then projected onto this mean skeleton by searching perpendicular from the skeleton for maximum fractional anisotropy values. This step allows for the statistical comparison of fractional anisotropy values from homologous regions of the fractional anisotropy map. An extralesional group mask was constructed by summing individual patient lesion masks transformed into the common group tensor space, binarizing, and then inverting. Thus, only voxels falling outside the lesioned mask boundaries in all patients were included in subsequent analyses. Between-subject variance in fractional anisotropy from homologous regions was then related to voluntary modulation of sensorimotor rhythm, with the acquired skill serving as a general linear model regressor (Buch et al., 2010). The threshold free cluster enhancement option, a novel method for enhancing cluster-like structures in statistical images, was used for subsequent statistical tests. Resulting corrected P-value maps were thresholded at P ≤ 0.05. Average fractional anisotropy values within clusters were then correlated with the sensorimotor rhythm modulation skill to determine the correlation coefficient for the cluster.
Voxel-based morphometry region of interest analysis of extralesional grey matter volume
We extended our analysis to grey matter regions adjacent to the white matter voxels where fractional anisotropy correlated with sensorimotor rhythm modulation skill. A voxel-based morphometry region of interest analysis was performed using the standard FMRIB Software Library pipeline. First, structural images were brain-extracted using BET. Next, tissue-type segmentation was carried out using FAST. The resulting grey matter partial volume estimates were then aligned to MNI152 standard space with FMRIB's Non-linear Image Registration Tool. The resulting images were averaged to create a study-specific template, to which the native grey matter images were then non-linearly re-registered. The registered partial volume images were then corrected for local expansion or contraction by dividing by the Jacobian of the warp field. The corrected segmented images were then smoothed with an isotropic Gaussian kernel with a sigma of 4 mm. Two separate spherical region of interest masks with a radius of 25 mm were centred on the MNI-space location of the maximum t-statistics for the two clusters identified in the tract-based spatial statistics analysis relating white matter fractional anisotropy with skill (x, y, z = −29, −56, 35 and −38, −21, 32). All voxels of both masks fell within extralesional space. Finally, a voxel-wise general linear model was applied using permutation-based non-parametric testing. Resulting corrected P-value maps were thresholded at P ≤ 0.05. Average grey matter volume values within clusters were then correlated with the sensorimotor rhythm modulation skill to determine the correlation coefficient for the cluster.
This study utilized the high-performance computational capabilities of the Biowulf Linux cluster at the National Institutes of Health, Bethesda (http://biowulf.nih.gov). Metrics for both functional and structural network graphs were computed using the Brain Connectivity Toolbox (Rubinov and Sporns, 2010).
Results
Patient lesion characteristics
All patients displayed single unilateral lesions that differed in volume and location (Fig. 1A). There were some shared features however, including a disproportionate disruption of white matter (74–95% of lesion volume; Table 1) predominantly occurring in the superior portion of the corona radiata and the external medullary lamina (Fig. 1B). In terms of specific white matter fibre tracts, the infarcted brain tissue overlapped with the corticospinal tract and thalamic radiations, consistent with previous reports that lesions of these tracts result in severe hand motor deficits (Newton et al., 2006; Ward et al., 2006).
Volitional control of sensorimotor rhythm skill
Despite an overall group improvement in skill [t(7) = 3.77; P < 0.01], there was substantial variability in the ability of different patients to improve their success rate in volitional control of sensorimotor rhythm and consequently brain–computer interface induced hand grasping function (Fig. 3A). Seven of eight patients showed a significant increase in skill (detection of significant change-point for α = 0.05), with a majority of patients showing exponential performance increases during training with variable growth rates and delays of onset. Patient SP01 was the single patient who did not show a significant increase in skill with training.
Figure 3.

Skill, task-related sensorimotor rhythm power contrast, and global functional network cost-efficiency. (A) Sensorimotor rhythm (SMR) modulation skill. Skill was defined as the proportion of correct trials for each training session, and showed a significant increase for the group [t(7) = 3.77; P < 0.01]. Group mean (thick black line) is shown with the 95% confidence intervals (shaded grey area). Individual subject curves (thin black lines) are overlaid to illustrate the variability across the group. (B) Task-related sensorimotor rhythm power contrast between target conditions showed a significant positive relationship with final success rate [β = 1.07, t(7) = 2.91, P < 0.05]. (C) Global cost-efficiency across the entire magnetoencephalography array shows a significant positive relationship with acquired sensorimotor rhythm modulation skill [β = 6.54, t(7) = 3.08, P < 0.05].
Functional network: global cost efficiency
Global functional network cost efficiency, which quantifies the overall network capacity to integrate information relative to the number of significant functional interactions between nodes, showed a significant positive relationship with acquired sensorimotor rhythm modulation skill [β = 6.54, t(7) = 3.08, P < 0.05; Fig. 3C].
Average task-related sensorimotor rhythm power modulation after training also showed a significant positive relationship with final success rate [β = 1.07, t(7) = 2.91, P < 0.05; Fig. 3B]. This was expected as performance was directly related to a transformation of the sensorimotor rhythm modulation state. Thus, patients who were able to produce more separable sensorimotor rhythm power states, through greater event-related synchronization or desynchronization generated by grasping imagery, acquired greater sensorimotor rhythm modulation skill.
Ipsilesional structural network: nodal and edge betweenness centrality
Figure 4 displays the average lesion damage to the tracts comprising the structural network. As would be expected for the severe hand motor deficits observed in this patient group, overlap of segmented patient lesions with partial volume estimates of grey and white matter determined from a large cohort of healthy volunteers showed on average the most significant damage was to the ipsilesional corticospinal tract. There was also significant damage to the thalamocortical radiations, particularly those connecting thalamic nuclei with the ipsilesional pre- and post-central gyrus, and the ipsilesional superior and middle frontal gyrus. Importantly, the data identified interindividual differences in damage to short and long association fibre pathways connecting premotor, primary sensorimotor and posterior parietal regions of the network.
Figure 4.
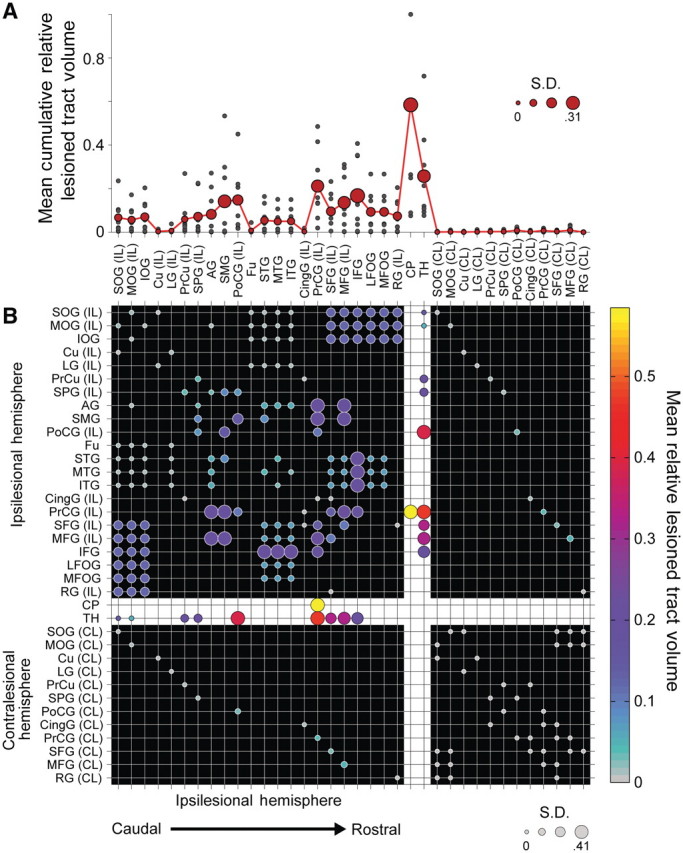
Mean impact of lesions on structural connectivity patterns. Fifty corticospinal, thalamocortical, short and long association fibre, and transcallosal tracts and their 36 related seed and target regions of interest from the JHU Probabilistic Fibre Atlas (Zhang et al., 2010), were used to construct weighted, undirected structural network connectivity matrices for the ipsilesional hemisphere in each patient. (A) Cumulative mean fibre damage for all tracts connected to a network node (red filled circles). Individual patient values are also displayed (small grey filled circles). Diameter of the red-filled circles is proportional to the group SD for each node, relevant to the evaluation of interindividual differences in skill. (B) Group mean symmetric network matrix showing the mean fibre tract damage for each edge (1—connectivity value). Filled circles located at grid-line intersections represent existing edges (connections) in the network. Rows and columns with the white background (dividing the rest of the matrix into quadrants) contain edges representing corticospinal and thalamocortical fibre pathways. Edges representing ipsilesional hemisphere short and long association fibres are located in the top-left quadrant (with the black background). Transcallosal fibre pathway edges are located in lower-left and upper-right quadrants. Contralesional hemisphere short and long association fibre edges between contralesional nodes directly connected to ipsilesional nodes through transcallosal pathways are located in the lower-right quadrant. Circle diameter is proportional to the SD of lesion damage to a particular tract across patients. Large diameter circles highlight edges with relatively high damage variability across the group. Circle colours reflect the group mean fibre tract damage. Grey coloured circles represent edges that are undamaged in all patients (see colour bar scale). Note the most severe damage occurs in the corticospinal tract as indicated by bright yellow circles. Additionally, there is moderate damage to ipsilesional short and long association fibre tracts connecting premotor, sensorimotor and posterior parietal regions as shown in large magenta circles. AG = angular gyrus; CingG = cingulate gyrus; CL = contralateral; CP = cerebral peduncle; Cu = cuneus; Fu = fusiform gyrus; IFG = inferior frontal gyrus; IL = ipsilateral; IOG = inferior occipital gyrus; LFOG = lateral fronto-orbital gyrus; LG = lingual gyrus; MFG = middle frontal gyrus; MFOG = middle fronto-orbital gyrus; MOG = middle occipital gyrus; MTG = middle temporal gyrus; PoCG = post-central gyrus; PrCG = precentral gyrus; PrCu = pre-cuneus; RG = rectus gyrus; SFG = superior frontal gyrus; SMG = supramarginal gyrus; SOG = superior occipital gyrus; SPG = superior parietal gyrus; STG = superior temporal gyrus; TH = thalamus.
Figure 5 shows the relationship between two measures of network integration, nodal and edge betweenness centrality, with skill. Network damage induced a complex pattern of changes in the relative influence of ipsilesional hemisphere nodes and ipsilesional association fibre and interhemispheric edges on global network integration. On the other hand, the influence of contralesional nodes and edges displayed a uniform relative increase, as damage in the opposite hemisphere enhanced their role in integrating information between frontal and parietal regions of the brain.
Figure 5.

Structural network nodal and edge betweenness centrality and skill. Nodal betweenness centrality characterizes the influence of a single node over the sharing of information between other nodes. (A) Grey bars show nodal betweenness centrality values for each node in an intact network prior to the inclusion of lesions (Zhang et al., 2010). Red circles show the group mean betweenness centrality for each network node following lesion inclusion. Circle diameter is proportional to the SD of nodal betweenness centrality across patients. Small grey filled circles show individual patient values. (B) Lesion-induced changes in precentral gyrus nodal betweenness centrality correlates with both skill [β = 0.003, t(7) = 3.42, P < 0.05], and task-related sensorimotor rhythm power contrast between target conditions [β = 0.002, t(7) = 4.11, P < 0.01]. (C) Group mean symmetric network matrix showing the mean lesion-induced change in betweenness centrality for each edge following application of lesion damage to the network. As in Fig. 4, filled circles located at grid-line intersections represent existing edges (connections) in the network. Rows and columns with the white background (dividing the rest of the matrix into quadrants) contain edges representing corticospinal and thalamocortical fibre pathways. Edges representing ipsilesional hemisphere short and long association fibres are located in the top-left quadrant (with the black background). Transcallosal fibre pathway edges are located in lower-left and upper-right quadrants. Contralesional hemisphere short and long association fibre edges between contralesional nodes directly connected to ipsilesional nodes through transcallosal pathways are located in the lower-right quadrant. Circle diameter is proportional to the SD in edge betweenness centrality difference across patients. Large diameter circles highlight edges with relatively high betweenness centrality variability across the group. Circle colours reflect the group mean edge betweenness centrality difference. Grey coloured circles indicate edges where betweenness centrality did not change (see colour bar scale). (D) Change in edge betweenness centrality measured for the connection between the ipsilesional angular gyrus and middle frontal gyrus shows a significant positive relationship with skill [β = 0.041, t(7) = 5.29, P < 0.005]. It should be noted that damage caused by lesions (Fig. 4) induces a complex pattern of changes in the relative influence of ipsilesional hemisphere nodes and ipsilesional association fibre and interhemispheric edges on global network integration. However, the influence of contralesional nodes and edges displays a uniform relative increase, as damage in the opposite hemisphere enhances their role in integrating information between frontal and parietal regions of the brain. AG = angular gyrus; CingG = cingulate gyrus; CL = contralateral; CP = cerebral peduncle; Cu = cuneus; Fu = fusiform gyrus; IFG = inferior frontal gyrus; IL = ipsilateral; IOG = inferior occipital gyrus; LFOG = lateral fronto-orbital gyrus; LG = lingual gyrus; MFG = middle frontal gyrus; MFOG = medial fronto-orbital gyrus; MOG = middle occipital gyrus; MTG = middle temporal gyrus; PoCG = post-central gyrus; PrCG = precentral gyrus; PrCu = pre-cuneus; RG = rectus gyrus; SFG = superior frontal gyrus; SMG = supramarginal gyrus; SMR = sensorimotor rhythm; SOG = superior occipital gyrus; SPG = superior parietal gyrus; STG = superior temporal gyrus; TH = thalamus.
Only two significant relationships were observed between local structural network properties and sensorimotor rhythm modulation skill. First, nodal betweenness centrality measured at the ipsilesional precentral gyrus was significantly related to both sensorimotor rhythm modulation skill [β = 0.003, t(7) = 3.42, P < 0.05; Fig. 5B], and task-related sensorimotor rhythm modulation range [β = 0.002, t(7) = 4.11, P < 0.01; Fig. 5B]. Furthermore, edge betweenness measured for the pathway connecting the ipsilesional angular gyrus and middle frontal gyrus, a component of the frontoparietal portion of the superior longitudinal fascicle, also showed a significant positive relationship with acquired sensorimotor rhythm modulation skill [β = 0.041, t(7) = 5.29, P < 0.005; Fig. 5D].
Extralesional structural network: white-matter microstructure integrity and grey matter volume
Again, we took the conservative approach of completely excluding voxels contributing to the lesion mask in any patient from our analyses exploring the voxel-wise relationships between white matter anisotropy or grey matter density and sensorimotor rhythm modulation skill. Lesion pathology may violate some assumptions relating these measures to anatomical microstructure in the brain, leading to findings that are difficult to interpret. The results of the tract-based spatial statistics analysis relating extralesional fractional anisotropy to sensorimotor rhythm modulation skill revealed two significantly correlated clusters in the contralesional superior longitudinal fascicle. The first cluster encompassed a caudal region of the contralesional superior longitudinal fascicle adjacent to the anterior intraparietal sulcus (cluster size = 105; max t-stat = 7.94; MNI location = −29, −56, 35; Fig. 6A and B). The second cluster was located in a central region of the contralesional superior longitudinal fascicle, underlying the contralesional sensorimotor cortex (cluster size = 96; max t-stat = 12.37; MNI location = −38, −21, 32; Fig. 6C and D).
Figure 6.

Extralesional white matter fractional anisotropy (FA) related to skill. Two white matter clusters in the contralesional hemisphere were the only locations where there was a significant positive relationship between extralesional fractional anisotropy and acquired sensorimotor rhythm modulation skill across the stroke patient group. (A and B) A caudal region of the contralesional superior longitudinal fascicle adjacent to the anterior intra-parietal sulcus (cluster size = 105; max t-stat = 7.94; MNI location = −29, −56, 35). (C and D) A central region of the contralesional superior longitudinal fascicle underlying sensorimotor cortex (cluster size = 96; max t-stat = 12.37; MNI location = −38, −21, 32). Both clusters are significant at the level of P < 0.05 (corrected). Note that all lesioned areas were excluded from this analysis.
A voxel-based morphometry–region of interest analysis revealed two clusters of grey matter, co-localized to the white matter regions identified with the tract-based spatial statistics analysis, which showed a significant correlation between volume and sensorimotor rhythm modulation skill. The more caudal cluster was located within the contralesional intraparietal sulcus (cluster volume = 440 mm3; max t-stat = 4.20; MNI location = −28, −60, 50; Fig. 7A and B). The second cluster was located along the grey–white matter border of the rostral precentral gyrus near the junction of rostral M1, ventral premotor cortex and the dorsal premotor cortex (cluster volume = 248 mm3; max t-stat = 3.87; MNI location = −42, −10, 46; Fig. 7C and D) (Tomassini et al., 2007).
Figure 7.

Extralesional grey matter (GM) volume related to skill. A region of interest-based voxel-based morphometry analysis of grey matter regions co-localized to regions of fractional anisotropy that correlated with sensorimotor rhythm modulation skill revealed two complimentary clusters showing a positive correlation between grey matter volume and sensorimotor rhythm modulation skill. (A and B) A caudal cluster is located within the contralesional intraparietal sulcus (cluster volume = 440 mm3; max t-stat = 4.20; MNI location = −28, −60, 50). (C and D) A second cluster is located along the grey–white matter border of the rostral precentral gyrus and near the junction of rostral M1, ventral premotor cortex and the dorsal premotor cortex (cluster volume = 248 mm3; max t-stat = 3.87; MNI location = −42, −10, 46). Both clusters are significant at the level of P < 0.05 (corrected).
Discussion
The purpose of this study was to gain insight into the mechanisms related to volitional control of neural activity through operant conditioning in patients with chronic stroke. This skill is important for acquiring control of computer-based applications or mechanical devices that can replace or facilitate extinguished behaviours, as in the case of brain–machine interfaces (Birbaumer and Cohen, 2007; Wolpaw, 2007). Additionally, voluntary control of brain rhythms could promote functional plasticity following stroke and traumatic brain injury that impact recovery of motor skills (Ang et al., 2010; Wang et al., 2010b; Grosse-Wentrup et al., 2011a). To address this question, we longitudinally trained a group of patients with chronic stroke with severe paralysis of the affected hand to volitionally modulate neural activity recorded from sensorimotor regions of the lesioned hemisphere, and used a comprehensive analysis of structural and functional network characteristics to evaluate possible substrates of this skill. Our results demonstrate that patients with more cost efficient global functional network activity and greater bi-hemispheric indices of structural connectivity between frontal and parietal regions exerted better sensorimotor rhythm modulation skill after longitudinal training associated with grasping imagery.
We purposefully chose a group of patients with chronic stroke with comparably severe hand motor deficits, who were unable to elicit extrinsic hand muscle EMG activity. Due to the severity of the motor deficits, this is a population of patients who are typically excluded from most experimental studies (Page et al., 2007) and stand to benefit from training strategies that involve motor imagery (Sharma et al., 2006; Page et al., 2009) and neurofeedback (Birbaumer and Cohen, 2007; Fetz, 2007; Wolpaw, 2007; Donoghue, 2008; Birbaumer et al., 2009). A further rationale for studying this patient group is that they present an ideal opportunity to study volitional control of neural activity in the lesioned brain without the confound of uncontrolled voluntary paretic hand muscle contraction. These patients were uniformly required to engage motor networks in an experiential and functionally relevant manner through grasping imagery of the affected hand, resulting in corresponding actions of a hand orthosis in which the hand was embedded. Additionally, we were interested in including patients whose comparable clinical outcome in the chronic stage resulted from heterogeneous lesion pathology, thus allowing us to explore the relationship between inter-individual variability in indices of structural connectivity and sensorimotor rhythm modulation skill.
Global functional network cost-efficiency
We found that voluntary control of neural activity in the form of sensorimotor rhythm modulation skill following longitudinal training correlated with global but not local cost-efficiency, suggesting a link between skill and distributed functional network architecture. Global functional network cost-efficiency appears to play an important role in other settings as well. For example, functional network cost-efficiency appears to predict working memory capacity (Bassett et al., 2009). Furthermore, longitudinal resting-state functional connectivity MRI data acquired throughout the acute-to-chronic stages of stroke suggest that changes in connectivity resulting in increased network efficiency is indicative of adaptive reorganization that results in improved recovery of motor function (Wang et al., 2010a; Grefkes and Fink, 2011; Rehme et al., 2011b). Our results are consistent with these previous reports and suggest that global functional network cost-efficiency may represent a more powerful predictor of acquired skill than spatially-dependent (i.e. voxel-based) measures, as lesion heterogeneity is highly prevalent after chronic stroke (Crofts et al., 2011). Changes in connectivity measurements between early and late training did not predict sensorimotor rhythm modulation skill, probably due to the high inter and intrasubject variability in the initial sessions.
Our primary interest was in utilizing sensorimotor rhythm modulation that occurs during normal motor imagery to drive the hand orthosis in our patients with chronic stroke. Each patient had an initial session during which they performed alternate blocks of rest and motor imagery of the affected hand to characterize individual spatial and frequency profiles of sensorimotor rhythm modulation. We found that the frequency band range producing most robust modulation across our patient group, in terms of both amplitude and topographic characteristics, was 9–12 Hz of the alpha band. This was consistent with a previous study performed in healthy volunteers that also used a magnetoencephalography-based brain–computer interface with the same type of classifier (Mellinger et al., 2007), as well as in a stroke patient study using an EEG-based brain–computer interface (Prasad et al., 2010). Our interest in looking at functional connectivity across the magnetoencephalography array was to assess whether global patterns of synchronization between regions were related in some way to regional sensorimotor rhythm modulation skill. Several studies looking at the role of synchronous oscillatory activity suggest that alpha band rhythms play an important role in the coupling of distant brain regions allowing for global integration of network information (Palva and Palva, 2011). The measure of network organization we employed here, cost-efficiency, was used to assess this role of long-range alpha band synchronization, as it estimates the capacity of the functional network configuration to integrate global information.
Voluntary control of neural activity relates to indices of parietofrontal structural connectivity
We then evaluated the relationship between skill and interpatient differences in network architecture caused by lesion-related decrements of structural connectivity. First, we found that volitional control of neural activity at the end of training correlated with nodal betweenness centrality of the ipsilesional precentral gyrus. In isolation, the relationship between skill and this property of ipsilesional structural connectivity is consistent with damage to descending corticospinal or corticothalamic pathways typically observed in patients with severe motor deficits (Newton et al., 2006; Ward et al., 2006). However, as the precentral gyrus is directly connected to premotor (superior and middle frontal gyri) and posterior parietal (angular and supramarginal gyri) regions in the network that serve as important hubs for occipitoparietal and prefrontal regions, damage to these pathways will also reduce betweenness centrality of the precentral gyrus. This is consistent with functional connectivity MRI findings reported by Wang et al. (2010a, 2011), showing that a reduction in functional connectivity between M1 and premotor regions resulted in a decrease in nodal betweenness centrality.
Additionally, skill correlated with edge betweenness centrality of the frontoparietal portion of the superior longitudinal fascicle. In the structural network model, ipsilesional precentral gyrus and frontoparietal portion of the superior longitudinal fascicle are the primary means through which information is shared between visuomotor regions located in posterior parietal and frontal cortices (Makris et al., 2005; Schmahmann et al., 2007). The frontoparietal portion of the superior longitudinal fascicle is a long association fibre pathway that directly connects the precentral gyrus and middle frontal gyrus with the angular gyrus and supramarginal gyrus. The connectivity of the frontoparietal portion of the superior longitudinal fascicle appears consistent with two subcomponents of the superior longitudinal fascicle, superior longitudinal fascicle II and III, which have been previously defined in both humans and monkeys (Makris et al., 2005; Schmahmann et al., 2007). The ipsilesional precentral gyrus is also directly connected to the inferior and superior frontal gyri and the post-central gyrus in the ipsilesional hemisphere through short association fibre pathways. This is consistent with the known anatomical connectivity of distal forelimb representations located within the primary motor, somatosensory, and premotor regions in the monkey (Dum and Strick, 2005). It also connects to the contralesional precentral gyrus through transcallosal fibres and is the only cortical region in the model that contributes to the corticospinal tract.
The results of the tract-based spatial statistics and region of interest-based voxel-based morphometry analyses, which did exclude peri-infarct areas and thus a large portion of the ipsilesional hemisphere, revealed consistent homologous structures in the contralesional hemisphere where differences in microstructure correlated with skill. These observations suggest that grey matter volume in the intraparietal sulcus and a region near the transition between rostral primary motor and caudodorsal ventral premotor, as well as microstructural integrity of the superior longitudinal fascicle, a fibre bundle connecting these two regions, are directly related to skill. Thus, white and grey matter architectural features may provide support to the increased global integration of information by contralesional white matter association fibres linking frontal and parietal regions of the cortex. It is well known that the contralesional hemisphere contributes to functional recovery after brain lesions that result in more substantive motor deficits (Johansen-Berg et al., 2002; Harris-Love et al., 2005, 2011; Rehme et al., 2011a). It is conceivable that testing of patients with lesser motor deficits, known to benefit from ipsilesional activity, could unveil a stronger ipsilesional contribution as proposed before (Ward et al., 2003; Fridman et al., 2004). Additionally, it remains to be determined if differences in network architecture identified in this study reflect pre-morbid state or compensatory changes. Direct comparison between the neural substrates underlying performance of this task in patients and healthy subjects, which could contribute to address this issue, is problematic because the rate of skill acquisition in patients is very slow (weeks) while in healthy volunteers is very fast (often within a single session) (Mellinger et al., 2007).
The superior longitudinal fascicles II and III identified in our study are the primary white matter fibre pathways that directly connect parietofrontal regions that are functionally related to the planning, selection and execution of reaching and grasping movements in both monkeys and humans (Desmurget et al., 1999; Shimazu et al., 2004; Cattaneo et al., 2005; Tunik et al., 2005, 2008; Grol et al., 2007; Olivier et al., 2007; Umilta et al., 2007; Davare et al., 2010), with a majority of the interactions within this reaching and grasping network showing similar modulation with related imagery as well (Gao et al., 2010). Our data provide insight into how these intact networks reorganize to acquire skill after human brain lesions. In our patients, skill also correlated with fractional anisotropy in the contralesional superior longitudinal fascicle and with grey matter volume in the adjacent intraparietal sulcus and rostral precentral gyrus. This implies that a patient's ability to volitionally modulate neural activity within the ipsilesional sensorimotor cortex after longitudinal training may be related to the recruitment of a more integrated bilateral parietofrontal functional network than those described in healthy human and non-human primates in the literature. Reaching and grasping behaviour, as that asked of our patients to imagine, is the primary means through which humans and other primates perform goal-directed actions. Several computational and theoretical models have been proposed that attempt to account for the contributions of specific frontal and parietal cortical regions to these behaviours (Wolpert, 1997; Wolpert and Ghahramani, 2000; Shadmehr and Wise, 2005; Frey et al., 2011). While dorsolateral and orbital prefrontal regions, which integrate information related to attention and motivation, help identify goals (Price et al., 1996), interactions between granular prefrontal regions with dorsal and ventral premotor areas lead to the selection of appropriate actions for achieving these desired goals (O'Shea et al., 2007; Tunik et al., 2008; Buch et al., 2010). On the other hand, the superior and inferior posterior parietal cortex is responsible for integrating visual and proprioceptive information used to evaluate the current state of the grasping action relative to the goal while it is being executed (Glover et al., 2005; Tunik et al., 2005). This evaluation is continuously relayed to the premotor cortex, which uses the information to update action plans until the goal is achieved (Tunik et al., 2008; Davare et al., 2010).
Voluntary modulation of neural activity associated with grasping imagery training after stroke
Together, these structural and functional findings support a coherent argument for the superior longitudinal fascicle, the source of long-range corticocortical pathways connecting parietofrontal visuomotor areas, as a crucial anatomical substrate underlying the ability to volitionally modulate neural activity within ipsilesional sensorimotor areas following stroke. Over the past decade, it has been shown that it is possible to elicit voluntary modulation of sensorimotor rhythm through motor imagery (McFarland et al., 2000; Pfurtscheller, 2000). Studies in healthy volunteers and patients with stroke show that motor imagery results in similar parietofrontal functional network interactions to those observed for execution of hand motor tasks (Sharma et al., 2009a; Gao et al., 2010). Moreover, the ability of healthy volunteers to acquire volitional control of sensorimotor rhythm modulation appears to be related to the degree that the constituent regions of this network are recruited by the motor imagery strategy used (Halder et al., 2011). Thus, it would be reasonable to expect that volitional control of neural activity through operant conditioning using motor imagery would relate to architectural features of this network. Here, the present results suggest that the impact of individual brain lesions on both local and global properties of the intrinsic motor system can be characterized and give insight into the dynamic range of the network, even in a relatively small group of patients possessing lesion heterogeneity, but homogenously severe hand motor deficits.
It is possible that in the future, knowledge of individual patient's structural and functional network architecture may be used as a biomarker predictive of response to neurorehabilitative treatments (Cramer et al., 2007) or to optimize training duration (Page et al., 2009), intensity (Wolf et al., 2007) or practice schedule (Wolf et al., 2010). Clearly, more work will be required to reach this point. We hope that this knowledge could eventually be used in concert with non-invasive brain stimulation protocols (Hummel et al., 2005; Boggio et al., 2007; Nowak et al., 2008; Celnik et al., 2009; Edwards et al., 2009; Grefkes et al., 2010) or pharmacological interventions (Chollet et al., 2011; Wang et al., 2011) to sculpt plasticity in a manner that promotes the formation of adaptive network solutions allowing for better volitional control of sensorimotor or other brain rhythms, including beta (Bai et al., 2008), gamma (Grosse-Wentrup et al., 2011b) and slow cortical oscillations (Hinterberger et al., 2005), not studied in this investigation. Additionally, a larger population of patients with more heterogeneous lesions and deficits, as well as longitudinal imaging data helping to characterize changes in structural networks over time will be required before prognostic benchmarks can be identified. Indeed, the continued connectomics-based exploration of structural and functional brain networks at the systems level may provide greater insight into relationships between behaviour, plasticity and brain anatomy and physiology following stroke (Schmahmann and Pandya, 2008; Bullmore and Sporns, 2009; Rubinov and Sporns, 2010; Bullmore and Bassett, 2011).
Funding
Intramural Research Program National Institute of Neurological Disorders and Stroke Intramural Research Program.
References
- Achard S, Bullmore E. Efficiency and cost of economical brain functional networks. PLoS Comput Biol. 2007;3:e17. doi: 10.1371/journal.pcbi.0030017. [DOI] [PMC free article] [PubMed] [Google Scholar]
- Alstott J, Breakspear M, Hagmann P, Cammoun L, Sporns O. Modeling the impact of lesions in the human brain. PLoS Comput Biol. 2009;5:e1000408. doi: 10.1371/journal.pcbi.1000408. [DOI] [PMC free article] [PubMed] [Google Scholar]
- Ang KK, Guan C, Chua KS, Ang BT, Kuah C, Wang C, et al. Clinical study of neurorehabilitation in stroke using EEG-based motor imagery brain-computer interface with robotic feedback. Conf Proc IEEE Eng Med Biol Soc. 2010;2010:5549–52. doi: 10.1109/IEMBS.2010.5626782. [DOI] [PubMed] [Google Scholar]
- Bai O, Lin P, Vorbach S, Floeter MK, Hattori N, Hallett M. A high performance sensorimotor beta rhythm-based brain-computer interface associated with human natural motor behavior. J Neural Eng. 2008;5:24–35. doi: 10.1088/1741-2560/5/1/003. [DOI] [PubMed] [Google Scholar]
- Bassett DS, Bullmore ET, Meyer-Lindenberg A, Apud JA, Weinberger DR, Coppola R. Cognitive fitness of cost-efficient brain functional networks. Proc Natl Acad Sci USA. 2009;106:11747–52. doi: 10.1073/pnas.0903641106. [DOI] [PMC free article] [PubMed] [Google Scholar]
- Bastiaansen MC, Knösche TR. Tangential derivative mapping of axial MEG applied to event-related desynchronization research. Clin Neurophysiol. 2000;111:1300–5. doi: 10.1016/s1388-2457(00)00272-8. [DOI] [PubMed] [Google Scholar]
- Bazin PL, Ellingsen LM, Pham DL. Digital homeomorphisms in deformable registration. Inf Process Med Imaging. 2007;20:211–22. doi: 10.1007/978-3-540-73273-0_18. [DOI] [PubMed] [Google Scholar]
- Birbaumer N, Cohen LG. Brain-computer interfaces: communication and restoration of movement in paralysis. J Physiol. 2007;579:621–36. doi: 10.1113/jphysiol.2006.125633. [DOI] [PMC free article] [PubMed] [Google Scholar]
- Birbaumer N, Ramos Murguialday A, Weber C, Montoya P. Neurofeedback and brain-computer interface clinical applications. Int Rev Neurobiol. 2009;86:107–17. doi: 10.1016/S0074-7742(09)86008-X. [DOI] [PubMed] [Google Scholar]
- Boggio PS, Nunes A, Rigonatti SP, Nitsche MA, Pascual-Leone A, Fregni F. Repeated sessions of noninvasive brain DC stimulation is associated with motor function improvement in stroke patients. Restor Neurol Neurosci. 2007;25:123–9. [PubMed] [Google Scholar]
- Brown CE, Li P, Boyd JD, Delaney KR, Murphy TH. Extensive turnover of dendritic spines and vascular remodeling in cortical tissues recovering from stroke. J Neurosci. 2007;27:4101–9. doi: 10.1523/JNEUROSCI.4295-06.2007. [DOI] [PMC free article] [PubMed] [Google Scholar]
- Buch E, Weber C, Cohen LG, Braun C, Dimyan MA, Ard T, et al. Think to move: a neuromagnetic brain-computer interface (BCI) system for chronic stroke. Stroke. 2008;39:910–7. doi: 10.1161/STROKEAHA.107.505313. [DOI] [PMC free article] [PubMed] [Google Scholar]
- Buch ER, Mars RB, Boorman ED, Rushworth MF. A network centered on ventral premotor cortex exerts both facilitatory and inhibitory control over primary motor cortex during action reprogramming. J Neurosci. 2010;30:1395–401. doi: 10.1523/JNEUROSCI.4882-09.2010. [DOI] [PMC free article] [PubMed] [Google Scholar]
- Budde MD, Frank JA. Neurite beading is sufficient to decrease the apparent diffusion coefficient after ischemic stroke. Proc Natl Acad Sci USA. 2010;107:14472–7. doi: 10.1073/pnas.1004841107. [DOI] [PMC free article] [PubMed] [Google Scholar]
- Bullmore E, Sporns O. Complex brain networks: graph theoretical analysis of structural and functional systems. Nat Rev Neurosci. 2009;10:186–98. doi: 10.1038/nrn2575. [DOI] [PubMed] [Google Scholar]
- Bullmore ET, Bassett DS. Brain graphs: graphical models of the human brain connectome. Annu Rev Clin Psychol. 2011;7:113–40. doi: 10.1146/annurev-clinpsy-040510-143934. [DOI] [PubMed] [Google Scholar]
- Buzsaki G, Geisler C, Henze DA, Wang XJ. Interneuron diversity series: circuit complexity and axon wiring economy of cortical interneurons. Trends Neurosci. 2004;27:186–93. doi: 10.1016/j.tins.2004.02.007. [DOI] [PubMed] [Google Scholar]
- Cattaneo L, Voss M, Brochier T, Prabhu G, Wolpert DM, Lemon RN. A cortico-cortical mechanism mediating object-driven grasp in humans. Proc Natl Acad Sci USA. 2005;102:898–903. doi: 10.1073/pnas.0409182102. [DOI] [PMC free article] [PubMed] [Google Scholar]
- Celnik P, Paik NJ, Vandermeeren Y, Dimyan M, Cohen LG. Effects of combined peripheral nerve stimulation and brain polarization on performance of a motor sequence task after chronic stroke. Stroke. 2009;40:1764–71. doi: 10.1161/STROKEAHA.108.540500. [DOI] [PMC free article] [PubMed] [Google Scholar]
- Chollet F, Tardy J, Albucher JF, Thalamas C, Berard E, Lamy C, et al. Fluoxetine for motor recovery after acute ischaemic stroke (FLAME): a randomised placebo-controlled trial. Lancet Neurol. 2011;10:123–30. doi: 10.1016/S1474-4422(10)70314-8. [DOI] [PubMed] [Google Scholar]
- Cramer SC, Parrish TB, Levy RM, Stebbins GT, Ruland SD, Lowry DW, et al. Predicting functional gains in a stroke trial. Stroke. 2007;38:2108–14. doi: 10.1161/STROKEAHA.107.485631. [DOI] [PubMed] [Google Scholar]
- Crofts JJ, Higham DJ, Bosnell R, Jbabdi S, Matthews PM, Behrens TE, et al. Network analysis detects changes in the contralesional hemisphere following stroke. Neuroimage. 2011;54:161–9. doi: 10.1016/j.neuroimage.2010.08.032. [DOI] [PMC free article] [PubMed] [Google Scholar]
- Daly JJ, Wolpaw JR. Brain-computer interfaces in neurological rehabilitation. Lancet Neurol. 2008;7:1032–43. doi: 10.1016/S1474-4422(08)70223-0. [DOI] [PubMed] [Google Scholar]
- Dancause N, Barbay S, Frost SB, Zoubina EV, Plautz EJ, Mahnken JD, et al. Effects of small ischemic lesions in the primary motor cortex on neurophysiological organization in ventral premotor cortex. J Neurophysiol. 2006;96:3506–11. doi: 10.1152/jn.00792.2006. [DOI] [PubMed] [Google Scholar]
- Davare M, Rothwell JC, Lemon RN. Causal Connectivity between the Human Anterior Intraparietal Area and Premotor Cortex during Grasp. Curr Biol. 2010;20:176–81. doi: 10.1016/j.cub.2009.11.063. [DOI] [PMC free article] [PubMed] [Google Scholar]
- Desmurget M, Epstein CM, Turner RS, Prablanc C, Alexander GE, Grafton ST. Role of the posterior parietal cortex in updating reaching movements to a visual target. Nat Neurosci. 1999;2:563–7. doi: 10.1038/9219. [DOI] [PubMed] [Google Scholar]
- Dimyan MA, Cohen LG. Neuroplasticity in the context of motor rehabilitation after stroke. Nat Rev Neurol. 2011;7:76–85. doi: 10.1038/nrneurol.2010.200. [DOI] [PMC free article] [PubMed] [Google Scholar]
- Donoghue JP. Bridging the brain to the world: a perspective on neural interface systems. Neuron. 2008;60:511–21. doi: 10.1016/j.neuron.2008.10.037. [DOI] [PubMed] [Google Scholar]
- Dum RP, Strick PL. Frontal lobe inputs to the digit representations of the motor areas on the lateral surface of the hemisphere. J Neurosci. 2005;25:1375–86. doi: 10.1523/JNEUROSCI.3902-04.2005. [DOI] [PMC free article] [PubMed] [Google Scholar]
- Edwards DJ, Krebs HI, Rykman A, Zipse J, Thickbroom GW, Mastaglia FL, et al. Raised corticomotor excitability of M1 forearm area following anodal tDCS is sustained during robotic wrist therapy in chronic stroke. Restor Neurol Neurosci. 2009;27:199–207. doi: 10.3233/RNN-2009-0470. [DOI] [PMC free article] [PubMed] [Google Scholar]
- Fasoli SE, Krebs HI, Stein J, Frontera WR, Hogan N. Effects of robotic therapy on motor impairment and recovery in chronic stroke. Arch Phys Med Rehabil. 2003;84:477–82. doi: 10.1053/apmr.2003.50110. [DOI] [PubMed] [Google Scholar]
- Fetz EE. Volitional control of neural activity: implications for brain-computer interfaces. J Physiol. 2007;579:571–9. doi: 10.1113/jphysiol.2006.127142. [DOI] [PMC free article] [PubMed] [Google Scholar]
- Folstein MF, Folstein SE, McHugh PR. “Mini-mental state”. A practical method for grading the cognitive state of patients for the clinician. J Psychiatr Res. 1975;12:189–98. doi: 10.1016/0022-3956(75)90026-6. [DOI] [PubMed] [Google Scholar]
- Fornito A, Zalesky A, Bassett DS, Meunier D, Ellison-Wright I, Yucel M, et al. Genetic influences on cost-efficient organization of human cortical functional networks. J Neurosci. 2011;31:3261–70. doi: 10.1523/JNEUROSCI.4858-10.2011. [DOI] [PMC free article] [PubMed] [Google Scholar]
- Frey SH, Fogassi L, Grafton S, Picard N, Rothwell JC, Schweighofer N, et al. Neurological principles and rehabilitation of action disorders: computation, anatomy, and physiology (CAP) model. Neurorehabil Neural Repair. 2011;25:6S–20S. doi: 10.1177/1545968311410940. [DOI] [PMC free article] [PubMed] [Google Scholar]
- Fridman EA, Hanakawa T, Chung M, Hummel F, Leiguarda RC, Cohen LG. Reorganization of the human ipsilesional premotor cortex after stroke. Brain. 2004;127:747–58. doi: 10.1093/brain/awh082. [DOI] [PubMed] [Google Scholar]
- Gao Q, Duan X, Chen H. Evaluation of effective connectivity of motor areas during motor imagery and execution using conditional Granger causality. Neuroimage. 2010;54:1280–8. doi: 10.1016/j.neuroimage.2010.08.071. [DOI] [PubMed] [Google Scholar]
- Glover S, Miall RC, Rushworth MF. Parietal rTMS disrupts the initiation but not the execution of on-line adjustments to a perturbation of object size. J Cogn Neurosci. 2005;17:124–36. doi: 10.1162/0898929052880066. [DOI] [PubMed] [Google Scholar]
- Grefkes C, Fink GR. Reorganization of cerebral networks after stroke: new insights from neuroimaging with connectivity approaches. Brain. 2011;134:1264–76. doi: 10.1093/brain/awr033. [DOI] [PMC free article] [PubMed] [Google Scholar]
- Grefkes C, Nowak DA, Wang LE, Dafotakis M, Eickhoff SB, Fink GR. Modulating cortical connectivity in stroke patients by rTMS assessed with fMRI and dynamic causal modeling. Neuroimage. 2010;50:233–42. doi: 10.1016/j.neuroimage.2009.12.029. [DOI] [PMC free article] [PubMed] [Google Scholar]
- Grol MJ, Majdandzic J, Stephan KE, Verhagen L, Dijkerman HC, Bekkering H, et al. Parieto-frontal connectivity during visually guided grasping. J Neurosci. 2007;27:11877–87. doi: 10.1523/JNEUROSCI.3923-07.2007. [DOI] [PMC free article] [PubMed] [Google Scholar]
- Grosse-Wentrup M, Mattia D, Oweiss K. Using brain-computer interfaces to induce neural plasticity and restore function. J Neural Eng. 2011a;8:025004. doi: 10.1088/1741-2560/8/2/025004. [DOI] [PMC free article] [PubMed] [Google Scholar]
- Grosse-Wentrup M, Scholkopf B, Hill J. Causal influence of gamma oscillations on the sensorimotor rhythm. Neuroimage. 2011b;56:837–42. doi: 10.1016/j.neuroimage.2010.04.265. [DOI] [PubMed] [Google Scholar]
- Grotta JC, Noser EA, Ro T, Boake C, Levin H, Aronowski J, et al. Constraint-induced movement therapy. Stroke. 2004;35:2699–701. doi: 10.1161/01.STR.0000143320.64953.c4. [DOI] [PubMed] [Google Scholar]
- Halder S, Agorastos D, Veit R, Hammer EM, Lee S, Varkuti B, et al. Neural mechanisms of brain-computer interface control. Neuroimage. 2011;55:1779–90. doi: 10.1016/j.neuroimage.2011.01.021. [DOI] [PubMed] [Google Scholar]
- Harris-Love ML, McCombe Waller S, Whitall J. Exploiting interlimb coupling to improve paretic arm reaching performance in people with chronic stroke. Arch Phys Med Rehabil. 2005;86:2131–7. doi: 10.1016/j.apmr.2005.05.006. [DOI] [PubMed] [Google Scholar]
- Harris-Love ML, Morton SM, Perez MA, Cohen LG. Mechanisms of short-term training-induced reaching improvement in severely hemiparetic stroke patients: a TMS study. Neurorehabil Neural Repair. 2011;25:398–411. doi: 10.1177/1545968310395600. [DOI] [PMC free article] [PubMed] [Google Scholar]
- Hinterberger T, Veit R, Wilhelm B, Weiskopf N, Vatine JJ, Birbaumer N. Neuronal mechanisms underlying control of a brain-computer interface. Eur J Neurosci. 2005;21:3169–81. doi: 10.1111/j.1460-9568.2005.04092.x. [DOI] [PubMed] [Google Scholar]
- Holtmaat A, Svoboda K. Experience-dependent structural synaptic plasticity in the mammalian brain. Nat Rev Neurosci. 2009;10:647–58. doi: 10.1038/nrn2699. [DOI] [PubMed] [Google Scholar]
- Honey CJ, Sporns O. Dynamical consequences of lesions in cortical networks. Hum Brain Mapp. 2008;29:802–9. doi: 10.1002/hbm.20579. [DOI] [PMC free article] [PubMed] [Google Scholar]
- Hummel F, Celnik P, Giraux P, Floel A, Wu WH, Gerloff C, et al. Effects of non-invasive cortical stimulation on skilled motor function in chronic stroke. Brain. 2005;128:490–9. doi: 10.1093/brain/awh369. [DOI] [PubMed] [Google Scholar]
- Jarosiewicz B, Chase SM, Fraser GW, Velliste M, Kass RE, Schwartz AB. Functional network reorganization during learning in a brain-computer interface paradigm. Proc Natl Acad Sci USA. 2008;105:19486–91. doi: 10.1073/pnas.0808113105. [DOI] [PMC free article] [PubMed] [Google Scholar]
- Jeannerod M, Arbib MA, Rizzolatti G, Sakata H. Grasping objects: the cortical mechanisms of visuomotor transformation. Trends Neurosci. 1995;18:314–20. [PubMed] [Google Scholar]
- Johansen-Berg H. Structural plasticity: rewiring the brain. Curr Biol. 2007;17:R141–4. doi: 10.1016/j.cub.2006.12.022. [DOI] [PubMed] [Google Scholar]
- Johansen-Berg H, Dawes H, Guy C, Smith SM, Wade DT, Matthews PM. Correlation between motor improvements and altered fMRI activity after rehabilitative therapy. Brain. 2002;125:2731–42. doi: 10.1093/brain/awf282. [DOI] [PubMed] [Google Scholar]
- Kiebel SJ, Garrido MI, Moran R, Chen CC, Friston KJ. Dynamic causal modeling for EEG and MEG. Hum Brain Mapp. 2009;30:1866–76. doi: 10.1002/hbm.20775. [DOI] [PMC free article] [PubMed] [Google Scholar]
- Krakauer JW. Arm function after stroke: from physiology to recovery. Semin Neurol. 2005;25:384–95. doi: 10.1055/s-2005-923533. [DOI] [PubMed] [Google Scholar]
- Krakauer JW. Motor learning: its relevance to stroke recovery and neurorehabilitation. Curr Opin Neurol. 2006;19:84–90. doi: 10.1097/01.wco.0000200544.29915.cc. [DOI] [PubMed] [Google Scholar]
- Kunimatsu A, Itoh D, Nakata Y, Kunimatsu N, Aoki S, Masutani Y, et al. Utilization of diffusion tensor tractography in combination with spatial normalization to assess involvement of the corticospinal tract in capsular/pericapsular stroke: feasibility and clinical implications. J Magn Reson Imaging. 2007;26:1399–404. doi: 10.1002/jmri.20945. [DOI] [PubMed] [Google Scholar]
- Lai SM, Studenski S, Duncan PW, Perera S. Persisting consequences of stroke measured by the Stroke Impact Scale. Stroke. 2002;33:1840–4. doi: 10.1161/01.str.0000019289.15440.f2. [DOI] [PubMed] [Google Scholar]
- Laughlin SB, Sejnowski TJ. Communication in neuronal networks. Science. 2003;301:1870–4. doi: 10.1126/science.1089662. [DOI] [PMC free article] [PubMed] [Google Scholar]
- Leemans A, Jones DK. The B-matrix must be rotated when correcting for subject motion in DTI data. Magn Reson Med. 2009;61:1336–49. doi: 10.1002/mrm.21890. [DOI] [PubMed] [Google Scholar]
- Legenstein R, Chase SM, Schwartz AB, Maass W. A reward-modulated hebbian learning rule can explain experimentally observed network reorganization in a brain control task. J Neurosci. 2010;30:8400–10. doi: 10.1523/JNEUROSCI.4284-09.2010. [DOI] [PMC free article] [PubMed] [Google Scholar]
- Lo AC, Guarino PD, Richards LG, Haselkorn JK, Wittenberg GF, Federman DG, et al. Robot-assisted therapy for long-term upper-limb impairment after stroke. N Engl J Med. 2010;362:1772–83. doi: 10.1056/NEJMoa0911341. [DOI] [PMC free article] [PubMed] [Google Scholar]
- Makris N, Kennedy DN, McInerney S, Sorensen AG, Wang R, Caviness VS, Jr, et al. Segmentation of subcomponents within the superior longitudinal fascicle in humans: a quantitative, in vivo, DT-MRI study. Cereb Cortex. 2005;15:854–69. doi: 10.1093/cercor/bhh186. [DOI] [PubMed] [Google Scholar]
- McFarland DJ, Miner LA, Vaughan TM, Wolpaw JR. Mu and beta rhythm topographies during motor imagery and actual movements. Brain Topogr. 2000;12:177–86. doi: 10.1023/a:1023437823106. [DOI] [PubMed] [Google Scholar]
- Mellinger J, Schalk G, Braun C, Preissl H, Rosenstiel W, Birbaumer N, et al. An MEG-based brain-computer interface (BCI) Neuroimage. 2007;36:581–93. doi: 10.1016/j.neuroimage.2007.03.019. [DOI] [PMC free article] [PubMed] [Google Scholar]
- Murphy TH, Corbett D. Plasticity during stroke recovery: from synapse to behaviour. Nat Rev Neurosci. 2009;10:861–72. doi: 10.1038/nrn2735. [DOI] [PubMed] [Google Scholar]
- Newton JM, Ward NS, Parker GJ, Deichmann R, Alexander DC, Friston KJ, et al. Non-invasive mapping of corticofugal fibres from multiple motor areas–relevance to stroke recovery. Brain. 2006;129:1844–58. doi: 10.1093/brain/awl106. [DOI] [PMC free article] [PubMed] [Google Scholar]
- Nomura EM, Gratton C, Visser RM, Kayser A, Perez F, D'Esposito M. Double dissociation of two cognitive control networks in patients with focal brain lesions. Proc Natl Acad Sci USA. 2010;107:12017–22. doi: 10.1073/pnas.1002431107. [DOI] [PMC free article] [PubMed] [Google Scholar]
- Nowak DA, Grefkes C, Dafotakis M, Eickhoff S, Kust J, Karbe H, et al. Effects of low-frequency repetitive transcranial magnetic stimulation of the contralesional primary motor cortex on movement kinematics and neural activity in subcortical stroke. Arch Neurol. 2008;65:741–7. doi: 10.1001/archneur.65.6.741. [DOI] [PubMed] [Google Scholar]
- Nudo RJ. Mechanisms for recovery of motor function following cortical damage. Curr Opin Neurobiol. 2006;16:638–44. doi: 10.1016/j.conb.2006.10.004. [DOI] [PubMed] [Google Scholar]
- Olivier E, Davare M, Andres M, Fadiga L. Precision grasping in humans: from motor control to cognition. Curr Opin Neurobiol. 2007;17:644–8. doi: 10.1016/j.conb.2008.01.008. [DOI] [PubMed] [Google Scholar]
- O'Shea J, Sebastian C, Boorman ED, Johansen-Berg H, Rushworth MF. Functional specificity of human premotor-motor cortical interactions during action selection. Eur J Neurosci. 2007;26:2085–95. doi: 10.1111/j.1460-9568.2007.05795.x. [DOI] [PubMed] [Google Scholar]
- Page SJ, Levine P, Leonard A. Mental practice in chronic stroke: results of a randomized, placebo-controlled trial. Stroke. 2007;38:1293–7. doi: 10.1161/01.STR.0000260205.67348.2b. [DOI] [PubMed] [Google Scholar]
- Page SJ, Szaflarski JP, Eliassen JC, Pan H, Cramer SC. Cortical plasticity following motor skill learning during mental practice in stroke. Neurorehabil Neural Repair. 2009;23:382–8. doi: 10.1177/1545968308326427. [DOI] [PMC free article] [PubMed] [Google Scholar]
- Palva S, Palva JM. Functional roles of alpha-band phase synchronization in local and large-scale cortical networks. Front Psychol. 2011;2:1–15. doi: 10.3389/fpsyg.2011.00204. [DOI] [PMC free article] [PubMed] [Google Scholar]
- Passingham RE, Stephan KE, Kotter R. The anatomical basis of functional localization in the cortex. Nat Rev Neurosci. 2002;3:606–16. doi: 10.1038/nrn893. [DOI] [PubMed] [Google Scholar]
- Pfurtscheller G. Graphical display and statistical evaluation of event-related desynchronization (ERD) Electroencephalogr Clin Neurophysiol. 1977;43:757–60. doi: 10.1016/0013-4694(77)90092-x. [DOI] [PubMed] [Google Scholar]
- Pfurtscheller G. Spatiotemporal ERD/ERS patterns during voluntary movement and motor imagery. Suppl Clin Neurophysiol. 2000;53:196–8. doi: 10.1016/s1567-424x(09)70157-6. [DOI] [PubMed] [Google Scholar]
- Pierpaoli C, Walker L, Irfanoglu MO, Barnett A, Basser P, Chang LC, et al. ISMRM 18th Annual Meeting. Stockholm, Sweden; #1597: 2010. TORTOISE: an integrated software package for processing of diffusion MRI data. [Google Scholar]
- Pineda JA. The functional significance of mu rhythms: translating “seeing” and “hearing” into “doing”. Brain Res Brain Res Rev. 2005;50:57–68. doi: 10.1016/j.brainresrev.2005.04.005. [DOI] [PubMed] [Google Scholar]
- Pomeroy V, Aglioti SM, Mark VW, McFarland D, Stinear C, Wolf SL, et al. Neurological principles and rehabilitation of action disorders: rehabilitation interventions. Neurorehabil Neural Repair. 2011;25:33S–43S. doi: 10.1177/1545968311410942. [DOI] [PMC free article] [PubMed] [Google Scholar]
- Prasad G, Herman P, Coyle D, McDonough S, Crosbie J. Applying a brain-computer interface to support motor imagery practice in people with stroke for upper limb recovery: a feasibility study. J Neuroeng Rehabil. 2010;7:60. doi: 10.1186/1743-0003-7-60. [DOI] [PMC free article] [PubMed] [Google Scholar]
- Price JL, Carmichael ST, Drevets WC. Networks related to the orbital and medial prefrontal cortex; a substrate for emotional behavior? Prog Brain Res. 1996;107:523–36. doi: 10.1016/s0079-6123(08)61885-3. [DOI] [PubMed] [Google Scholar]
- Rehme AK, Eickhoff SB, Wang LE, Fink GR, Grefkes C. Dynamic causal modeling of cortical activity from the acute to the chronic stage after stroke. Neuroimage. 2011b;55:1147–58. doi: 10.1016/j.neuroimage.2011.01.014. [DOI] [PMC free article] [PubMed] [Google Scholar]
- Rehme AK, Fink GR, von Cramon DY, Grefkes C. The role of the contralesional motor cortex for motor recovery in the early days after stroke assessed with longitudinal FMRI. Cereb Cortex. 2011a;21:756–68. doi: 10.1093/cercor/bhq140. [DOI] [PubMed] [Google Scholar]
- Riley JD, Le V, Der-Yeghiaian L, See J, Newton JM, Ward NS, et al. Anatomy of stroke injury predicts gains from therapy. Stroke. 2011;42:421–6. doi: 10.1161/STROKEAHA.110.599340. [DOI] [PMC free article] [PubMed] [Google Scholar]
- Rohde GK, Barnett AS, Basser PJ, Marenco S, Pierpaoli C. Comprehensive approach for correction of motion and distortion in diffusion-weighted MRI. Magn Reson Med. 2004;51:103–114. doi: 10.1002/mrm.10677. [DOI] [PubMed] [Google Scholar]
- Rubinov M, Sporns O. Complex network measures of brain connectivity: uses and interpretations. Neuroimage. 2010;52:1059–69. doi: 10.1016/j.neuroimage.2009.10.003. [DOI] [PubMed] [Google Scholar]
- Sawaki L, Butler AJ, Leng X, Wassenaar PA, Mohammad YM, Blanton S, et al. Constraint-induced movement therapy results in increased motor map area in subjects 3 to 9 months after stroke. Neurorehabil Neural Repair. 2008;22:505–13. doi: 10.1177/1545968308317531. [DOI] [PMC free article] [PubMed] [Google Scholar]
- Schmahmann JD, Pandya DN. Disconnection syndromes of basal ganglia, thalamus, and cerebrocerebellar systems. Cortex. 2008;44:1037–66. doi: 10.1016/j.cortex.2008.04.004. [DOI] [PMC free article] [PubMed] [Google Scholar]
- Schmahmann JD, Pandya DN, Wang R, Dai G, D'Arceuil HE, de Crespigny AJ, et al. Association fibre pathways of the brain: parallel observations from diffusion spectrum imaging and autoradiography. Brain. 2007;130:630–53. doi: 10.1093/brain/awl359. [DOI] [PubMed] [Google Scholar]
- Shadmehr R, Wise SP. The computational neurobiology of reaching and pointing: a foundation for motor learning. Cambridge, MA: MIT Press; 2005. [Google Scholar]
- Sharma N, Baron JC, Rowe JB. Motor imagery after stroke: relating outcome to motor network connectivity. Ann Neurol. 2009a;66:604–16. doi: 10.1002/ana.21810. [DOI] [PMC free article] [PubMed] [Google Scholar]
- Sharma N, Jones PS, Carpenter TA, Baron JC. Mapping the involvement of BA 4a and 4p during Motor Imagery. Neuroimage. 2008;41:92–9. doi: 10.1016/j.neuroimage.2008.02.009. [DOI] [PubMed] [Google Scholar]
- Sharma N, Pomeroy VM, Baron JC. Motor imagery: a backdoor to the motor system after stroke? Stroke. 2006;37:1941–52. doi: 10.1161/01.STR.0000226902.43357.fc. [DOI] [PubMed] [Google Scholar]
- Sharma N, Simmons LH, Jones PS, Day DJ, Carpenter TA, Pomeroy VM, et al. Motor imagery after subcortical stroke: a functional magnetic resonance imaging study. Stroke. 2009b;40:1315–24. doi: 10.1161/STROKEAHA.108.525766. [DOI] [PubMed] [Google Scholar]
- Shimazu H, Maier MA, Cerri G, Kirkwood PA, Lemon RN. Macaque ventral premotor cortex exerts powerful facilitation of motor cortex outputs to upper limb motoneurons. J Neurosci. 2004;24:1200–11. doi: 10.1523/JNEUROSCI.4731-03.2004. [DOI] [PMC free article] [PubMed] [Google Scholar]
- Siegel S, Castellan NJ. Nonparametric statistics for the behavioral sciences. New York: McGraw-Hill; 1988. [Google Scholar]
- Sporns O. The human connectome: a complex network. Ann N Y Acad Sci. 2011;1224:109–25. doi: 10.1111/j.1749-6632.2010.05888.x. [DOI] [PubMed] [Google Scholar]
- Street JO, Carroll RJ, Ruppert D. A Note on Computing Robust Regression Estimates Via Iteratively Reweighted Least-Squares. American Statistician. 1988;42:152–4. [Google Scholar]
- Taub E, Miller NE, Novack TA, Cook EW, III, Fleming WC, Nepomuceno CS, et al. Technique to improve chronic motor deficit after stroke. Arch Phys Med Rehabil. 1993;74:347–54. [PubMed] [Google Scholar]
- Tomassini V, Jbabdi S, Klein JC, Behrens TE, Pozzilli C, Matthews PM, et al. Diffusion-weighted imaging tractography-based parcellation of the human lateral premotor cortex identifies dorsal and ventral subregions with anatomical and functional specializations. J Neurosci. 2007;27:10259–69. doi: 10.1523/JNEUROSCI.2144-07.2007. [DOI] [PMC free article] [PubMed] [Google Scholar]
- Tunik E, Frey SH, Grafton ST. Virtual lesions of the anterior intraparietal area disrupt goal-dependent on-line adjustments of grasp. Nat Neurosci. 2005;8:505–11. doi: 10.1038/nn1430. [DOI] [PMC free article] [PubMed] [Google Scholar]
- Tunik E, Lo OY, Adamovich SV. Transcranial magnetic stimulation to the frontal operculum and supramarginal gyrus disrupts planning of outcome-based hand-object interactions. J Neurosci. 2008;28:14422–7. doi: 10.1523/JNEUROSCI.4734-08.2008. [DOI] [PMC free article] [PubMed] [Google Scholar]
- Umilta MA, Brochier T, Spinks RL, Lemon RN. Simultaneous recording of macaque premotor and primary motor cortex neuronal populations reveals different functional contributions to visuomotor grasp. J Neurophysiol. 2007;98:488–501. doi: 10.1152/jn.01094.2006. [DOI] [PubMed] [Google Scholar]
- van den Heuvel MP, Stam CJ, Kahn RS, Hulshoff Pol HE. Efficiency of functional brain networks and intellectual performance. J Neurosci. 2009;29:7619–24. doi: 10.1523/JNEUROSCI.1443-09.2009. [DOI] [PMC free article] [PubMed] [Google Scholar]
- Wang L, Yu C, Chen H, Qin W, He Y, Fan F, et al. Dynamic functional reorganization of the motor execution network after stroke. Brain. 2010a;133:1224–38. doi: 10.1093/brain/awq043. [DOI] [PubMed] [Google Scholar]
- Wang LE, Fink GR, Diekhoff S, Rehme AK, Eickhoff SB, Grefkes C. Noradrenergic enhancement improves motor network connectivity in stroke patients. Ann Neurol. 2011;69:375–88. doi: 10.1002/ana.22237. [DOI] [PMC free article] [PubMed] [Google Scholar]
- Wang W, Collinger JL, Perez MA, Tyler-Kabara EC, Cohen LG, Birbaumer N, et al. Neural interface technology for rehabilitation: exploiting and promoting neuroplasticity. Phys Med Rehabil Clin N Am. 2010b;21:157–78. doi: 10.1016/j.pmr.2009.07.003. [DOI] [PMC free article] [PubMed] [Google Scholar]
- Ward NS. Plasticity and the functional reorganization of the human brain. Int J Psychophysiol. 2005;58:158–61. doi: 10.1016/j.ijpsycho.2005.02.009. [DOI] [PubMed] [Google Scholar]
- Ward NS, Brown MM, Thompson AJ, Frackowiak RS. Neural correlates of motor recovery after stroke: a longitudinal fMRI study. Brain. 2003;126:2476–96. doi: 10.1093/brain/awg245. [DOI] [PMC free article] [PubMed] [Google Scholar]
- Ward NS, Newton JM, Swayne OB, Lee L, Thompson AJ, Greenwood RJ, Rothwell JC, Frackowiak RS. Motor system activation after subcortical stroke depends on corticospinal system integrity. Brain. 2006;129:809–19. doi: 10.1093/brain/awl002. [DOI] [PMC free article] [PubMed] [Google Scholar]
- Wilbrecht L, Holtmaat A, Wright N, Fox K, Svoboda K. Structural plasticity underlies experience-dependent functional plasticity of cortical circuits. J Neurosci. 2010;30:4927–32. doi: 10.1523/JNEUROSCI.6403-09.2010. [DOI] [PMC free article] [PubMed] [Google Scholar]
- Wolf SL, Newton H, Maddy D, Blanton S, Zhang Q, Winstein CJ, et al. The Excite Trial: relationship of intensity of constraint induced movement therapy to improvement in the wolf motor function test. Restor Neurol Neurosci. 2007;25:549–62. [PubMed] [Google Scholar]
- Wolf SL, Thompson PA, Winstein CJ, Miller JP, Blanton SR, Nichols-Larsen DS, et al. The EXCITE stroke trial: comparing early and delayed constraint-induced movement therapy. Stroke. 2010;41:2309–15. doi: 10.1161/STROKEAHA.110.588723. [DOI] [PMC free article] [PubMed] [Google Scholar]
- Wolpaw JR. Brain-computer interfaces as new brain output pathways. J Physiol. 2007;579:613–9. doi: 10.1113/jphysiol.2006.125948. [DOI] [PMC free article] [PubMed] [Google Scholar]
- Wolpert DM. Computational approaches to motor control. Trends Cogn Sci. 1997;1:209–16. doi: 10.1016/S1364-6613(97)01070-X. [DOI] [PubMed] [Google Scholar]
- Wolpert DM, Ghahramani Z. Computational principles of movement neuroscience. Nat Neurosci. 2000;3(Suppl):1212–7. doi: 10.1038/81497. [DOI] [PubMed] [Google Scholar]
- Yu X, Zuo Y. Spine plasticity in the motor cortex. Curr Opin Neurobiol. 2011;21:169–74. doi: 10.1016/j.conb.2010.07.010. [DOI] [PMC free article] [PubMed] [Google Scholar]
- Zhang H, Yushkevich PA, Alexander DC, Gee JC. Deformable registration of diffusion tensor MR images with explicit orientation optimization. Med Image Anal. 2006;10:764–85. doi: 10.1016/j.media.2006.06.004. [DOI] [PubMed] [Google Scholar]
- Zhang Y, Zhang J, Oishi K, Faria AV, Jiang H, Li X, et al. Atlas-guided tract reconstruction for automated and comprehensive examination of the white matter anatomy. Neuroimage. 2010;52:1289–301. doi: 10.1016/j.neuroimage.2010.05.049. [DOI] [PMC free article] [PubMed] [Google Scholar]