Abstract
Ezetimibe (EZE) lowers serum lipid levels by blocking cholesterol uptake in the intestine. Disposition of EZE and its pharmacologically active glucuronide metabolite (EZE-GLUC) to the intestine is dependent on hepatobiliary efflux. Previous studies suggested that hepatic transporter expression and function may be altered during nonalcoholic steatohepatitis (NASH). The purpose of the current study was to determine whether NASH-induced changes in the expression and function of hepatic transporters result in altered disposition of EZE and EZE-GLUC. Rats fed a methionine- and choline-deficient (MCD) diet for 8 weeks were administered 10 mg/kg EZE either by intravenous bolus or oral gavage. Plasma and bile samples were collected over 2 h followed by terminal urine and tissue collection. EZE and EZE-GLUC concentrations were determined by liquid chromatography-tandem mass spectrometry. The sinusoidal transporter Abcc3 was induced in MCD rats, which correlated with increased plasma concentrations of EZE-GLUC, regardless of dosing method. Hepatic expression of the biliary transporters Abcc2 and Abcb1 was also increased in MCD animals, but the biliary efflux of EZE-GLUC was slightly diminished, whereas biliary bile acid concentrations were unaltered. The cellular localization of Abcc2 and Abcb1 appeared to be internalized away from the canalicular membrane in MCD livers, providing a mechanism for the shift to plasma drug efflux. The combination of induced expression and altered localization of efflux transporters in NASH shifts the disposition profile of EZE-GLUC toward plasma retention away from the site of action. This increased plasma retention of drugs in NASH may have implications for the pharmacological effect and safety of numerous drugs.
Introduction
Nonalcoholic fatty liver disease (NAFLD), which is believed to be the most common liver disease in Western society (Marra et al., 2008), is a complex multifaceted malady, which originates as simple steatosis and may progress to the more severe nonalcoholic steatohepatitis (NASH). Recent estimates indicate that NAFLD affects 17 to 40% of adults with 40% of those patients often unknowingly having the more severe form NASH (McCullough, 2006; Ali and Cusi, 2009). NAFLD is regarded as the hepatic component of the multisymptom metabolic syndrome (Fan, 2008), of which 90% of patients with NAFLD exhibit at least one clinical feature (Adams and Angulo, 2005). The presence of multiple features of the metabolic syndrome in patients with NAFLD correlates with hepatic histological severity, with patients with NASH exhibiting numerous symptoms (Marchesini et al., 2003; McCullough, 2006; Fan, 2008). Because of the prevalence of metabolic syndrome in patients with NAFLD and the multiplicity of symptoms (dyslipidemia, hyperinsulinemia, central adiposity, and hypertension), patients with NAFLD may often be medicated for several symptoms. We have previously investigated the effect of NAFLD on the disposition of acetaminophen (Lickteig et al., 2007) and the function of uptake transporters (Fisher et al., 2009a) in rodent models of simple steatosis and NASH. These studies have led us to hypothesize that NASH, in particular, causes significant disruption in hepatic metabolism and disposition of administered pharmaceuticals due to alterations in hepatic drug transporters. However, the precise mechanisms underlying these dispositional alterations in rodents and their manifestation in human NAFLD remain elusive.
Ezetimibe (EZE) is an orally administered cholesterol absorption inhibitor that acts primarily via inhibition of Niemann-Pick C1-like 1 (NPC1L1) at the villus tip of enterocytes of the small intestine (Garcia-Calvo et al., 2005; Kosoglou et al., 2005). EZE is quickly metabolized (∼80%) to a glucuronide metabolite (EZE-GLUC) within enterocytes, followed by delivery of parent drug and metabolite, via the portal vein, to the liver where additional EZE glucuronidation occurs (Kosoglou et al., 2005). EZE and EZE-GLUC is then excreted into bile and returned to the small intestinal lumen for inhibition of NPC1L1 (Kosoglou et al., 2005). Enterohepatic recycling of EZE and EZE-GLUC is thought to be an important determinant of the long half-life and efficacy of EZE because both parent and metabolite are pharmacologically active; however, EZE-GLUC is believed to be a more potent inhibitor of NPC1L1 and accounts for the vast majority of drug (80–90%) measured in biological compartments (Kosoglou et al., 2005).
Studies in knockout animals have demonstrated the importance of several efflux drug transporters in the disposition of EZE and EZE-GLUC. In particular, Abcc2 and Abcb1 have been implicated as having a major role in the biliary excretion of EZE-GLUC (Oswald et al., 2006b, 2007, 2010), whereas Abcc3 mediates sinusoidal efflux (de Waart et al., 2009). Under normal physiological conditions, EZE is eliminated primarily via feces in unconjugated form, which may be due to hydrolysis of the EZE-GLUC secreted into bile (Kosoglou et al., 2005). However, in the absence of Abcc2, EZE disposition into the blood from the liver increases and leads to an increase in urinary excretion of EZE and EZE-GLUC (Oswald et al., 2006b). Diminished biliary excretion of EZE-GLUC and concomitant increased urinary excretion may have an effect on drug half-life and overall systemic exposure, necessitating dosage adjustments. In the present study, we examined the effect of NASH on the disposition of EZE and its major glucuronide metabolite. EZE is administered orally to humans; however, the expression profile of drug transporters in the methionine- and choline-deficient (MCD) diet rodent model has not been characterized. We therefore chose to dose both orally and intravenously to discern the hepatic contribution to EZE disposition in NASH. In addition, we have conducted expression and localization analyses of major hepatic efflux drug transporters involved in the disposition of EZE and EZE-GLUC in the MCD diet rodent model of NASH to more clearly understand the potential effects of NAFLD on clinical drug disposition.
Materials and Methods
Materials.
Ezetimibe (E975000) was obtained from Toronto Research Chemicals Inc. (North York, Ontario, Canada) and was determined to be 99.8% pure. Urethane, carboxymethylcellulose, ethanol, propylene glycol, polyethylene glycol, HPLC-grade methanol, HPLC-grade methyl tert-butyl ether, and β-glucuronidase (>5000 U) were obtained from Sigma-Aldrich (St. Louis, MO). Neutral-buffered formalin (10%) and HPLC-grade H2O were acquired through Thermo Fisher Scientific (Waltham, MA).
Animals.
Male Sprague-Dawley rats weighing 200 to 250 g were obtained from Harlan (Indianapolis, IN). All animals were acclimated in 12-h light/dark cycles in a University of Arizona Association for Assessment and Accreditation of Laboratory Animal Care-certified animal facility for at least 1 week before experiments and were allowed water and standard chow ad libitum. Housing and experimental procedures were in accordance with National Institutes of Health Guide for the Care and Use of Laboratory Animals (Institute of Laboratory Animal Resources, 1996). Rats were fed a control diet with methionine and choline resupplemented or a methionine-choline deficient (MCD) diet (Dyets Inc., Bethlehem, PA) for 8 weeks. At the conclusion of 8 weeks and before initiation of EZE experiments, control animals weighed an average of 400.006 ± 6.895 g and MCD/NASH animals weighed an average of 194.36 ± 2.283 g. Weight loss in the MCD model is a common and well documented side effect (Fan and Qiao, 2009; Schattenberg and Galle, 2010).
Ezetimibe Disposition Experiments.
After 8 weeks of the respective diet treatment, animals were administered a bolus dose of urethane (1.2 g/kg i.p., w/v). The femoral artery and vein were cannulated with PE-50 polyethylene tubing (Braintree Scientific, Braintree, MA), and the common bile duct was cannulated with PE-10 polyethylene tubing (Braintree Scientific) distal to the bile duct bifurcation. Animal core temperature was maintained throughout collection of bile with a TCAT-2V temperature monitor and heat pad (Physitemp Instruments Inc., Clifton, NJ). Animals were administered a 10 mg/kg dose (5 ml/kg) of EZE either orally (n = 3–5, prepared in 0.25% carboxymethylcellulose) or intravenously through the femoral vein cannula (n = 3–5, prepared in 10% ethanol, 40% propylene glycol, 30% PEG 400, and 20% sterile H2O). Blood samples (100 μl) were drawn from the femoral artery cannula at 0, 2, 10, 20, 40, 60, 90, and 120 min. Bile samples were collected in chilled tubes at 15-min intervals for 120 min after EZE administration. Terminal urine samples were collected via bladder puncture and collected in preweighed tubes. All samples were stored at −80°C until use. After sample collections, animals were euthanized while still under anesthesia. After euthanasia, liver slices for histological analysis were collected and placed in 10% neutral-buffered formalin for 24 h followed by 70% ethanol until paraffin embedding was performed by the University of Arizona Histology Service Laboratory. The remaining liver tissue was snap-frozen in liquid nitrogen and stored at −80°C until further use. Small intestines were sectioned by forming a “Z” with the full length of the organ, differentiating the duodenum, jejunum, and ileum in order. Tissue samples for the duodenum and ileum were taken from the middle of the first and third arms of the Z, flushed with sterile H2O, snap-frozen in liquid nitrogen, and stored at −80°C until use.
Sample Preparation.
All reagents used were of HPLC-grade quality. Sample were prepared according to the methods of Oswald et al. (2006a, 2007) with slight modifications for smaller volumes. For determination of EZE, 25 μl of plasma, urine, or bile was mixed with 2 μl of hydroxychalcone internal standard solution. The mixture was then diluted with 0.4 ml of H2O. Samples were then extracted with 0.8 ml of methyl tert-butyl ether for 15 min followed by centrifugation at 4000 rpm for 2 min. The organic layer was transferred to a clean tube. The extraction was then repeated, and the resulting combined organic layers were evaporated under a gentle stream of N2 at 50°C. The residue was then dissolved in 77.8% aqueous methanol. For determination of total EZE (parent plus conjugated EZE), before the above described protocol, 90 μl of H2O and 10 μl of β-glucuronidase (>5000 U) were added to the 25-μl sample and incubated at 50°C for 60 min. After cooling, the above-described protocol was resumed with dilution of the sample in 0.3 ml of H2O. For determination of EZE in liver tissue, 500 mg of tissue was homogenized in 2.5 ml of H2O. Then, 0.1 ml of homogenate was mixed with 0.2 ml of H2O and 2 μl of internal standard solution. The protocol was then continued as described above for plasma, urine, and bile. To determine total EZE in liver tissue, 0.1 ml of the prepared tissue homogenate was combined with 90 μl of H2O and 10 μl of β-glucuronidase. The mixture was incubated for 60 min at 50°C. Then the sample was allowed to cool and diluted with 0.2 ml of H2O and 2 μl of internal standard solution. Extractions were performed as described above.
Determination of Total EZE, EZE, and EZE-GLUC Concentrations.
LC-MS/MS detection of total EZE, EZE, and EZE-GLUC was conducted on the basis of the method of Oswald et al. (2006a) in the Arizona Laboratory for Emerging Contaminants. The LC-MS/MS system was composed of a Waters-Micromass Quattro Premier XE tandem mass spectrometer (Waters, Milford, MA) and an Acquity UPLC system with an auto-sampler (Waters) equipped with MassLynx 4.1 software (Waters). The chromatography was performed with a gradient beginning at 20:80 (v/v) acetonitrile-water and ending at 80:20 (v/v) acetonitrile-water for 7 min with a flow rate of 0.25 ml/min on an Acquity UPLC BH C18 (1.7 μm; 2.1 × 50 mm) column (Waters). The mass spectrometer was used in multiple reaction monitoring mode and equipped with an electrospray ionization source in the negative mode. The m/z transitions monitored were 408 to 271 for EZE and 223 to 117 for internal standard. The concentration of EZE was determined for all samples submitted. EZE-GLUC concentrations were calculated as the difference between total EZE and EZE measurements.
RNA Preparations.
Total RNA was isolated from rodent liver and intestinal tissue using RNAzol B reagent (Tel-Test Inc., Friendswood, TX) per the manufacturer's recommendations. RNA concentrations were determined by UV spectrophotometry, and the integrity of the RNA was confirmed by ethidium bromide staining after agarose gel electrophoresis.
Protein Preparations.
Whole-cell lysate preparations of rodent liver and intestinal tissue were prepared from ∼300 mg of tissue homogenized in NP-40 buffer [20 mM Tris-HCl, 137 mM NaCl, 10% glycerol, 1% Nonidet P-40, and 2 mM EDTA with 1 Protease Inhibitor Cocktail Tablet (Roche, Indianapolis, IN) per 25 ml] at 4°C. Homogenized tissue was then agitated at 4°C for 2 h and centrifuged at 10,000g for 30 min, and the supernatant was transferred to a clean collection tube. Protein concentrations were determined using the Pierce BCA Protein Quantitation Assay (Thermo Fisher Scientific) per the manufacturer's recommendations.
Branched DNA Assay.
Specific oligonucleotide probes for Abcc2 and Abcc3, Mdr1a and Mdr1b (Brady et al., 2002; Cherrington et al., 2002), and Ugt1a1 (Vansell and Klaassen, 2002) were diluted in lysis buffer supplied by the Quantigene HV Signal Amplification Kit (Genospectra, Fremont, CA). Substrate solution, lysis buffer, capture hybridization buffer, amplifier, and label probe buffer used in the analysis were all obtained from the Quantigene Discovery Kit (Genospectra). The assay was performed in 96-well format with 10 μg (liver) or 5 μg (intestine) of total RNA added to the capture hybridization buffer and 50 μl of the diluted probe set. The total RNA was then allowed to hybridize to the probe set overnight at 53°C. Hybridization steps were performed per the manufacturer's protocol on the following day. Luminescence of the samples was measured with a Quantiplex 320 bDNA luminometer interfaced with Quantiplex Data Management Software (version 5.02).
Immunoblot Protein Analysis.
Whole-cell lysate proteins (80 μg/well, liver and 40 μg/well, intestine) were separated by SDS-polyacrylamide gel electrophoresis on 10% gels and transferred to polyvinylidene difluoride membranes overnight. The following mouse monoclonal antibodies were obtained from Abcam, Inc. (Cambridge, MA) and used to determine relative protein levels: Abcc3 (M3II-9) and Abcb1 (C219). Abcc2 (M2III-5) protein levels were determined using a mouse monoclonal antibody obtained from Kamiya Biomedical Company (Seattle, WA). Protein levels of Ugt1a1 were determined using a rabbit polyclonal antibody (Abcam, Inc.). Relative protein expression was quantitated using image processing and analysis with ImageJ software (National Institutes of Health, Bethesda, MD) and normalized to total ERK (C-16 and C-14; Santa Cruz Biotechnology, Inc., Santa Cruz, CA).
Bile Acid Concentrations.
Bile acids were measured in rodent bile samples at time 0 of disposition studies. Bile samples were diluted 1 μl in 49 μl of sterile-filtered saline. A Diazyme Total Bile Acids Assay Kit (Diazyme Laboratories, Poway, CA) was used to determine total bile acid concentrations spectrophotometrically over a 1-min interval at 405 nm per the manufacturer's instructions. The assay was calibrated using a manufacturer-provided standard 50 μM bile acid calibrator solution.
Immunohistochemistry.
Immunohistochemical staining for all proteins was performed on formalin-fixed, paraffin-embedded samples. In brief, tissue sections were deparaffinized in xylene and rehydrated in ethanol, followed by antigen retrieval in citrate buffer (pH 6.0, Abcb1) or Tris-EDTA buffer (pH 9.0, Abcc2). Endogenous peroxidase activity was blocked with 0.3% (v/v) H2O2 in methanol for 20 min. Immunohistochemical staining for Abcb1 was performed with a MACH3 staining kit (Biocare Medical, Concord, CA) per the manufacturer's protocol. Samples were incubated in a primary antibody (antibodies described above) solution overnight at 4°C. Immunohistochemical staining for Abcc2 was performed with the MACH4 staining kit (Biocare Medical) per the manufacturer's recommendations. Abcc2 antibody incubation was performed overnight at 4°C. All slides were imaged with a Nikon Eclipse E4000 microscope and a Sony Exwave DXC-390 camera.
Statistical Analysis.
For disposition studies, a Student's t test was used to determine significant differences between diet groups at all time points. All subsequent data were analyzed by Student t test to determine significant differences between diet groups. All analyses were performed with Stata10 software (StataCorp LP, College Station, TX), and a significance level of p ≤ 0.05 was used for all data analyses.
Results
Hepatic Gene and Protein Expression in Diet-Induced NASH.
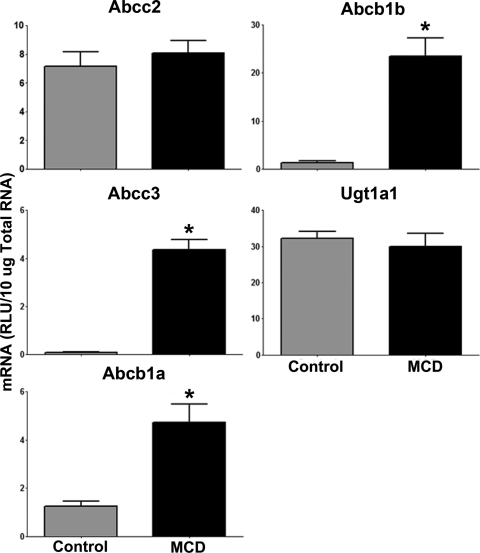
mRNA levels of Abcc2, Abcc3, Abcb1a, Abcb1b, and Ugt1a1 were determined by the branched DNA method of RNA quantification in control and MCD rat livers, and the results are shown in Fig. 1. In MCD livers, Abcc3 mRNA levels were significantly increased (44.8-fold) from control. In addition, Abcb1a and Abcb1b mRNA levels were both significantly elevated in MCD livers (3.8- and 17.3-fold, respectively). Abcc2 and Ugt1a1 were not altered at the transcriptional level.
Fig. 1.
Hepatic mRNA expression in diet-induced NASH: mRNA levels in rats fed either a control or MCD diet for 8 weeks. mRNA levels were measured by the branched DNA assay and expressed as relative lights units (RLU) per 10 μg of total RNA. Data are presented as means ± S.E.M. *, significant difference from control with a significance level of p ≤ 0.05.
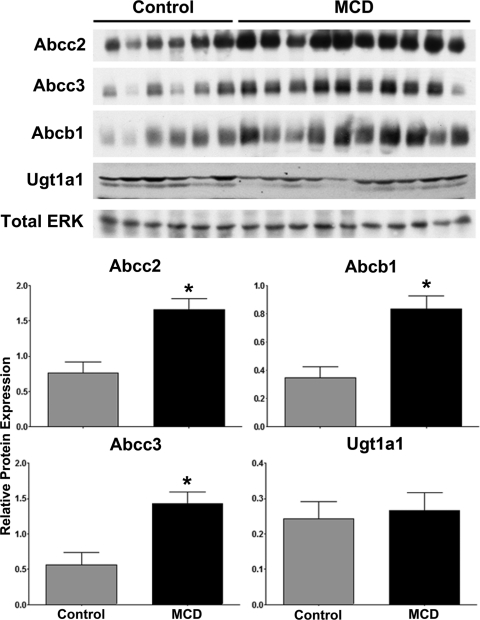
Figure 2 shows relative protein levels of Abcc2, 3, Abcb1, and Ugt1a1 in control and MCD rat livers as determined by immunoblot analysis. Abcc2, Abcc3, and Abcb1 efflux drug transporters were significantly elevated in MCD livers (2.2-, 2.5-, and 2.4-fold, respectively); however, no significant alterations in Ugt1a1 protein levels were observed.
Fig. 2.
Hepatic protein expression in diet-induced NASH: protein levels in rats fed either a control or MCD diet for 8 weeks. Immunoblots are shown with total ERK as the control protein. Relative protein levels were determined by densitometric analysis and expressed relative to total ERK. Data are presented as means ± S.E.M. *, significant difference from control with a significance level of p ≤ 0.05.
EZE and EZE-GLUC Disposition in Diet-Induced NASH.
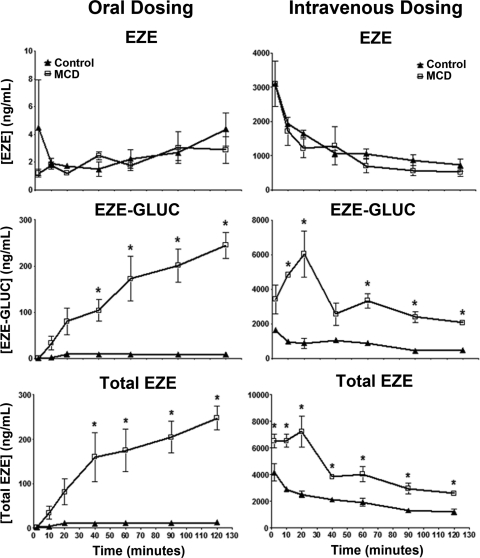
EZE is clinically administered as a 10-mg oral dose; however, because the intestinal expression of drug transporters important to the disposition of EZE has not yet been evaluated in the MCD diet rodent model of NASH, we chose to dose EZE both orally and intravenously. This allowed for separate determination of both the hepatic and intestinal contribution to EZE disposition in NASH. Figure 3 shows plasma concentrations of EZE, EZE-GLUC, and total EZE after either oral or intravenous dosing over a 120-min period. Total EZE and EZE-GLUC plasma concentrations were significantly elevated above control beginning at 40 min after oral dosing of EZE. This elevation above control persisted until conclusion of the experiment at 120 min. After intravenous dosing of EZE, MCD animals exhibited significantly higher plasma concentrations of total EZE throughout the study. Likewise, plasma concentrations of EZE-GLUC were significantly elevated in MCD animals beginning at 10 min and continuing throughout the study. No significant changes in the sinusoidal efflux of EZE were observed between diet groups regardless of dosing method.
Fig. 3.
Effect of diet-induced NASH on plasma EZE, EZE-GLUC, and total EZE concentrations. After 8 weeks of control (▴) and MCD (□) diet feeding, EZE disposition experiments were conducted. Femoral artery and vein and bile duct cannulations were performed, and animals were administered either an oral or intravenous dose of 10 mg/kg EZE. Plasma samples were collected beginning 2 min after dose until 120 min. Concentrations of total EZE and EZE were determined by LC-MS/MS; EZE-GLUC concentrations were calculated as the difference between total EZE and EZE. Data are presented as means ± S.E.M. *, significant difference from control for each time point with a significance level of p ≤ 0.05.
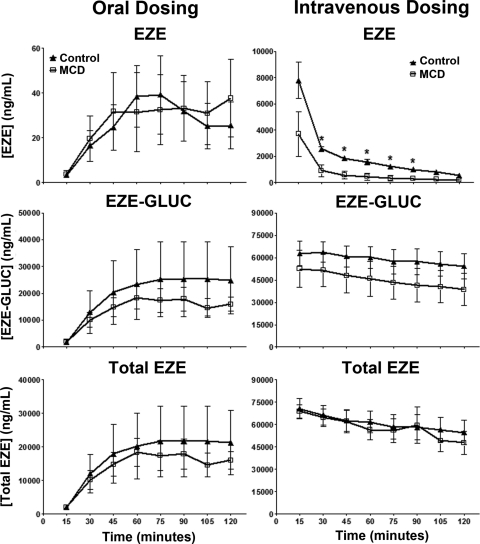
Biliary concentrations of EZE, EZE-GLUC, and total EZE are shown in Fig. 4. Total EZE and EZE-GLUC concentrations in MCD rodent bile were decreased from control in orally dosed animals; however, these results were not significant. Likewise, EZE-GLUC biliary concentrations were consistently lower in intravenously dosed MCD animals, but not to a significant extent. EZE biliary concentrations in intravenously dosed MCD animals were significantly decreased from control beginning at 30 min and continuing until 90 min.
Fig. 4.
Effect of diet-induced NASH on biliary concentrations of EZE, EZE-GLUC, and total EZE. The experimental and analytical conditions were the same as those described for Fig. 3. Bile concentrations of EZE, EZE-GLUC, and total EZE are shown in control (▴) and MCD (□) rodents. After EZE dosing, bile was collected at 15-min intervals over a 120-min period. Data are presented as means ± S.E.M. *, significant difference from control for each time point with a significance level of p ≤ 0.05.
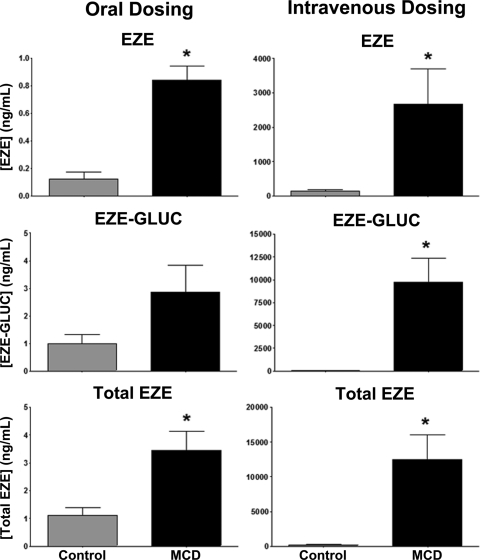
Urine samples were collected by bladder puncture at the conclusion of the 120-min experiment. Urinary concentrations of EZE, EZE-GLUC, and total EZE in control and MCD animals are shown in Fig. 5. Total EZE and EZE concentrations were significantly higher in orally dosed MCD animals than in control animals. Analysis of intravenously dosed animals revealed a significant increase in EZE, EZE-GLUC, and total EZE urinary concentrations in MCD animals.
Fig. 5.
Effect of diet-induced NASH on urinary total EZE, EZE, and EZE-GLUC concentrations. The experimental and analytical conditions were the same as those described for Fig. 3. Terminal urine was collected by bladder puncture 120 min after dosing. Data are presented as means ± S.E.M. *, significant difference from control for each time point with a significance level of p ≤ 0.05.
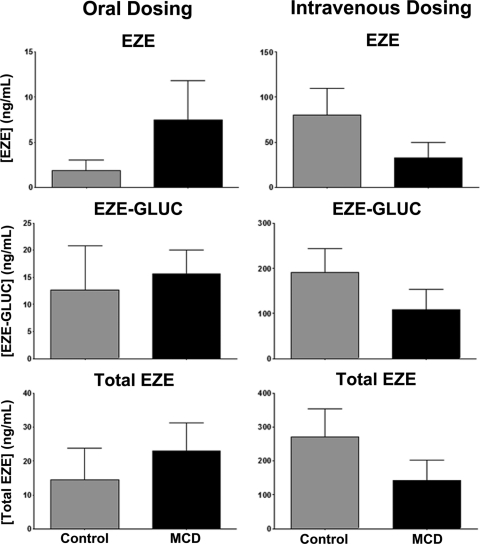
Hepatic tissue concentrations of EZE, EZE-GLUC, and total EZE are shown in Fig. 6. No significant alterations in tissue retention of total EZE, EZE, or EZE-GLUC were observed for either orally or intravenously dosed animals.
Fig. 6.
Hepatic tissue retention of total EZE, EZE, and EZE-GLUC in rodent NASH. The experimental and analytical conditions were the same as those described for Fig. 3. Liver tissue was snap-frozen 120 min after dosing. Total EZE, EZE, and EZE-GLUC concentrations in liver tissue are shown. Data are presented as means ± S.E.M. *, significant difference from control for each time point with a significance level of p ≤ 0.05.
Effect of Diet-Induced NASH on Bile Flow and Biliary Bile Acid Concentrations.
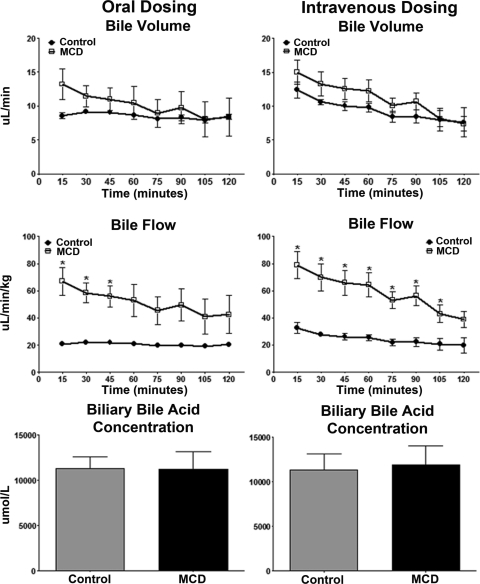
Bile volume and flow rate throughout the 120-min experiment were calculated assuming a specific gravity of 1.0; results are shown in Fig. 7. Regardless of dosing, bile volume was unaltered in MCD animals. The bile flow rate, normalized to body weight, was elevated in MCD animals. Bile acid concentrations in bile samples of control and MCD rats were determined spectrophotometrically by the enzyme cycling method using a Diazyme Total Bile Acids Assay Kit. This analysis was performed to determine the functionality of bile acid excretion processes in the liver. Regardless of dosing method, total bile acid levels in bile were unaltered between diet groups.
Fig. 7.
Effect of experimental NASH on bile volume, bile flow, and bile acid excretion. The experimental and analytical conditions were the same as those described for Fig. 3. Bile volume, bile flow, and biliary bile acid concentrations are shown. After EZE dosing, bile was collected at 15-min intervals over a 120-min period. Bile volume and bile flow were calculated assuming a specific gravity of 1.0, and the data are expressed as microliters per minute and microliters per minute per kilogram, respectively, in control (▴) and MCD (□) rodents. Bile acid concentrations were determined spectrophotometrically with a Diazyme Total Bile Acids Assay Kit and are expressed as micromoles per liter. Data are presented as means ± S.E.M. *, significant difference from control for each time point with a significance level of p ≤ 0.05.
Effect of Diet-Induced NASH on Intestinal Ugt1a1 Expression.
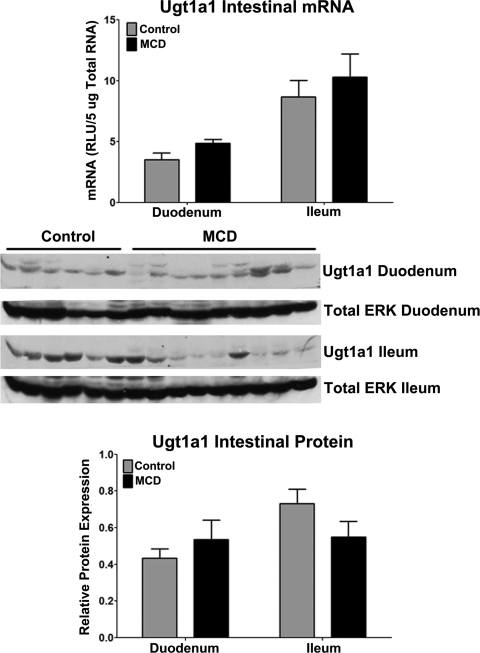
mRNA expression of Ugt1a1 in control and MCD duodenum and ileum is shown in Fig. 8. This analysis was conducted to determine whether disruption of EZE metabolism in the gut of orally dosed animals underlies the effect of NASH on EZE disposition. However, no significant alterations in Ugt1a1 transcriptional regulation were detected in rodent intestine. Immunoblots and densitometric results of relative Ugt1a1 protein levels are shown in Fig. 8. Similar to Ugt1a1 mRNA, Ugt1a1 protein showed no significant alterations between control and MCD.
Fig. 8.
Intestinal Ugt1a1 expression in rodent NASH: mRNA and relative protein levels of Ugt1a1 in rats fed either a control or MCD diet for 8 weeks. mRNA levels were measured by the branched DNA assay and are expressed as relative light units (RLU) per 5 μg of total RNA. Immunoblots are shown with total ERK as the control protein. Relative protein levels were determined by densitometric analysis and are expressed as relative to total ERK. Data are presented as means ± S.E.M. *, significant difference from control with a significance level of p ≤ 0.05.
Efflux Drug Transporter Localization in Diet-Induced NASH.
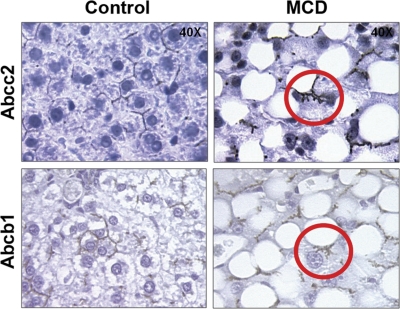
Immunohistochemical staining of Abcc2 and Abcb1 in control and MCD formalin-fixed, paraffin-embedded liver samples is shown in Fig. 9 at 40× magnification. Staining of both Abcc2 and Abcb1 in MCD livers appears to be pulling away from the canalicular membrane (Fig. 9, circled in red), suggesting that the transporters may be internalized in diet-induced NASH. Staining for both transporters appeared to be properly localized along the canalicular membrane in control livers.
Fig. 9.
Immunohistochemical staining of efflux drug transporters in diet-induced NASH. Immunohistochemical staining of ABCC2 and ABCB1 in formalin-fixed paraffin-embedded control and MCD rodent liver samples is shown at 40× magnification. Antibody binding was detected by either the MACH 3 (Abcb1) or the MACH4 method (Abcc2). Color development was performed using Betazoid DAB (Biocare Medical).
Discussion
Despite the current prevalence and projected continuation in the growth of occurrences of NAFLD, little information is available concerning the expression or function of drug-metabolizing enzymes and transporters in patients with NAFLD. Recent studies in our laboratory have investigated drug-metabolizing enzymes and transporters in both human samples and rodent models. These studies have included the identification of perturbations in cytochrome P450 (Fisher et al., 2009b) and glutathione transferase (Hardwick et al., 2010) enzyme expression and functionality in a population of human steatosis and NASH samples. In addition, alterations in the efflux of acetaminophen (Lickteig et al., 2007) and uptake of bromosulfophthalein (Fisher et al., 2009a) have been investigated in rodent models of NAFLD. However, information concerning the mechanisms behind these alterations in drug disposition and, more importantly, how they may manifest clinically in the human disease is lacking. Nonetheless, it can be hypothesized that NAFLD has significant potential to alter the absorption, distribution, metabolism, and elimination of several pharmaceutical agents. Because of the pervasiveness of NAFLD within the general population and the propensity for these patients to be medicated for multiple symptoms of the metabolic syndrome, knowledge of the effect of NAFLD on absorption, distribution, metabolism, and elimination could be valuable in identifying patients at risk for adverse drug reactions.
In the current study, we have demonstrated that the MCD diet rodent model of NASH causes a significant increase in the amount of the pharmacologically active metabolite EZE-GLUC excreted into sinusoidal blood and away from its target site. However, because of the inherent characteristics of the MCD model, NASH rodents presented with significantly lower total body weights before the initiation of disposition experiments. Because of the reduction in total body weight characteristic of the model, animals were dosed on the basis of body weight. On examination of the parent drug, EZE, in the plasma of intravenously dosed animals, it appears that overall drug exposure is not significantly different between control and NASH rodents, leading us to conclude that the observed changes in body weight most likely have little effect on the observed alterations in drug disposition. In contrast, specific alterations in exposure to the metabolite, EZE-GLUC, were observed in NASH rodents, and we have proposed a possible mechanism for this observation. In general, elevated plasma efflux of a drug results in increased systemic exposure to the drug in the form of retention within the systemic circulation. This could have profound effects on toxicity in extrahepatic tissues such as the kidney. However, for EZE, increased efflux of EZE-GLUC into sinusoidal blood, as seen in NASH rodents, and diminished efflux into bile would mean that less drug is being delivered to the site of action in the small intestine. This could have implications for EZE efficacy and could possibly play a role in selection of the most appropriate therapeutic option for patients with NASH.
The plasma efflux of EZE-GLUC is similar to that of acetaminophen-glucuronide in MCD animals as demonstrated by Lickteig et al. (2007). In particular, acetaminophen-glucuronide excretion in bile was diminished in MCD animals, and plasma efflux was significantly increased. Evidence from Lickteig et al. (2007) and the current study suggests that changes in disposition of glucuronide metabolites of additional pharmaceutical agents is likely to occur in patients with NASH. The conclusion of Lickteig et al. (2007) that increased plasma efflux of drug in the MCD model could be due to the combination of increased expression and affinity for Abcc3 is certainly plausible in the current study. de Waart et al. (2009) conducted inhibition experiments in membrane vesicles containing either Abcc3 or Abcc2 and discovered that EZE-GLUC is able to inhibit the transport of estradiol-17β-glucuronide more efficiently for Abcc3 than for Abcc2. Furthermore, studies have shown that Abcc3 preferentially transports glucuronide metabolites, and there is evidence for higher affinity over that for Abcc2. Chu et al. (2004) have identified ethinylestradiol glucuronide as a higher affinity substrate for ABCC3 than ABCC2. Further evidence implicating Abcc3 as the major transporter of glucuronide conjugates stems from studies in Abcc3 knockout mice, which exhibit significant hepatic retention of acetaminophen-glucuronide compared with wild-type animals without alterations to Abcc2 protein levels (Manautou et al., 2005). Thus, the increased expression of Abcc3 in MCD rodents and preferential affinity for Abcc3 may help to explain, at least in part, the elevation in plasma efflux of EZE-GLUC.
Further evidence supporting the conclusion that NASH may cause a shift in the disposition profile of clinically relevant drugs is seen in the urinary excretion of total EZE and EZE. Under normal physiological conditions, the majority of EZE is excreted via feces as parent drug because of the hydrolysis of EZE-GLUC after excretion into bile (Kosoglou et al., 2005). MCD animals exhibited higher concentrations of both total EZE and EZE in the urine than controls. This finding is similar to results shown in Abcc2-deficient rats in which increased serum concentrations of EZE-GLUC resulted in increased renal excretion and decreased fecal excretion of EZE and EZE-GLUC (Oswald et al., 2006b), indicating that the shift in the hepatic elimination of EZE from bile to plasma can have a significant influence on drug efficacy.
It is interesting to note that in the current study, diminished biliary concentrations of total EZE and EZE-GLUC were observed in MCD animals. However, these results did not reach significance. Analysis of bile volume revealed no significant differences between control and MCD animals. However, the bile flow rate, which is a calculation of bile volume normalized to body weight, was elevated in MCD animals. This elevation in bile flow is reflective of the well documented reduction in body weight that occurs with the MCD diet (Fan et al., 2009; Schattenberg and Galle, 2010). In addition, bile acid concentrations were not altered. These data suggest that diminishment of biliary drug excretion is not simply due to cholestatic conditions and that, instead, a more specific mechanism may be responsible. Immunohistochemical staining of Abcc2 and Abcb1, both of which play a major role in the biliary excretion of EZE-GLUC and its repeated delivery to the site of action, revealed a unique mechanism of transport regulation. In the livers of MCD rodents, cellular localization of both Abcc2 and Abcb1 may be internalized away from the canalicular membrane, whereas localization of Abcg2 (an additional biliary transporter) remains unchanged (data not shown). Disrupted localization of specific transporters would make them unavailable for successful transport of drugs and their metabolites in bile, despite an induction of protein levels. Blocking of biliary transport by way of altered localization of efflux drug transporters could, in conjunction with increased expression of Abcc3 on the sinusoidal membrane, drive the shift from biliary to plasma efflux. Likewise, Mottino et al. (2002, 2005) have shown that altered localization of Abcc2 during estradiol-17β-glucuronide-induced cholestasis results in reduction of the biliary concentration of Abcc2 substrates. Zhang et al. (2005) observed a similar phenomenon in sandwich-cultured rat hepatocytes. The biliary excretion of 5-(6)-carboxy-2′,7′-dichlorofluorescein was diminished when Abcc2 was internalized. Of particular importance in the current study is the possible internalization of not just one, but two, efflux drug transporters on the canalicular membrane. Although brightfield immunohistochemical staining suggests that localization of these transporters indeed appears to be disrupted in MCD livers, further investigation by confocal microscopy has been limited because of severe autofluorescence in the livers of MCD animals. However, several experiments have shown that internalization of Abcc2 alone can significantly disrupt biliary drug efflux and that altered cellular localization of both Abcc2 and Abcb1 could have confounding effects on biliary excretion in NASH. In addition, the level of bile acids observed in the bile of control and MCD rodents indicates that bile acid secretion is intact in this disease model. This finding supports the conclusion that the alterations we have discovered in EZE disposition are probably due to expression and localization changes in specific transporters responsible for EZE disposition rather than to a general cholestatic phenomenon.
An additional explanation for the observed results with biliary excretion of EZE in MCD animals arises from studies in knockout animals. de Waart et al. (2009) have revealed a very complex interplay of efflux transporters in the disposition of EZE. Biliary excretion of EZE in Abcg2 (Bcrp) knockout mice revealed no significant alterations compared with those in wild-type mice 2 h after dosing. As an alternative, Abcc2 knockout and Abcc2/Abcg2 double knockout mice exhibited a reduction in biliary excretion of EZE to 56 and 2.5% of controls, respectively (de Waart et al., 2009). This indicates that although Abcg2 is not a major transporter of EZE-GLUC under normal circumstances, it may be capable of partially compensating for the loss of Abcc2 and, as observed in the current study, for Abcb1 as well. Although expression of Abcg2 was not evaluated in the current study, Lickteig et al., 2007 found an elevation of Abcg2 protein in the MCD diet rodent model of NASH, thus lending support to our observations that the discrepancy in EZE biliary excretion in NASH may be due to multiple overlapping substrate specificities as well as to disruption in cellular localization of Abcc2 and Abcb1.
To further demonstrate the role of hepatic transporters and rule out a change in metabolism in the disposition of EZE, we examined expression of Ugt1a1 in the intestine and liver. Potential alterations of metabolism in the gut of orally dosed animals could confound the disposition results acquired in the study. Likewise, changes in hepatic metabolism of intravenously dosed animals would diminish our ability to determine the effect of the liver on alterations of disposition in NASH. However, no significant alterations in Ugt1a1 at the mRNA or protein level were observed in the liver or intestine of MCD animals, indicating that the alterations in EZE-GLUC plasma levels in MCD animals is not due to metabolism. In addition, previous studies in our laboratory identified a reduction in uptake transport function in MCD animals (Fisher et al., 2009a). We determined concentrations of EZE, EZE-GLUC, and total EZE in hepatic tissue of control and MCD animals to identify whether NASH affects uptake of EZE into hepatocytes. No significant changes in drug concentration within the hepatic tissue of MCD animals was observed, indicating that entry of drug into hepatocytes was not a confounding factor in the measured elevations of plasma drug concentrations in NASH.
In conclusion, the combination of altered cellular localization of the biliary efflux drug transporters Abcc2 and Abcb1 and the induction of the higher affinity sinusoidal efflux drug transporter, Abcc3, in rodent NASH drives a shift from primarily biliary efflux of EZE-GLUC to increased plasma concentrations and elevated urinary excretion. This plasma retention of drugs may have an implication for therapeutic efficacy and the potential risk of adverse drug reactions for many pharmaceuticals administered to patients with NASH.
Acknowledgments
We thank Parijat Jain of the University of Arizona Department of Pharmaceutical Sciences for his assistance in the intravenous formulation of EZE. In addition, we extend our sincere appreciation to Drs. Leif Abrell and Samanthi Wickramesekara (Arizona Laboratory for Emerging Contaminants) for their assistance in LC-MS/MS experiments.
This work was supported by the National Institutes of Health National Institute of Diabetes and Digestive and Kidney Diseases [Grant DK068039]; the National Institutes of Health National Institute of Environmental Health Sciences [Grant ES006694]; the National Institutes of Health National Center for Complementary and Alternative Medicine [Grant AT002842]; and the National Institutes of Health Eunice Kennedy Shriver National Institute of Child Health and Human Development [Grant HD062489]. The Liver Tissue Cell Distribution System was sponsored by the National Institutes of Health [Contract N01-DK70004/HHSN267200700004C].
Article, publication date, and citation information can be found at http://dmd.aspetjournals.org.
- NAFLD
- nonalcoholic fatty liver disease
- NASH
- nonalcoholic steatohepatitis
- EZE
- ezetimibe
- NPC1L1
- Niemann-Pick C1-like 1
- EZE-GLUC
- ezetimibe glucuronide
- ABC
- ATP-binding cassette
- MCD
- methionine and choline deficient
- HPLC
- high-performance liquid chromatography
- LC
- liquid chromatography
- MS/MS
- tandem mass spectrometry
- Mdr
- multidrug resistance
- Ugt
- UDP glucuronosyltransferase
- ERK
- extracellular signal-regulated kinase.
Authorship Contributions
Participated in research design: Hardwick, Fisher, and Cherrington.
Conducted experiments: Hardwick, Fisher, Street, and Canet.
Performed data analysis: Hardwick and Cherrington.
Wrote or contributed to the writing of the manuscript: Hardwick and Cherrington.
References
- Adams LA, Angulo P. (2005) Recent concepts in non-alcoholic fatty liver disease. Diabetic Med 22:1129–1133 [DOI] [PubMed] [Google Scholar]
- Ali R, Cusi K. (2009) New diagnostic and treatment approaches in non-alcoholic fatty liver disease (NAFLD). Ann Med 41:265–278 [DOI] [PubMed] [Google Scholar]
- Brady JM, Cherrington NJ, Hartley DP, Buist SC, Li N, Klaassen CD. (2002) Tissue distribution and chemical induction of multiple drug resistance genes in rats. Drug Metab Dispos 30:838–844 [DOI] [PubMed] [Google Scholar]
- Cherrington NJ, Hartley DP, Li N, Johnson DR, Klaassen CD. (2002) Organ distribution of multidrug resistance proteins 1, 2, and 3 (Mrp1, 2, and 3) mRNA and hepatic induction of Mrp3 by constitutive androstane receptor activators in rats. J Pharmacol Exp Ther 300:97–104 [DOI] [PubMed] [Google Scholar]
- Chu XY, Huskey SE, Braun MP, Sarkadi B, Evans DC, Evers R. (2004) Transport of ethinylestradiol glucuronide and ethinylestradiol sulfate by the multidrug resistance proteins MRP1, MRP2, and MRP3. J Pharmacol Exp Ther 309:156–164 [DOI] [PubMed] [Google Scholar]
- de Waart DR, Vlaming ML, Kunne C, Schinkel AH, Oude Elferink RP. (2009) Complex pharmacokinetic behavior of ezetimibe depends on Abcc2, Abcc3, and Abcg2. Drug Metab Dispos 37:1698–1702 [DOI] [PubMed] [Google Scholar]
- Fan JG. (2008) Impact of non-alcoholic fatty liver disease on accelerated metabolic complications. J Dig Dis 9:63–67 [DOI] [PubMed] [Google Scholar]
- Fan JG, Qiao L. (2009) Commonly used animal models of non-alcoholic steatohepatitis. Hepatobiliary Pancreat Dis Int 8:233–240 [PubMed] [Google Scholar]
- Fisher CD, Lickteig AJ, Augustine LM, Oude Elferink RP, Besselsen DG, Erickson RP, Cherrington NJ. (2009a) Experimental non-alcoholic fatty liver disease results in decreased hepatic uptake transporter expression and function in rats. Eur J Pharmacol 613:119–127 [DOI] [PMC free article] [PubMed] [Google Scholar]
- Fisher CD, Lickteig AJ, Augustine LM, Ranger-Moore J, Jackson JP, Ferguson SS, Cherrington NJ. (2009b) Hepatic cytochrome P450 enzyme alterations in humans with progressive stages of nonalcoholic fatty liver disease. Drug Metab Dispos 37:2087–2094 [DOI] [PMC free article] [PubMed] [Google Scholar]
- Garcia-Calvo M, Lisnock J, Bull HG, Hawes BE, Burnett DA, Braun MP, Crona JH, Davis HR, Jr, Dean DC, Detmers PA, et al. (2005) The target of ezetimibe is Niemann-Pick C1-like 1 (NPC1L1). Proc Natl Acad Sci USA 102:8132–8137 [DOI] [PMC free article] [PubMed] [Google Scholar]
- Hardwick RN, Fisher CD, Canet MJ, Lake AD, Cherrington NJ. (2010) Diversity in antioxidant response enzymes in progressive stages of human nonalcoholic fatty liver disease. Drug Metab Dispos 38:2293–2301 [DOI] [PMC free article] [PubMed] [Google Scholar]
- Institute of Laboratory Animal Resources (1996) Guide for the Care and Use of Laboratory Animals, 7th ed, Institute of Laboratory Animal Resources, Commission on Life Sciences, National Research Council, Washington DC [Google Scholar]
- Kosoglou T, Statkevich P, Johnson-Levonas AO, Paolini JF, Bergman AJ, Alton KB. (2005) Ezetimibe: a review of its metabolism, pharmacokinetics and drug interactions. Clin Pharmacokinet 4:467–494 [DOI] [PubMed] [Google Scholar]
- Lickteig AJ, Fisher CD, Augustine LM, Aleksunes LM, Besselsen DG, Slitt AL, Manautou JE, Cherrington NJ. (2007) Efflux transporter expression and acetaminophen metabolite excretion are altered in rodent models of nonalcoholic fatty liver disease. Drug Metab Dispos 35:1970–1978 [DOI] [PubMed] [Google Scholar]
- Manautou JE, de Waart DR, Kunne C, Zelcer N, Goedken M, Borst P, Elferink RO. (2005) Altered disposition of acetaminophen in mice with a disruption of the Mrp3 gene. Hepatology 42:1091–1098 [DOI] [PubMed] [Google Scholar]
- Marchesini G, Bugianesi E, Forlani G, Cerrelli F, Lenzi M, Manini R, Natale S, Vanni E, Villanova N, Melchionda N, et al. (2003) Nonalcoholic fatty liver, steatohepatitis, and the metabolic syndrome. Hepatology 37:917–923 [DOI] [PubMed] [Google Scholar]
- Marra F, Gastaldelli A, Svegliati Baroni G, Tell G, Tiribelli C. (2008) Molecular basis and mechanisms of progression of non-alcoholic steatohepatitis. Trends Mol Med 14:72–81 [DOI] [PubMed] [Google Scholar]
- McCullough AJ. (2006) Pathophysiology of nonalcoholic steatohepatitis. J Clin Gastroenterol 40:S17–S29 [DOI] [PubMed] [Google Scholar]
- Mottino AD, Cao J, Veggi LM, Crocenzi F, Roma MG, Vore M. (2002) Altered localization and activity of canalicular Mrp2 in estradiol-17β-d-glucuronide-induced cholestasis. Hepatology 35:1409–1419 [DOI] [PubMed] [Google Scholar]
- Mottino AD, Crocenzi FA, Pozzi EJ, Veggi LM, Roma MG, Vore M. (2005) Role of microtubules in estradiol-17β-d-glucuronide-induced alteration of canalicular Mrp2 localization and activity. Am J Physiol Gastrointest Liver Physiol 288:G327–G336 [DOI] [PubMed] [Google Scholar]
- Oswald S, Koll C, Siegmund W. (2007) Disposition of the cholesterol absorption inhibitor ezetimibe in mdr1a/b (−/−) mice. J Pharm Sci 96:3478–3484 [DOI] [PubMed] [Google Scholar]
- Oswald S, May K, Rosin J, Lütjohann D, Siegmund W. (2010) Synergistic influence of Abcb1 and Abcc2 on disposition and sterol lowering effects of ezetimibe in rats. J Pharm Sci 99:422–429 [DOI] [PubMed] [Google Scholar]
- Oswald S, Scheuch E, Cascorbi I, Siegmund W. (2006a) A LC-MS/MS method to quantify the novel cholesterol lowering drug ezetimibe in human serum, urine and feces in healthy subjects genotyped for SLCO1B1. J Chromatogr B Analyt Technol Biomed Life Sci 830:143–150 [DOI] [PubMed] [Google Scholar]
- Oswald S, Westrup S, Grube M, Kroemer HK, Weitschies W, Siegmund W. (2006b) Disposition and sterol-lowering effect of ezetimibe in multidrug resistance-associated protein 2-deficient rats. J Pharmacol Exp Ther 318:1293–1299 [DOI] [PubMed] [Google Scholar]
- Schattenberg JM, Galle PR. (2010) Animal models of non-alcoholic steatohepatitis: of mice and man. Dig Dis 28:247–254 [DOI] [PubMed] [Google Scholar]
- Vansell NR, Klaassen CD. (2002) Increase in rat liver UDP-glucuronosyltransferase mRNA by microsomal enzyme inducers that enhance thyroid hormone glucuronidation. Drug Metab Dispos 30:240–246 [DOI] [PubMed] [Google Scholar]
- Zhang P, Tian X, Chandra P, Brouwer KL. (2005) Role of glycosylation in trafficking of Mrp2 in sandwich-cultured rat hepatocytes. Mol Pharmacol 67:1334–1341 [DOI] [PubMed] [Google Scholar]


