Abstract
The effect of higher order modes in fiber bundle imager-based optical coherence tomography (OCT) has been theoretically modeled using coupled fiber mode analysis ignoring the polarization and core size variation in order to visualize the pure effect of multimodal coupling of the imaging bundle. In this model, the optical imaging fiber couples several higher order modes in addition to the fundamental one due to its high numerical aperture for achieving light confinement to the single core pixel. Those modes become evident in a distance domain using A-mode (depth) OCT based on a mirror sample experiment where multiple peaks are generated by the spatial convolution and coherence function of the light source. The distance between the peaks corresponding to each mode can be estimated by considering the effective indices of coupled (guided) modes obtained from numerically solving the fiber mode characteristics equations and the fiber length. The results have been compared for various types (fiber dimensions and wavelengths) and lengths of fibers, which have mode separation of 715 μm (1404 μm) and 764 μm (1527 μm) for the measurement and analysis, respectively in a 152.5 mm (305 mm)-long imaging fiber.
1 Introduction
Imaging fiber bundles have been extensively used in various fields of optical imaging techniques such as confocal microscopy [1, 2], two-photon microscopy [3], as well as fluorescence [4] and coherence imaging [5]. Due to their inherent features, it is possible to achieve an effective high resolution endoscopic imaging determined by the overall structural dimension of itself and the total number of the fiber cores/pixels at the object/sample [6, 7]. Utilizing fiber bundle for optical coherence tomography (OCT) [8, 9] has eliminated the need of a scanning mechanism in front of the specimen [10, 11] so that it is possible not only to miniaturize the probe design [12, 13] but also to accommodate imaging of the moving or live biological samples less invasively [14]. The real (mechanical) lateral scanning, in sensitive environments such as neuro- or ophthalmic applications, can be performed at the proximal end of the fiber, i.e., outside of the tissue/organ. This requires a delicate optical coupling to each fiber pixel which can be smaller in diameter than the typical single core fiber. In particular, with respect to OCT, fiber bundle imagers have recently been suggested owing to their merits for use in a variety of applications for micro-/ neuro-structural or biological sample imaging. However the results have not been promising due to the coupling light into the single core and the non-uniformity of the fiber array [15, 16].
This coherent fiber bundle imager exhibits a spatial correlation between the input and the output of the fiber bundle such that an image can be transmitted through the fiber from one end of the fiber bundle to the other. The main difference between the fiber bundle imager and an array of individual normal step index fibers is that individual fiber core in a fiber bundle imager shares a common background cladding rather than having a separate cladding region. It also has a relatively higher numerical aperture (NA) or index contrast in order to tightly confine the light and reduce the inter-core crosstalk. Previously, in-depth analyses over fiber bundles have been performed based on the fiber dimensions (core size, core spacing, fiber length) and optical parameters (refractive indices, NA) using both experimental and numerical/theoretical methods to thoroughly characterize the properties of the imaging fiber itself such as cross-talk (or core-to-core coupling) in light propagation and its effect on the image results [17–19]. There also has been an important observation of multimodal coupling effect in OCT based on the fiber bundle imager by Xie et al. [20] which correlated the fiber characteristics to the acquired image result showing successive ghost images.
If the multimodal effect occurs in an imaging fiber optic probe, this can deteriorate the OCT depth profile (A-scan) because the fiber couples unwanted multiple peaks because of the convolution and coherence function of the light source by higher order modes in addition to the fundamental one. In this case, the point spread function (PSF) is formed as a simple independent summation of delayed versions of all possible fiber modes where the individual coherence peak has a source spectrum limited resolution. Thus, for fibers with very large normalized frequencies (V parameter), possible higher order modes can influence within the width of the PSF or separate closely to each other to generate a new broader PSF-like response in the A-mode OCT. Practically, in higher order modes, degradations of the spatial coherence and light intensity would simultaneously occur to reduce the interference signal and increase background noise due to multiple reflections. However, the mentioned previous results from Ref. [20] did not provide detailed numerical explanation of the separation of ghost images due to the higher order modes from the fundamental one. In the current work, therefore, we have analytically explained the effect of multimodal coupling in the imaging fiber bundle for various kinds of typical fibers on the images from OCT.
2 Modeling and Experiment
In our analytical model, we disregarded the effect of the variations of core radius, cross-talks between adjacent fibers, and polarizations so that optical fibers could be simply viewed as slab waveguides with cylindrical coordinates where the waves were trapped in the core of the fiber by total internal reflection at the core-cladding layer interface. In fact, there are specific ways that the waves travel in optical fiber, referred as modes of the waveguide, as unique transverse field patterns. Therefore, we were able to estimate the effect of multimodal coupling in a single core fiber on OCT imaging (A-mode) based on the fiber bundle imager even though there could have been a fraction of minor errors not including structural deviations, polarization changes by bending, and cross-talk in the real fiber bundle imager. The normalized frequency V was defined as,
| (1) |
where, a was the core radius, λ the free space wavelength, and n1 and n2 the refractive indices of the core and cladding, respectively.
For the modeling and experiment of the imaging fiber, we introduced a couple of different types of imaging bundle fibers. As shown in Table 1, types I and II (Edmund Optics: NT53-846 and NT53-840, respectively) which were both rigid conduit fibers and had the same total diameter (3.2 mm) and length (76.2 mm) but with different core sizes (50 μm and 12μm) and slightly different numerical apertures (NA) approximately 0.53~0.55. Type III fiber (Fujikura: FIGH-10-500N, distributed by Myriad Fiber Imaging Tech) was flexible (minimum bending radius: 25 mm) with a length of 30.5 cm and a total diameter of 0.5 mm (image circle diameter: 460 ± 25 μm). It had a smaller NA (0.39) and core spacing (4.5 μm) than types I and II. The image fiber was coated by silicone resin for protection (thickness: 100 ± 10 μm).
Table 1.
Types of fiber bundle optical imager and their parameters.
| Types | Type I | Type II | Type III |
|---|---|---|---|
| Parameters | |||
| Length (cm) | 7.6 | 7.6 | 30.5 |
| Size (total diameter) (mm) | 3.2 | 3.2 | 0.5 |
| Number of fibers | ~3,012 | ~50,419 | ~10,000 |
| Core spacing (size) (μm) | ~50 (43) | ~12 (9) | ~4.5 (2.9) |
| NA | 0.53 | 0.55 | 0.39 |
| ncore | 1.58 | 1.58 | 1.50 |
| ncladding | 1.49 | 1.48 | 1.446 |
Representative images showing type I (50μm core spacing) and III (4.5 μm core spacing) fiber bundles have been provided in Fig. 1(a) and 1(b), respectively. We observed that the fiber pixels were arranged in an irregular grid rather than a strict regular relay and also that the shape of individual fibers varied from a perfectly circular fiber (uncircularity < 5%) - especially significant for flexible bundled fiber (estimated variation based on elliptical fitting to each core: 10 ~ 15 % [21]). Damaged and contaminated fibers that could have influenced the imaging results were also clearly observable which depended on the fabrication process and the handling (lattice defect < 0.1 %). The structural dimensions of the fiber pixels were measured where the radius is 1.47 ± 0.08 μm and the pixel separation was 4.56 ± 0.28 μm, which closely matched the original fiber design (1.45 μm and 4.50μm).
Fig. 1.
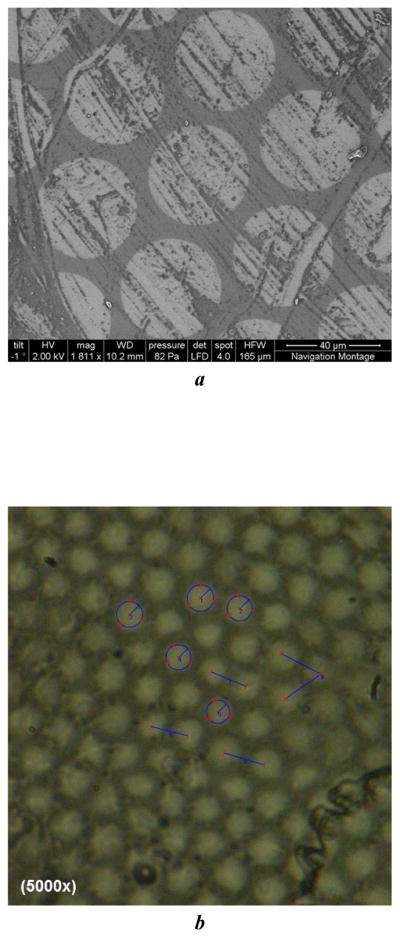
Sample fiber bundle images: (a) Scanning Electron Microscope (SEM) images for type I fiber bundle (core spacing: 50μm); (b) Digital microscope image for type III fiber bundle (core spacing: 4.5μm).
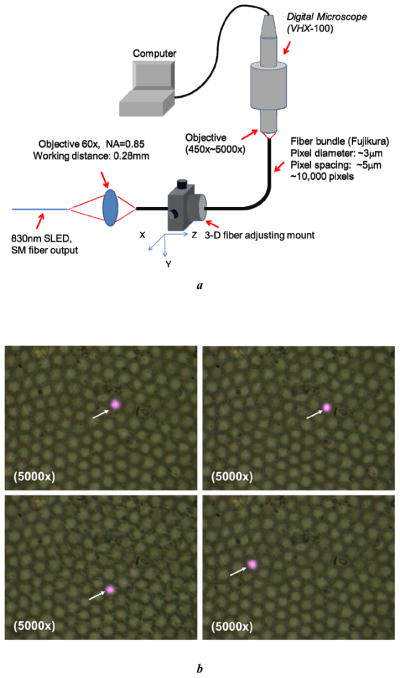
Using the setup detailed in Fig. 2(a) with a 0.8 μm broadband source (SLD) to mimic the OCT setup instead of employing a single longitudinal mode source, it was possible to selectively couple the beam into a single pixel as shown in Fig. 2(b) (colored spots marked with arrows) where a high-resolution digital microscope (450× ~ 5000×) was utilized to examine the type III fiber bundle, which has been shown in Fig. 1(b). The transmitted beam can deviate depending on the characteristics of each coupled fiber pixel. In the setup in Fig. 2(a), the beam waist was carefully formed using various objectives (magnification and numerical aperture) and the beam position was precisely controlled by introducing a 3-D adjustable fiber mount. Here, all the components were stabilized using a single piece (stage) of fiber mount. Thus, it was possible to efficiently select the position of coupled fiber by moving the entrance side of the fiber bundle. A fiber feed-through was placed to be directed to the digital microscope and later to the beam profiler for the measurement. The inter-core coupling due to the narrow pitch between cores and the polarizations in the flexible fiber influenced the overall beam coupling and the image performance.
Fig. 2.
Setup for fiber bundle characterization test: (a) setup for beam coupling to the single core of fiber bundle imager; (b) sampled results of digital microscope image (Selective beam coupling into single fiber core).
A schematic view of the CPOCT system with an optical fiber bundle probe has been illustrated in Fig. 3 [9]. The OCT system was comprised of a low coherence super luminescence diode (SLD), a 2×1 fiber directional coupler, and a spectrometer. A broadband light source with 5 mW output and a high-resolution spectrometer were used to obtain signal spectrum which was subsequently processed for the depth imaging. A customer configured CCD (charge coupled device)-based spectrometer had a minimum integration time of 3.8 ms, corresponding to an acquisition speed (maximum line scan rate) of 260 Hz. Each CCD pixel was digitized at 1 MHz and the total number of pixels was 3648. The fiber coupler was used to route the SLD output to an X/Y scanner which was used to scan the beam across the proximal entrance of the fiber bundle. Thus, there were no moving parts nor driving/motorized means at the specimen site because the true scanning mechanism was placed at the proximal fiber bundle entrance resulting in a compact imaging probe that could be integrated with medical catheters. One of the outputs from the fiber coupler was placed at the proximal input of the fiber bundle and was attached to the X/Y scanner for the transverse 2-D scanning. A microscope objective was used to couple the light from the coupler into each fiber pixel.
Fig. 3.
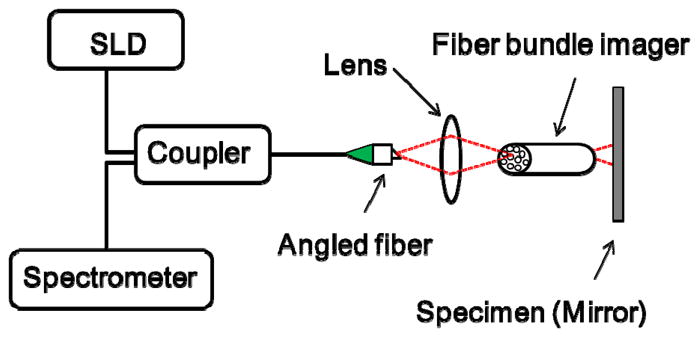
Experimental setup for optical coherence tomography with a fiber bundle imager.
Considering the single fiber dimension to be a perfect circle, refractive indices of core and cladding, and the operating wavelengths, the employed fiber bundles accommodated numerous linearly polarized higher-order multimodes (LP11, LP21, LP02, …) as well as a fundamental mode (LP01 or HE11) based on their normalized frequencies (V). The results have been summarized in Table 2, categorized by the common operating wavelengths used in OCT (either 1.3μm or 0.8μm). In order to calculate the effective refractive indices of all possible coupled fiber modes and their corresponding fields based on the above basic assumptions and parameters in the tables, we used the following characteristic equation for the optical fibers with a perfect circular core and a step index profile waveguide which was written as [22]
Table 2.
Normalized frequencies (V) of fiber bundles.
| Types | Type I | Type II | Type III |
|---|---|---|---|
| Wavelengths | |||
| 0.8-μm | V = 88.76 | V = 19.55 | V = 4.54 |
| 1.3-μm | V = 54.62 | V = 12.03 | V = 2.79 |
| (2) |
where, Jv (·) and Kv (·) were the Bessel function of the first kind and modified Bessel function of the second kind of order v, respectively, and the apostrophe (′) indicated the differentiation with respect to the argument of the Bessel or modified Bessel functions, i.e., . The two unknown variables and not only satisfied the above Eq. (1) for the boundary condition at the core-cladding boundary but also had to satisfy,
| (3) |
where, V was the normalized frequency previously defined in Eq. (1).
By numerically solving the Eqs. (1), (2) and (3), we obtained the solution for LPvm mode, whose effective refractive index neff _ vm could be expressed as,
| (4) |
where, k0 was the propagation constant in free space and βvm was the longitudinal propagation factor for mode LPvm.
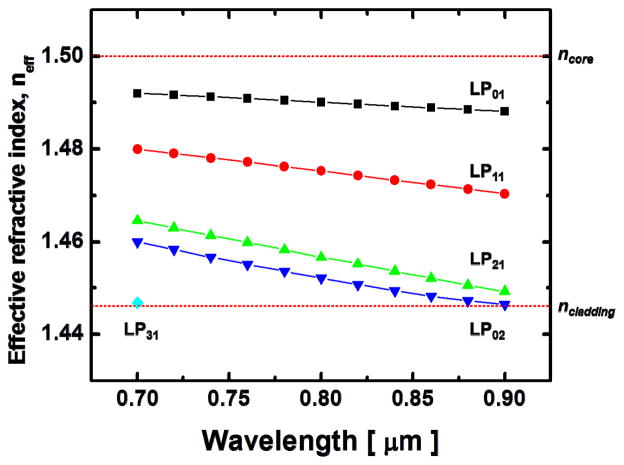
For instance, the dependence of wavelength on the coupled fiber modes and their corresponding effective refractive indices was plotted in Fig. 4 for type III fiber bundle (core diameter 2a = 2.9 μm; n1 = 1.500; n2 = 1.446) in 0.7 μm ~ 0.9 μm region (There were fewer modes for 1.3 μm region due to the reduced V value in the same fiber dimension). In this case, there were only four possible modes (LP01, LP11, LP21, LP02) for most of the wavelength range based on the fiber parameters listed on Tables 1 and 2 except the fifth mode (LP31) which could be generated at shorter wavelength below 0.7 μm due to the increased V parameter as shown in Fig. 4. As expected, the lower order mode showed a refractive index closer to that of the core, and the higher order mode had a refractive index closer to that of the cladding of the fiber. In addition, the coupled axial (z-axis) propagating field of mode LPvm could be written as,
Fig. 4.
Guided (coupled) effective refractive indices of fiber modes in an imaging bundle (in case of type III fiber).
| (5) |
Thus, the total field and the intensity of beam was obtained as,
| (6) |
| (7) |
The regular step index single mode fiber (SMF) at 0.8 μm showed a perfect circular or Gaussian shape beam profile as in Fig. 5(a) for v = 0, m = 1, which contained only the fundamental mode (LP01). However for a-few-mode fiber including other modes such as LP11, LP21, LP02, the perfect circular shape was modified due to these higher order modes included in Eqs. (6) and (7). The analysis result for the used fiber in Fig. 4 at z = 0 (λ = 0.8 μm) has been shown in Fig. 5(b) and the measured mode intensity profile in Fig. 5(c), where the results were comparable to each other. The measurement were simply taken by 2-D profiling the output beam with the infrared CCD camera (Ophir, model: BeamStar FX) at the end of the used fiber based on the setup in Fig. 2(a) instead of using the digital microscope. Because of the higher order modes, the beam profile changed to an ellipsoidal shape from a circular one with only fundamental mode and during the measurement in Fig. 5(c) a background noise was observable due to the cladding mode in a short step index single core fiber. In the figures, intensity changed from dark red (circle center with high intensity) to dark blue (low circle boundary with low intensity). Here, the exact traditional degenerated modes solved from circular waveguides without employing weakly guided approximation such as HE21, TE01, TM01 could be grouped as LP11 because the propagation constants were almost identical or too small to be separated during the propagation in the short fiber bundle for OCT imaging.
Fig. 5.

Beam profiles of fiber modes: (a) measured result for a single mode fiber (mode includes: LP01); (b) simulations result for a few-mode fiber (dimension: 2a × 2a where a is core radius, modes include LP01, LP11, LP21, and LP02); (c) measured result for a few-mode fiber (LP01, LP11, LP21, LP02). Note: Intensity changes from dark red (circle center with high intensity) to dark blue (low circle boundary with low intensity) and white means highest saturated intensity and purple the lowest intensity of background.
3 Results and Discussion
For various types of introduced fiber bundles using the analysis of the effective index shown in Fig. 4 as an example, the relationship between the propagating fiber length and mode separation between the fundamental and higher order modes in the fiber was expressed as,
| (8) |
where, ΔL was the delay between two adjacent modes, L was the fiber length, and Δn was the difference in effective refractive indices between the fundamental (LP01) and higher order modes (LPvm, v ≠ 1, m ≠ 0). Here, the spectrometer acquisition or accumulation time had to be long enough to collect all the delayed multimode signals. In other words, the corresponding mode separation that generated the ghost images in OCT due to the higher-order modes could be explained by considering the total length of the propagating optical fiber and the differences in effective indices between the fundamental and other higher order ones numerically obtained from the coupled mode characteristic equation assuming step index profile and perfect circular core [22]. This analysis provides a simple and straight forward method for resolving the ghost images in OCT when using an imaging fiber bundle having a multimodal coupling in the fiber.
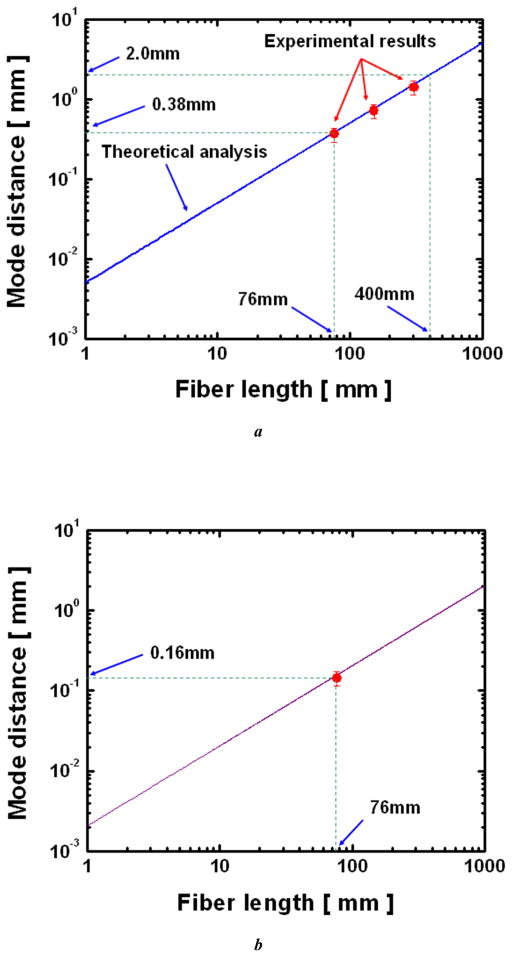
Based on the analyses in Ch. 2 (basically, we had to obtain results from Eq. (4)), Fig. 6(a) shows the result for type II fiber bundle at 1.3μm where a comparison was provided for the estimated analytical (solid straight line) and experimental results (circles with error bars) obtained from Ref. [20] using a mirror sample for different fiber lengths. The analysis was based on the model described in the previous chapter where the mode image distance was estimated by the effective refractive index difference and fiber length (Eq. (8)). Thus, the separation from the true mirror image line owing to the fundamental mode and the ghost images due to the next higher order modes linearly increased as the fiber became longer. We measured the distances from the mirror to the redundant higher-order ghost images using the intensity-based 2D image results. In this case, the additional ghost peaks due to the higher order modes appeared throughout the A-mode result from the convolution to each corresponding mode (A-mode range of ~2 mm for FD-OCT) for the used fiber bundles. The mode separations for 152.5 mm-(or 0.5-ft) and 305 mm-(or 1-ft) long fibers were measured (estimated value) to be 0.715 (0.764) mm and 1.404 (1.527) mm, respectively. Because the intensity-based M-mode image result was not exactly the same as the clear A-mode result (The depth image itself has a width so that there are center, upper and lower edges) given in Ref. [20], the error bars occurred when choosing the distances for the minimum, average, and maximum values from the given gray-scale image result. The widths of the ghost lines in the M-mode result based on A-scan of the mirror sample were broadened due to the degenerated modes for LP11 (i.e., HE21, TE01, TM01) and LP21 (i.e., HE31, EH11). As predicted, these observed ghost images were produced by other higher order modes separated in distance by the image from the fundamental mode. As the fiber length increased, the distance of ghost images get larger and the intensity becomes weaker so that only ghost image by LP11 mode could be detected for 305 mm-long fiber. If the fiber length became more than 400mm the mode separation was out of the display range (~2 mm) so that there were no ghost images on the result. This also could be overcome by using smaller V-parameter fibers by controlling fiber dimension at the same wavelength to have greater differences between effective indices in the coupled modes in order to avoid a multimodal effect where the unwanted peaks which were arrays of mirror surface due to the higher order modes appeared out of the range of the longitudinal scan. The shortcoming of this approach was that the overall beam coupling to this narrow fiber structure became extremely delicate in a practical system having just a few micrometers or less in fiber core diameter.
Fig. 6.
Mode separation in OCT vs. fiber length for type II imaging bundle for different operating wavelengths: (a) λ = 1.3μm; (b) λ = 0.8 μm.
Alternatively, when using a shorter 0.8 μm wavelength with the same fiber (type II) and the experimental setup in Fig. 2(b) (in this experiment, however, we had to replace all other interconnecting optical fibers with SMF for 0.8 μm not for the 1.3 μm fibers as in the previous case in Fig. 6(a)), the undesired peak due to LP11 mode was also predicted to be detected in OCT even for 1 m-long (see end point at 1000 mm in Fig. 6(b)) fibers having a 2 mm gap as in Fig. 6(b). Due to the decreased effective refractive index difference, the overall gap between the first two modes (LP01, LP11) became smaller (0.38 mm for 1.3 μm and 0.16 mm for 0.8 μm for the same 76 mm-long fiber) because the fiber coupled increased numbers of modes for increased V-parameter at the fixed fiber dimension. The corresponding error bars were for measurement uncertainty (minimum and maximum values) while coupling the incident beam to the individual pixel core fiber.
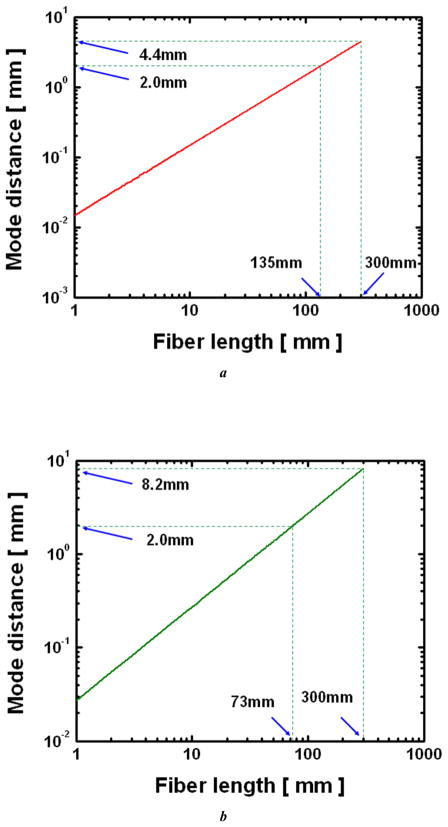
Instead, ghost images could be directly overcome or removed from the image by using smaller V-parameter fibers at the same wavelength (0.8 μm) based on the analysis in Eq. (3) by changing the dimension of the fiber. For instance, using type III fiber bundle (Table 2), the multimodal effect could be avoided in OCT results where the unwanted peak by convolution of higher order mode appeared out of the range of the A-mode scans (~2 mm) with fiber bundles longer than 135 mm (Fig. 7(a)). Additionally, when a 305 mm-long fiber was used, the same specification as shown in Table 1, a clear single mode peak was achieved without higher order mode peaks at this wavelength. In the same manner using Eq. (3), a type III fiber bundle at 1.3μm (Table 2) only showed a peak due to the fundamental mode for fibers over 73 mm in length (Fig. 7(b)). We want to emphasize that, the point spread function in this case mimicked the case for a conventional single mode fiber with a coherence gate limited axial (A-mode) resolution with a clear Gaussian-line profile.
Fig. 7.
Mode separation vs. fiber length for type III imaging bundle for different operating wavelengths: (a) λ = 0.8μm; (b) λ = 1.3μm.
For an additional proof of the above analysis, a standard single mode fiber (SMF-28) for 1.3 μm was directly coupled with a 0.8 μm source in the experimental setup in Fig. 2(b), which caused the SMF-28 to become a-few-mode fiber. Instead of using a fiber bundle at the end, which would act as a multimode fiber, connecting the SMF for 1.3 μm and operating it at the shorter wavelength also effectively became a multimode fiber owing to the increased V-parameter such as that in the 0.8 μm range. Thus, various fiber lengths mimicking the multimodal effect similar with the multimode fiber bundle were accessible. Figure 8(a) shows OCT results (A-mode) with different fiber lengths where the initial length started from 43 cm and cut in shorter lengths down to 10 cm. A sample mirror was placed in front of the a-few-mode fiber probe to clearly detect the reflected peak by each convoluting mode and the in-between gaps were adjusted to avoid the overlaps in results. Here, we observe no difference in the widths of each peak. It was found that the measured mode separations between the fundamental mode (LP01) and the next closest mode (LP11) were linearly proportional to the fiber lengths as shown in Fig. 8(b). Further, the measurement variance was within the a few available data points when selecting the values for peaks in Fig. 8(a). There was also no measurable peak due to the higher order mode when a 4 m-long fiber was used. Using a longer fiber bundle, however, could significantly attenuate the optical intensities after transmission through the fiber and the system became more sensitive to the fiber polarizations which could limit the overall fiber bundle performance.
Fig. 8.
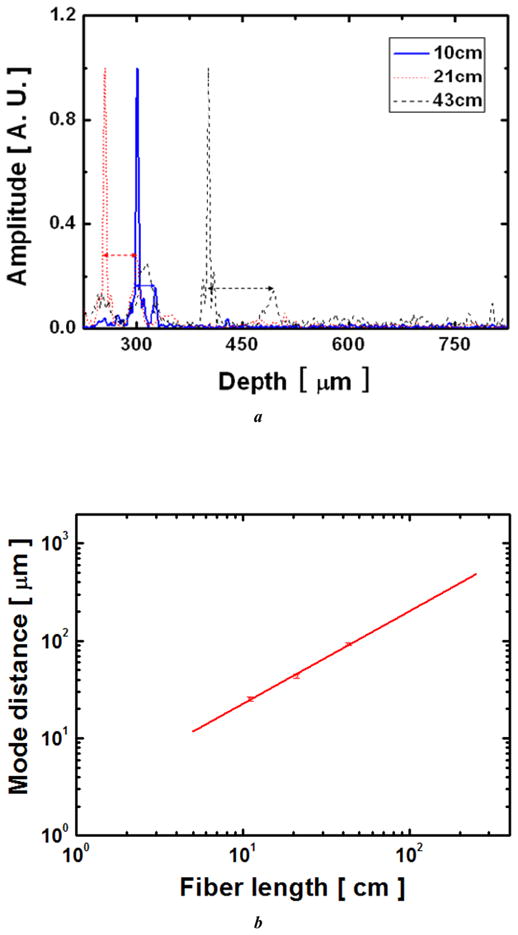
Mode separation measurement in OCT with a-few-mode fiber: (a) Measured results in A-mode OCT; (b) Mode separation in OCT vs. fiber length.
More generally and not limiting the analysis only for OCT, the effect of the core-cladding refractive index contrast on the effective mode refractive index of the fundamental mode and the next higher order mode has been numerically shown for endoscopic imaging, where the inter-core coupling depended strongly on the wavelengths and beam polarization [21]. The influence of the V-parameter (or directly wavelength) on the coupling efficiency by the optical cross-talk and the variance of core diameter has already been analyzed in Ref. [19]. Both of these approaches dealt more with the influence of microscopic variations in core sizes, index changes, and fiber arrangement and were not considered in our model. Instead, the model used in this study was based on a macroscopic variation of fiber mode coupling onto the interferometric imaging such as OCT with respect to a well-defined circular-shape fiber structure by ignoring the inter-core coupling (cross-talk) between adjacent fibers in order to treat the single fiber core as a simple multimode fiber. However, our results were also very sensitive to the fiber alignment and beam coupling as well as to the external vibration and the fiber polarization, which can further change the coupling efficiency (ratio) of each fiber mode.
4 Conclusions
In summary, coupling a light beam into a fiber bundle imager and the existence of multi-mode coupling in the fiber bundle for OCT imaging probe was analyzed based on an optic fiber mode coupling in the fiber bundle core assuming a fixed circular fiber dimension without considering the inter-core coupling (cross-talk) effect. By doing so, we were able to treat a single fiber pixel in the coherent fiber bundle imager as a normal multimode fiber. The mode separation from the fundamental one could simply be estimated by the product of the effective index difference between coupled modes and the fiber length of the imager where each peak originated from the convolution of each coupled mode in the fiber structure and the coherence characteristics of the employed light source. Thus, the ghost images in the depth-scan (A-mode) with a reflective mirror sample could be visualized due to the higher order modes in a variable length of fiber bundle imager where the experimental measurement and the theoretical result present 715 μm (1404 μm) and 764 μm (1527 μm), respectively, for fiber length of 152.5 mm (305 mm). This approach simplified the analysis of the coupled mode of the optical fiber waveguide by ignoring the fiber polarization effect and the core size variation in the fiber bundle imager.
Acknowledgments
The authors would like to thank K. Zhang and I. K. Ilev for their technical support regarding this work. This research was supported by World Class University program funded by the Ministry of Education, Science, and Technology through the National Research Foundation of Korea (R31-10008). This research was also supported in part by the Basic Science Research Program through the National Research Foundation of Korea (NRF) funded by the Ministry of Education, Science and Technology (2011-0010823). This work was supported in part by National Institute of Health (NIH) grant BRP 1R01 EB 007969-01.
References
- 1.Lane PM, Dlugan ALP, Richards-Kortum R, MacAulay CE. Opt Lett. 2000;25:1780. doi: 10.1364/ol.25.001780. [DOI] [PubMed] [Google Scholar]
- 2.Gmitro AF, Aziz D. Opt Lett. 1993;18:565. doi: 10.1364/ol.18.000565. [DOI] [PubMed] [Google Scholar]
- 3.Göbel W, Jerr JND, Nimmerjahn A, Helmchen F. Opt Lett. 2004;29:2521. doi: 10.1364/ol.29.002521. [DOI] [PubMed] [Google Scholar]
- 4.Flusberg BA, Cocker ED, Piyawattanametha W, Jung JC, Cheung ELM, Schnitzer MJ. Nature Meth. 2005;2:941. doi: 10.1038/nmeth820. [DOI] [PMC free article] [PubMed] [Google Scholar]
- 5.Pyhtila JW, Boyer JD, Chalut KJ, Wax A. Opt Lett. 2006;31:772. doi: 10.1364/ol.31.000772. [DOI] [PubMed] [Google Scholar]
- 6.Lázaro JL, Fernández PR, Gardel A, Cano AE, Luna CA. Sensors. 2009;9:8215. doi: 10.3390/s91008215. [DOI] [PMC free article] [PubMed] [Google Scholar]
- 7.Gift AD, Ma J, Haber KS, McClain BL, Den-Amotz D. J Raman Spectrosc. 1999;30:757. [Google Scholar]
- 8.Ford Helen D, Tatam Ralph P. Appl Opt. 2011;50:627–640. doi: 10.1364/AO.50.000627. [DOI] [PubMed] [Google Scholar]
- 9.Han JH, Liu X, Song CG, Kang JU. Electron Lett. 2009;45:1110. doi: 10.1049/el.2009.1627. [DOI] [PMC free article] [PubMed] [Google Scholar]
- 10.Oron D, Tal E, Silberberg Y. Opt Express. 2005;13:1468–1476. doi: 10.1364/opex.13.001468. [DOI] [PubMed] [Google Scholar]
- 11.Spitz JA, Yasukuni R, Sandeau N, Takano M, Vachon JJ, Meallet-Renault R, Pansu RB. J Microscopy. 2008;229:104. doi: 10.1111/j.1365-2818.2007.01873.x. [DOI] [PubMed] [Google Scholar]
- 12.Göbel W, Kerr JN, Nimmerjahn A, Helmchen F. Opt Lett. 2004;29:2521. doi: 10.1364/ol.29.002521. [DOI] [PubMed] [Google Scholar]
- 13.Sung KB, Liang C, Descour M, Collier T, Follen M, Richards-Kortum R. IEEE Trans Biomed Eng. 2002;49:1168. doi: 10.1109/TBME.2002.803524. [DOI] [PubMed] [Google Scholar]
- 14.Flusberg BA, Nimmerjahn A, Cocker ED, Mukamel EA, Barretto RPJ, Ko TH, Burns LD, Jung JC, Schnitzer MJ. Nature Meth. 2008;5:935. doi: 10.1038/nmeth.1256. [DOI] [PMC free article] [PubMed] [Google Scholar]
- 15.Ford HD, Tatam RP. Meas Sci Technol. 2007;18:2949. [Google Scholar]
- 16.Wang W, Zhang K, Ren Q, Kang JU. Opt Eng. 2009;48:103001. [Google Scholar]
- 17.Reichenbach KL, Xu C. Opt Express. 2007;15:2151. doi: 10.1364/oe.15.002151. [DOI] [PubMed] [Google Scholar]
- 18.Sun J, Huang Q, Gilbert JA. Appl Opt. 1995;34:1536. doi: 10.1364/AO.34.001536. [DOI] [PubMed] [Google Scholar]
- 19.Ortega-Quijano N, Fanjul-Vélez F, Arce-Diego JL. Opt Commun. 2010;283:633. [Google Scholar]
- 20.Xie T, Mukai D, Guo S, Brenner M, Chen Z. Opt Lett. 2005;30:1803. doi: 10.1364/ol.30.001803. [DOI] [PubMed] [Google Scholar]
- 21.Chen X, Reichenbach KL, Xu C. Opt Express. 2008;16:21598. doi: 10.1364/oe.16.021598. [DOI] [PubMed] [Google Scholar]
- 22.Iizuka K. Elements of Photonics: For Fiber and Integrated Optics. Johns Wiley & Sons; New York, NY: 2002. [Google Scholar]


