Abstract
Multifunctional nanomedicine holds considerable promise as the next generation of medicine that allows for targeted therapy with minimal toxicity. Most current studies on Nanoparticle (NP) drug delivery consider a Newtonian fluid with suspending NPs. However, blood is a complex biological fluid composed of deformable cells, proteins, platelets, and plasma. For blood flow in capillaries, arterioles and venules, the particulate nature of the blood needs to be considered in the delivery process. The existence of the cell-free-layer and NP-cell interaction will largely influence both the dispersion and binding rates, thus impact targeted delivery efficacy. In this paper, a particle-cell hybrid model is developed to model NP transport, dispersion, and binding dynamics in blood suspension. The motion and deformation of red blood cells is captured through the Immersed Finite Element Method. The motion and adhesion of individual NPs are tracked through Brownian adhesion dynamics. A mapping algorithm and an interaction potential function are introduced to consider the cell-particle collision. NP dispersion and binding rates are derived from the developed model under various rheology conditions. The influence of red blood cells, vascular flow rate, and particle size on NP distribution and delivery efficacy is characterized. A non-uniform NP distribution profile with higher particle concentration near the vessel wall is observed. Such distribution leads to over 50% higher particle binding rate compared to the case without RBC considered. The tumbling motion of RBCs in the core region of the capillary is found to enhance NP dispersion, with dispersion rate increases as shear rate increases. Results from this study contribute to the fundamental understanding and knowledge on how the particulate nature of blood influences NP delivery, which will provide mechanistic insights on the nanomedicine design for targeted drug delivery applications.
Keywords: particle-cell interaction, hybrid model, Brownian dynamics, NP dispersion, microcirculation, Immersed Finite Element Method, nanomedicine
I. Introduction
Nanoparticles (NPs) have been extensively studied in recent years as the next generation of drug carriers and imaging probes [1–8]. By applying nanotechnology in medicine, liposomes and polymer-drug conjugates based NPs provide various advantages over traditional drugs, such as targeted delivery, controllable release, dual imaging and therapeutic functions, etc. Several nanomedicines, such as liposome-encapsulated doxorubicin, liposomal amphotericin B, liposomal morphine have been approved by US Food and Drug Administration (FDA)[9]. Properties of NP such as size, shape and surface chemistry play an important role in NP binding and clearance. Generally, particles bigger than 200 nm are efficiently filtered by liver, spleen and bone marrow, while particles smaller than 10 nm can be quickly cleared by the kidney or though extravasation [9–11]. To achieve targeted delivery, NPs are usually coated with ligands that bind specifically to a particular type of receptor on the cell surface [12]. NP targeted delivery in a vascular system involves the interplay of transport, hydrodynamic force, and multivalent interactions with targeted biosurfaces. First, NPs are marginated from the blood stream to the vicinity of the vascular wall. The dispersion of particles in a fluid flowing through a tube can be described by the Taylor-Aris theory [13–14]. Then, the interaction of NPs with the vessel wall occurs when their minimum distance is below 20 nm [15–16]. The ligands on the NP surface bind with receptors on the vessel wall, leading to large adhesive forces. After initial binding, the NP may get firmly adhered or may be washed away, depending on the strength of binding, flow conditions, etc.
Blood is a complex biological fluid made of components such as red blood cells (RBC), monocytes, platelets, proteins, etc. When blood flows through vessels, the two-phase nature of the blood becomes important as the diameter of RBCs becomes comparable to the vessel diameter. Various unique phenomena have been observed in microcirculation due to the particulate nature of the blood, such as (a) vessel diameter dependent apparent viscosity: Fåhraeus–Lindqvist effect; (b) existence of a cell-depleted layer near the wall: cell free layer; and (c) blunt velocity profile. These phenomena have significant impact on NP targeted delivery efficiency. First, targeted binding to diseased cells requires NPs to move close to the vascular wall, i.e, in a near wall binding-layer. Such a near wall binding-layer is coincident with the cell-free layer, with the addition of NPs in such layer. However, the thickness of such cell-free layer varies with vascular conditions, thus changes the binding properties. Second, the existence of blood cells in the core region of blood streams changes the NP dispersion rate through cell-NP interaction. Due to the small size of NPs, the dynamic delivery process, and the complex vascular environment, it is very challenging to explore these phenomena experimentally in vivo. Current theoretical studies in NP therapeutic delivery are limited to an ideal Newtonian flow in a 2D channel under shear flow[17–19] without blood cells, which can't reflect the behavior of particles under microcirculation. Thus, characterization of this process for different size of NPs under different vascular flow conditions through a mathematical model is crucial for elucidating NP binding in vivo [20], particularly to understand how interactions between blood cells and NPs influence the particle motion and binding.
This paper presents for the first time, the simulation results for dynamic transportation and adhesion of widely used polymer–drug conjugates based NPs in microcirculation using Brownian adhesion dynamics method coupled with cell model through the Immersed Finite Element Method (IFEM) platform[21–24]. The NP size and concentration are chosen based on the in vivo experiment data reported in literature. In the following sections of this paper, the NP adhesion kinetics theory and modeling method are described first. Then, adhesion processes for NPs under various conditions are presented. Next, the dispersion rate and binding rate of NPs are studied with and without RBCs considered. Finally, the conclusion and future work are presented.
II. Methods
A. Nanoparticle Brownian Adhesion Dynamics
Fundamental theories of Brownian dynamics indicate that random collisions from surrounding liquid molecules impact the motion of an immersed small particle[25–27]. The influence of Brownian motion on behaviors of NPs in microfluidic channel as well as behaviors of platelets in blood flow has been studied[28–31]. For example, Mody et al.[28] used the platelet adhesive dynamics computational method to study the influence of Brownian motion of a platelet on its flow characteristics near a surface. Longest et al.[29] simulated the blood particle adhesion process in a non-parallel flow. Gentile et al.[30] studied the transport of NP in blood vessels under the effect of vessel permeability and blood rheology. Lee et al. [31] simulated a NP focusing lens in a microfluidic channel. Patankar et al. [32] proposed an algorithm for direct numerical simulation of Brownian motion by adding random disturbance in fluids. At microscale, the drag forces acting on particles such as blood cells are significantly large (> 50 pN for particle size > 1 µm), thus Brownian motion is negligible [28]. At nanoscale, Brownian force becomes a dominant force to drive NP near vascular wall surface, while the drag force acting on a NP is relatively small. For example, Shah et al.[33] used brownian dynamics to study the dynamic delivery process of nanorods and nanospheres under different shear rates. The random forces R(t) acting on a NP is responsible for Brownian motion and satisfies the fluctuation-dissipation theorem[34]:
| (1) |
| (2) |
where, δ is the unit-second order tensor, δij is the Kronecker delta, δ(t − t′) is the Dirac delta function, kBT is thermal energy of system.
The friction coefficient depends on several physical parameters, such as fluid viscosity, size and shape of the NP. The friction coefficient for spherical particles can be easily derived from Stokes’ law:
| (3) |
where μ is the fluid viscosity, d is the diameter of particle. The velocity of a particle moving under a deterministic force in a fluid with velocity Vf is given by:
| (4) |
where Vp and Vf are the particle and fluid velocity vectors, respectively; Fdet is the total deterministic force acting on the NP (including Brownian force, adhesion force, etc.):
| (5) |
where R(t) is the random force, Fad is the adhesive force from ligand-receptor bonds; Fcell-NP is cell-NP interaction force, FNP-NP is NP-NP interaction force. The detailed formulation for ligand-receptor binding can be found in our previous publication[33], cell-NP and NP-NP interaction forces are presented in Section C.
For a time step (usually ~1 µs) much greater than characteristic time constant m/βt (~10 ns), the NP moves with a terminal velocity, thus Eq. (4) reduces to:
| (6) |
Eq. (6) actually describes that the deterministic force acting on a particle is balanced by the drag force from the fluid. This is reasonable since the mass of a NP is so small that inertia effect can be neglected. This terminal velocity is then used to update the NP position in translational direction. The ratio between and Vf varies from tens to thousands, depending on whether NP is in free suspension, under collision with cells, or binding on the wall.
B. Red Blood Cell and Fluid-Structure Interaction Model
In the simulation, RBCs are modeled as flexible thin membranes enclosing a fluid [35–36], as shown in Figure 1. Both the cytoplasm inside the RBC and the blood plasma outside the RBC have a viscosity of around 0.01 dyn·s/cm, thus are treated as the same fluid. A Mooney–Rivlin strain energy function similar to that of our previous work[35–36] and others[37–39], is used to depict the material behavior of the RBC membrane:
| (7) |
with the material properties specified by constants C1 and C2. I1 and I2 are the functions of the invariants of the Cauchy-Green deformation tensor C.
Figure 1.
(A) Geometry and mesh of RBC; (B) Mesh of RBC and fluid
RBCs and their interaction with fluid flow are modeled by the IFEM formulation[35–36]. The IFEM was developed by Zhang et al. and Liu et al.[21–23, 40] to solve coupled fluid-structure interaction problems. Because much of the method has been derived in detail in works[21–23, 40], we will just briefly list out the IFEM procedures below, and refer the interested reader to those for further details. The fluid in the simulation is assumed to be an incompressible viscous fluid governed by the Navier–Stokes equations:
| (8) |
| (9) |
where vf is the fluid velocity in the fluid domain. Motivated by Peskin’s immersed boundary method [41–43], as in IFEM[40], an extra volumetric force is introduced to avoid the complex re-meshing usually encountered in the fluid-structure interaction problems. This extra force FFSI, called the fluid-structure interaction force, is defined as:
| (10) |
where v is the velocity, ρ is the density and σ is the Cauchy stress tensor. s and f donate for solid and fluid respectively.
For a Newtonian fluid of uniform viscosity, σf can be written as:
| (11) |
where μ is the fluid viscosity and pf is the hydrostatic pressure.
To interpolate between the Eulerian and Lagrangian domains, a restriction operator from Ω onto Ωs is needed to make the system complete:
| (12) |
With this mapping function, we obtain the solid velocity and displacement from the Eulerian space as:
| (13) |
| (14) |
Eq. (13) basically interpolates the solid velocity from the fluid field through a mapping function.
The coupled fluid-structure interaction equations are solved through finite element method. The weak forms of the immersed system and other details can be found in previous publication [40]. To reduce numerical oscillations, the velocity test function is employed along with stabilization parameters. Using integration by parts and the divergence theorem, the Petrov-Galerkin weak form is obtained. Then, the nonlinear system is solved using the Newton-Raphson method. Moreover, Generalized Minimum Residual (GMRES) iterative algorithm is employed to improve computation efficiency and to compute residuals based on matrix-free techniques[44].
C. Particle-Particle and Particle-Cell Interaction Model
A schematic illustration for Particle-cell interaction is given in Figure 2. The motion of NPs is governed by Brownian adhesion dynamics [7]. As described in Section B, RBCs and their interaction with fluid flow is modeled by IFEM formulation [35–36]. For NPs, a Lennard-Jones potential is introduced to characterize the interaction between individual particles.
| (15) |
| (16) |
where σ is the distance at which the energy is zero, ε is the strength of the potential energy.
Figure 2.
(A) 3D simulation of nanoparticle-RBC interaction; (B) Cross-section view of nanoparticle-RBC interaction.
A short-range repulsive Morse potential is used to avoid overlapping between NPs and RBCs:
| (17) |
| (18) |
where r0 and De stand for the zero force length and surface energy respectively, and β is a scaling factor. Similar cell-particle collision model has been used by Almomani et al. [45] to study the erythrocyte-platelet interaction in blood flow, where the collision forces were modeled as spring forces between the surfaces of the colliding particles and erythrocytes. The parameters used in the simulation model are listed in Table 1.
Table 1.
Parameters used in Lennard-Jones potential and Morse potential
| Parameter | ε | σ | De | β | r0 |
|---|---|---|---|---|---|
| Value | 10−15 J | 200.0 nm | 4.1×10⁻¹³ J | 2 µm−1 | 0.5 µm |
It should be noticed that different time steps are used to track particle motion and blood cell deformation, i.e., a smaller time step dtt for NPs and a larger time step dt for blood cell-fluid interaction, as shown in Figure 3A and 3B. The time steps are determined by the flow velocity and the particle diffusion speed. A small time step is needed to capture the high speed Brownian motion while a larger time step can be used for relatively slow RBC-fluid interaction. Similar different time steps had been used to capture the many-particle binding dynamics with a receptor coated surface by Arieh et al.[46].
Figure 3.
Illustration of the two time steps and mapping algorithms used in the simulation. (A) Overlapping happens when the same time step dt is used for both RBCs and NPs. (B) different time steps are used for RBCs (dt) and NPs (dtt) so that the overlapping is avoided. (C) Illustration of linear interpolation for RBC’s intermediate positions.
However, a few problems may arise due to the usage of varied time stepping. When NPs approach the RBCs, the shortest distance Ls between NPs and the RBCs' surface is calculated and compared with a cut-off distance Rcut defined for implementation of Morse potential. For Ls < Rcut, the Morse potential applies a repulsive force so that NPs can be repelled away. However, the particles may penetrate into the RBCs if the distance the RBCs travel per time dt is larger than Rcut which usually happens unless a very small flow velocity is applied. To resolve this problem, the time step for RBCs dt is divided into a number of equally small time step dtt, as shown in Figure 3C, and the RBC position virtual images at intermediate time intervals are interpolated by:
| (19) |
Such virtual images for RBCs are established only for cell-particle repulsive force calculation. In the simulation, Rcut is chosen as 400 nm. If the fluid velocity is 40 µm/s, to avoid particle penetration, the maximum time step is 0.01s. However, during 0.01s, NP travels 296 nm due to Brownian motion. Due to the exponential form of Morse potential and power form of Lennard-Jones potential, such big distance per time step will generate huge repulsive forces. To be safe, dtt is chosen as 0.00001s, under which NP travels around 9 nm each time step. In summary, the position of RBCs is updated based on larger time step dt while NPs positions are updated on smaller time step dtt. The collision between the RBCs and NPs are captured by RBC virtual images at intermediate steps. Such two time step algorithm will largely increase the simulation speed without losing accuracy.
D. Nanoparticle dispersion coefficient calculation
NP dispersion coefficient will be calculated under various flows conditions. The dispersion coefficient can be evaluated by tracking the motion of NPs and calculate the mean square displacements [47–49]. Since margination process is important in nanoparticle attachment to vascular wall and drug delivery, we focus on the particle dispersion in the radial direction. The mean square displacement (MSD) is defined as
| (20) |
where is the radial-coordinate of particle α from initial configuration i at time t starting from τ. N is the total number of particles, Nc is the total number of simulation runs. τ is chosen to be large enough so that there is no dependence on the initial particle distribution. Then the Overall Diffusion Coefficient (ODC) can be obtained by
| (21) |
It should be noted that NPs dispersion in blood vessel is not a free diffusion process because NPs have instantaneous collisions with the RBCs and vessel wall. In this sense, the mean square displacement defined before cannot truly reflect the distance NPs traveled at each time step. Thus to better reflect the interaction of RBCs on NP diffusion, Instantaneous Diffusion Coefficient (IDC) is defined as
| (22) |
where dtt is the small time step, DI is the Instantaneous Diffusion Coefficient, < ξ (dtt) > is the Instantaneous Mean Square Displacement (IMSD).
III. Simulation Results
Since RBCs consist of almost 50% of the blood and are dominant over all other blood cells, only RBCs and NPs are modeled in the simulation. The combined Immersed Finite Element and particle Brownian dynamics model is used to model the NPs delivery process in microcirculation.
The number of RBCs inside the simulation domain is determined by the volume ratio of RBC to blood to achieve a RBC concentration close to the hematocrit of human blood (normally in the range of 30–55% in larger arteries and drops to 10–15% in capillaries[50]). In our simulation, a number of RBCs are put into the fluid domain to reach a hematocrit of around 36%. NP size is chosen between 10~200 nm, which is the recommended range reported in literature [9–11]. PLGA-PEG-COOH NP suspension of 10 µg/µL[3] has been used to target cancer in vivo. Paclitaxel-loaded TPGS-emulsified PLGA NPs with concentration of 10 mg/mL[4] were studied both in vitro and in vivo. Antitubercular drugs loaded PLG-NP with concentration of 25 mg/2 mL [5] showed strong potential against murine tuberculosis. The concentrations mentioned above are the injection concentration. In our work, considering that NPs are diluted in blood flow during circulation, a lower concentration of 1 µg/µL is chosen as the NP concentration at the target disease site. Periodic boundary conditions are applied to the left and right side of boundaries so that RBCs and NPs exit from one end of the channel can re-enter the inlet. Based on Einstein–Stokes equation, theoretical diffusion coefficient for the NPs with a diameter of 100 nm is 2.2×10⁻⁸ cm2/s. The average flow rate in the channel is 20 µm/s, which is within physiological speed range from 10–100 µm /s for capillary vessel with diameter between 10 and 20 µm[54].
In the simulations, two independent sets of meshes are used for RBCs and fluid domain. Each Red blood cell consists of 1534 nodes and 4340 elements. The fluid mesh has 5705 nodes and 16632 elements. A time step of 0.00001 s and 0.002 s are used for the NP Brownian dynamics and RBCs-fluid interaction simulations, respectively. To clearly illustrate both NPs and RBCs, cross-sectional views are used in the simulation snapshots throughout this paper.
To explore the effect of RBCs on NP delivery, three sets of simulation setups are used: pure particles, particles mixed with RBCs to keep the total amount of particle same as pure particle case, and particles mixed with RBC to keep the same effect concentration excluding RBC volume, as shown in Figure 4. The pure particle case is used as a control. The second case is used to check the influence of RBCs on particle dispersion and binding if the same dosage of NPs is considered. The third case is used to check the influence of RBCs on particle dispersion and binding if volume exclusion effect of the RBCs is removed, thus the effective particle concentration is the same as the pure particle case. It should be noticed that NP suspension might increase the effective viscosity of blood. However, in this work, the NP volume concentration is around 0.08%, based on the results reported by Lee et.al.[55], the enhancement of NP on viscosity is less than 1% under such low concentration, thus the viscosity enhancing effect by NP could be ignored in our simulations.
Figure 4.
Illustration of three different simulation setups: (A) pure particles; (B) same NP dosage mixed with RBCs; (C) same effective particle concentration mixed with RBC s.
A. Verification of NP diffusion coefficient with Taylor-Aris theory
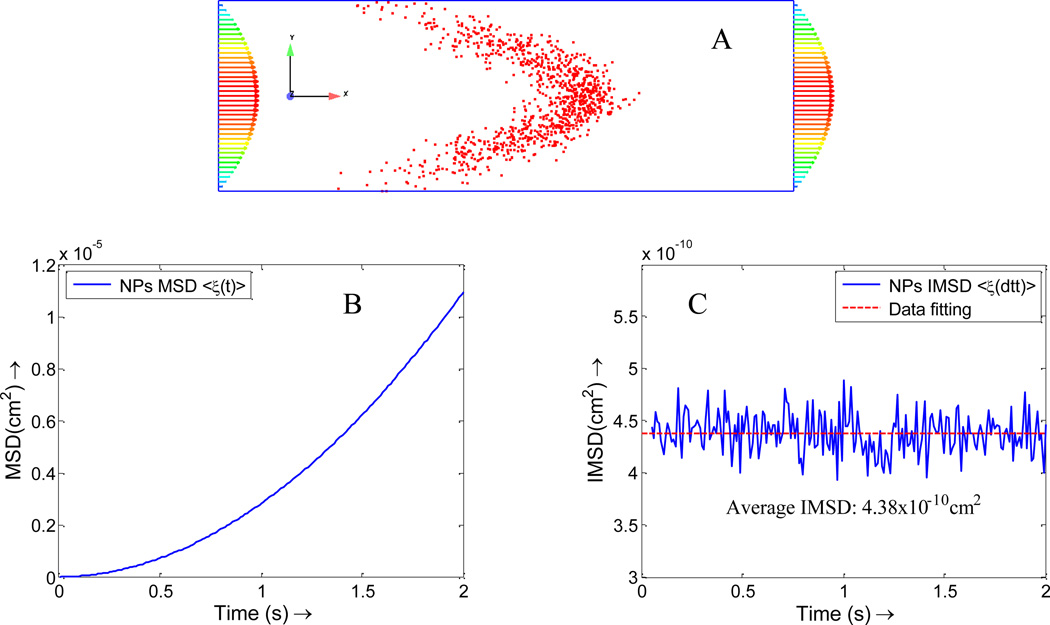
When NPs are injected into the blood flow, they spread out across the vessel under the combined effects of diffusion and fluid flow. It is derived analytically that the particle concentration generated is centered on a point which moves with the mean speed of flow and is symmetrical about this point in spite of the asymmetry of the flow[14], as shown in Figure 5. The diffusion coefficient for NPs with a diameter of 100 nm is 2.2×10⁻⁸ cm2/s. By tracking the position of the NPs in fluid flow direction, the diffusion can be calculated by MSD:
| (23) |
where is the velocity of particle α at time step i, DX is the diffusion in fluid flow direction indicated by X.
Figure 5.
(A) Taylor-Aris effect for the NP diffusion in vessel. (B) Overall Mean square displacement (MSD) for NPs in flow direction, which is a quadratic function of time t; (C) Instantaneous Mean Square Displacement (IMSD) for NPs in flow direction, the average instantaneous diffusion coefficient is about 2.2×10⁻⁸ cm2/s (here dtt=0.01s, which is different from NP-RBC simulation case).
The observed MSD is a quadratic function of t since the displacement contains axial displacement term , as shown in Figure 5A. To eliminate the tube flow effect on NPs distribution, Eqn. (23) is used to obtain the diffusion coefficient in x direction. By linear data fitting, average IMSD < ξ (dtt) > =4.38×10⁻¹⁰ cm2, as indicated by a dash line in Figure 5B. Thus, the diffusion coefficient is , which agrees with the theoretical value.
B. The influence of shear rate on nanoparticle delivery
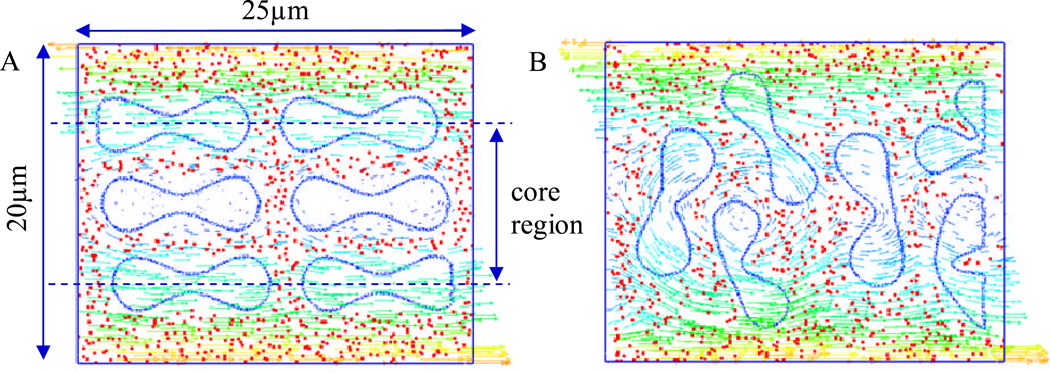
The influence of different shear rates on nanoparticle delivery is considered first. The shear rate is determined by the velocity of the blood flow and vessel diameter. Typically in capillary with size between 10 and 20 µm in diameter, the mean velocity of blood flow usually ranges from 10 µm/s to 100 µm/s [54], and the maximum shear rate at the vessel wall ranges from 8 to 40 s−1. In the simulation model, the effect of RBC tumbling motion on the dispersion of NPs under the shear rate of 8 s−1 and 16 s−1 are considered. To study how RBCs influence the delivery of nanoparticles of different size, two types of NPs with size 10 nm and 100 nm are studied, which are within the recommended size range (10~200 nm) of tumor drug carriers. A snap shot of the model is shown in Figure 6.
Figure 6.
Simulation of RBCs and NPs interaction under a shear flow. (A) initial configuration of the model; (B) a snap shot of the model at 0.74 s.
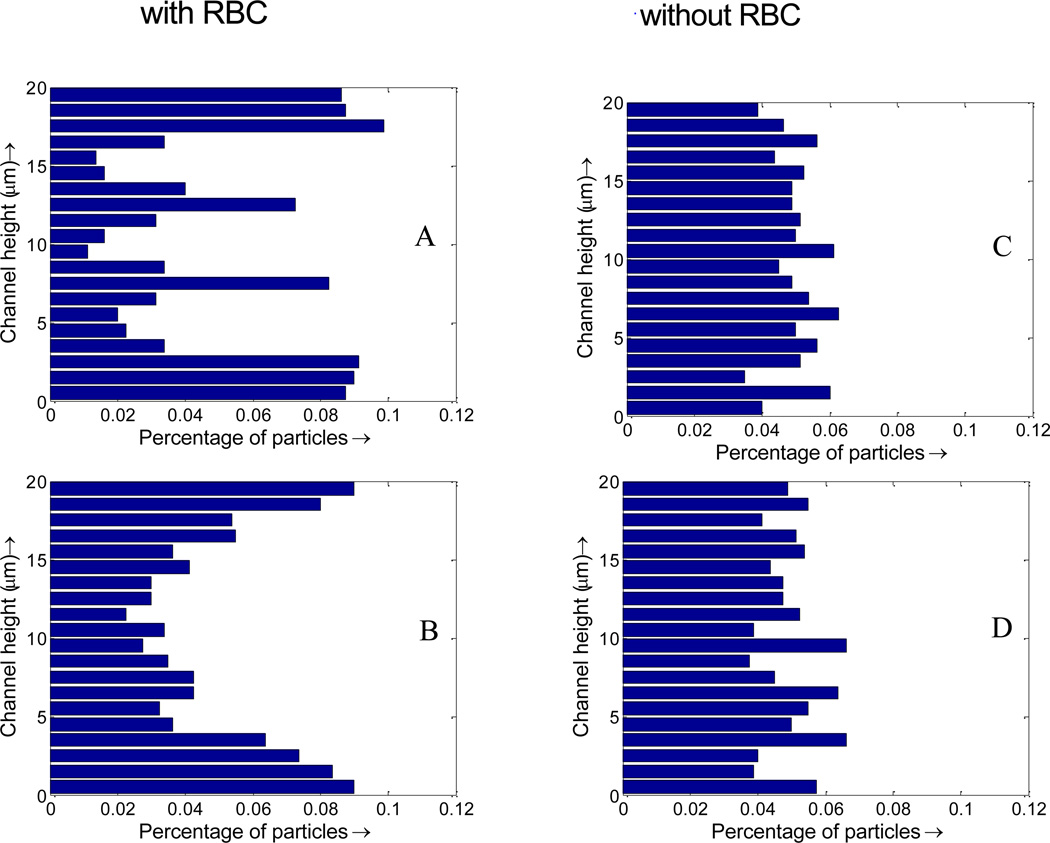
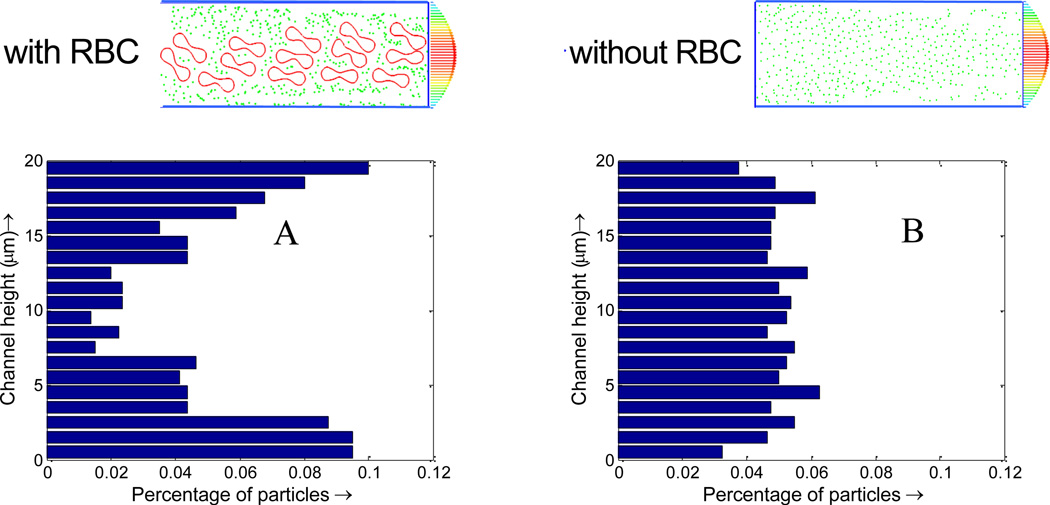
RBC tumbling motion is found to help the dispersion of the NPs from the core region toward the edge of the simulation domain, as shown in Figure 6. Once RBCs tumble under shear flow, NPs begin to redistribute along with the motion of the RBCs. Compare to the case with pure NPs, the NP distribution when mixed with RBCs is not uniform, with more NPs in the near vessel wall region. Such non-uniform NP distribution, as shown in Figure 7, is favorable for NPs targeted binding and subsequently leads to higher NP binding efficacy, which will be discussed Section C. From Figure 7A, it is shown that with RBCs, the number of NPs in the edge region increases from 5% to 10%, almost doubled compared to that without RBCs. Such non-uniform NP distribution is induced by the RBCs volumetric exclusion and tumbling effect. Similar increased near-wall high particle concentration has also been reported for platelet distribution in capillary flow[56–59].
Figure 7.
Nanoparticle distribution profile across the vessel. (A) initial NP distribution profile with RBCs; (B) NP distribution profile with RBCs at 1 s; (C) initial NP distribution profile without RBCs; (D) NP distribution profile without RBCs at 1 s.
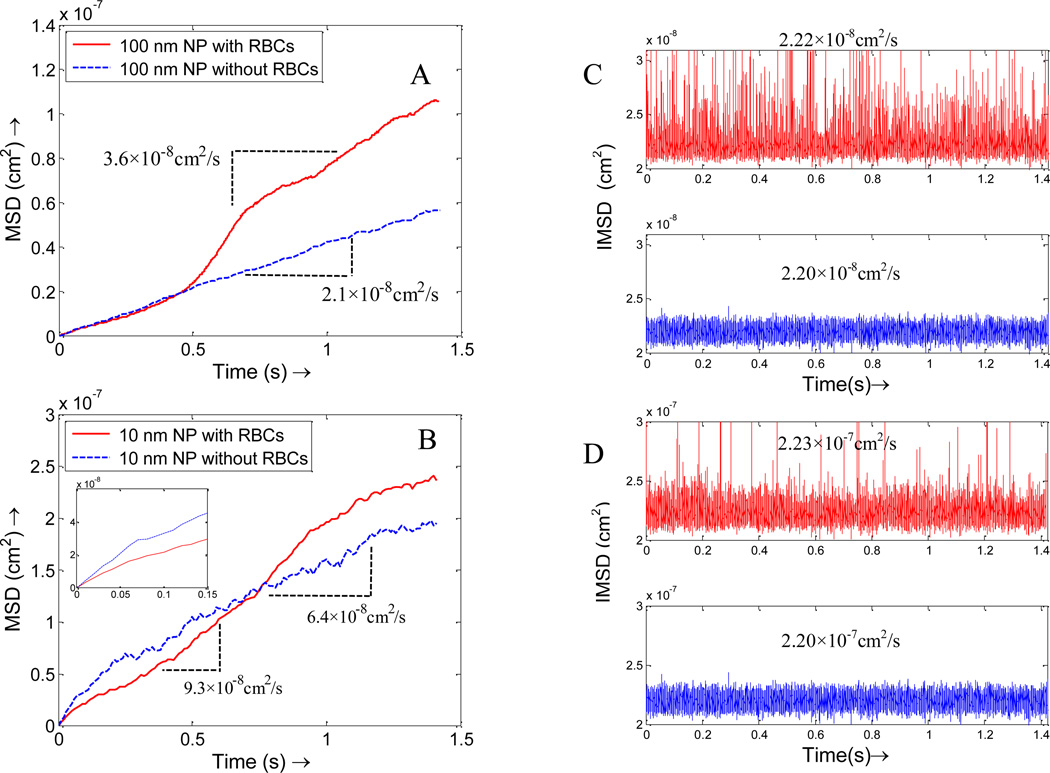
Besides distribution, RBCs also influence NPs dispersion. The existence of RBCs serves as dual roles to the particle dispersion. On one hand, due to the interaction between the cells and the particles, the particles will be pushed around as RBCs tumble in the blood, thus lead to higher dispersion coefficient. For example, when 100 nm diameter NPs are introduced in the model under a shear rate of 8 s−1, the average dispersion coefficient (half of the slope of the mean square displacement) is 3.6×10⁻⁸ cm2/s, a significant increase compared to the theoretical value of 2.2×10⁻⁸ cm2/s without RBCs considered, as shown in Figure 8A. Such enhanced dispersion is also observed by Crowl et al. [57] on platelet motion induced by red blood cells. On the other hand, RBCs trap particles in the space in between, especially for small NPs which diffuse faster than RBCs rotation. For example, the trapping effect for 10 nm particles is dominant during the first 0.7s when RBCs/NPs mixture are placed under a shear flow; however, the diffusion enhancement effect outweighs trapping effect once the RBCs tumbling become apparent, which is reflected in Figure 8B where the average dispersion coefficient with RBCs is 9.3×10⁻⁸ cm2/s as compared to 6.4×10⁻⁸ cm2/s without RBCs. It should be noted that the dispersion coefficient without RBCs is smaller than the theoretical free diffusion value 2.2×10⁻⁷ cm2/s due to the constrained effect at the fluid channel boundaries. The zoom-in sub-plot of the MSD at the beginning (Figure 8B) shows that the dispersion coefficient is close to the theoretical value of free diffusion. To eliminate the constrained effect, the instantaneous diffusion coefficients (IDC) is calculated based on Eqn.(22). It is shown in Figure 8C that IDCs are very close to the theoretical value of NPs of corresponding size. For example, for 100 nm NPs, the IDC with RBCs is 2.22×10⁻⁸ cm2/s, while the IDC without RBCs is 2.20×10⁻⁸ cm2/s, as shown in Figure 8C. Similar results were also observed for 10 nm NPs, as shown in Figure 8D.
Figure 8.
The overall mean square displacements (MSD) of the particles with RBCs and without RBCs under a shear rate of 8 s−1, which show that RBCs enhance the dispersion for both larger NPs and smaller NPs, but in slightly different ways. (A) NPs with size of 100 nm; (B) NPs with size of 10 nm, the zoom-in subplot show smaller NPs are trapped initially by RBCs. Instantaneous mean square displacement (IMSD) of the particles with RBCs and without RBCs under shear rate of 8 s−1: (C) NPs with size of 100 nm; (D) NPs with size of 10 nm.
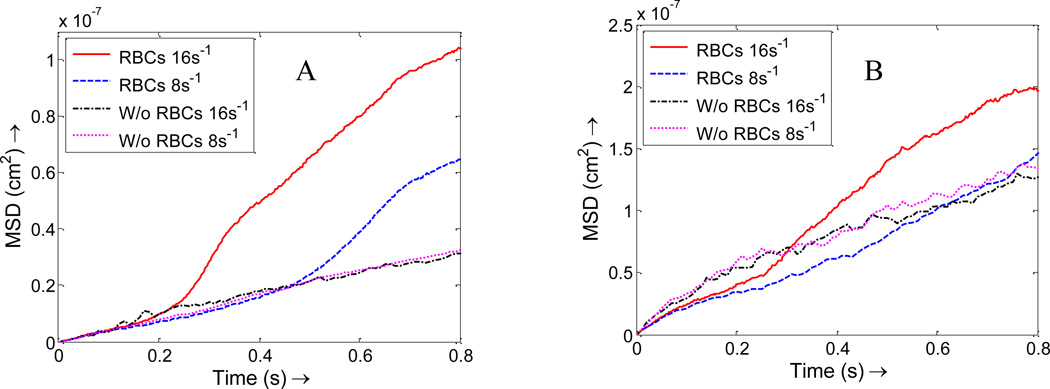
The diffusion coefficient of particles is a physical property which usually should not change with shear rates. However, the dispersion rate might be influenced by the existence of RBCs and change with shear rates. The dispersion rate of NPs is characterized at different shear rates in our simulations. With RBCs, as the shear rate increases, the mean square displacement for NPs increases for both 100 nm and 10 nm diameter NPs, as shown in Figure 9. This is explained by the fact that RBCs tumbles faster at higher shear rates, thus push the surrounding NPs and lead to larger dispersion. The enhancement in dispersion rate due to the existence of RBCs is more apparent for 100 nm NPs compared to 10 nm NPs. However, without RBCs, no matter how much the shear rate increases, the dispersion coefficients for NPs almost keep unchanged. Thus, larger shear rate enhances NPs dispersion due to the faster rotation of RBCs, which is favorable for NPs margination toward vessel wall surface.
Figure 9.
Mean square displacement of NPs under shear rates of 8 s−1 and 16 s−1 with RBCs and without RBCs. (A) 100 nm size of NPs; (B) 10 nm size of NPs.
C. The influence of RBCs on NP binding
NP binding dynamics involves molecular level binding between ligands coated on the NP surface and receptors on the vessel wall. The detailed binding adhesion dynamics of individual particles of arbitrary shape under various flow conditions has been studied in our previous work[33]. In this paper, we focus on collective behavior of NPs under the influence of RBCs, thus simply bind NPs upon its contact with the wall surface. As described in Section B, the existence of RBCs lead to high near-wall NP concentration and is expected to induce faster NP binding. The NP binding dynamics is studied in a 20 µm wide vessel with the existence of RBCs under an average inlet flow rate of 20 µm/s. With RBCs, the particle distribution is not uniform (see Figure 10A and B), particularly with more particles in the near vessel wall region. This nonuniform particle distribution is favorable for NPs targeted binding because with high concentration in the cell free layer region, more particles are likely to bind to the diseased area.
Figure 10.
Particle distribution profile at time t=7.5s. (A) NPs with RBCs case; (B) NPs without RBCs.
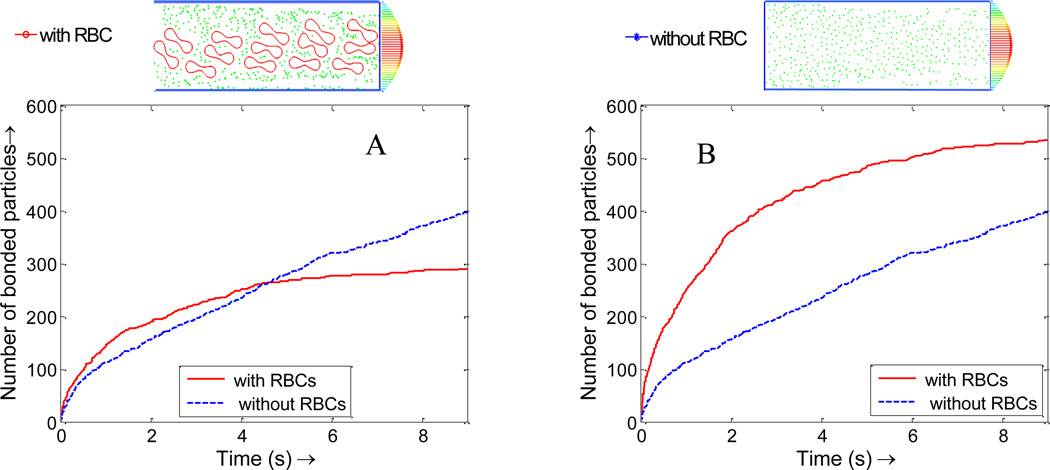
The NPs binding time history is plotted in Figure 11. For the same NP concentration case, there are fewer NPs in the simulation domain, thus the total number of bounded NPs with the existence of RBCs is less than that without RBCs. However, the NPs binding rate in the initial stage with the existence of RBCs is higher than that without RBCs, as shown in Figure 11A. For the same NP dosage case, since the NP density at the near wall region is much higher than that without RBCs, NPs with RBCs bind at a significantly higher rate than that without RBCs, as shown in Figure 11B. In Figure 11, the number of bonded NPs gradually reaches a plateau, which indicates that NP binding is a diffusion limited reaction process and the number of free NPs decreases over time.
Figure 11.
(A) Nanoparticle binding time histories with and without RBCs of the same effective nanoparticle density; (B) Nanoparticle binding time histories with and without RBCs of the same NP dosage.
For quantitative calculation of the binding rate, a first order reaction model is used to fit the binding curve to retrieve the binding rate:
| (24) |
where Nb is the number of bonds, N0 is the total number of NPs in the fluid domain, Kf is the forward binding rate with units of 1/s.
The analytical solution for Eqn.(24) is Nb = N0 (1 − exp(−Kft))
However, if the bonds formation is diffusion or reaction limited, the kinematics of bonds formation is not exponential function of time. Douglas et. al.[60] proposed to use a non-exponential reaction rate to express the bonds formation, which can be modified as:
Nb = N0 (1 − exp[−Kft]β) where β is a parameter related to the time dependent rate.
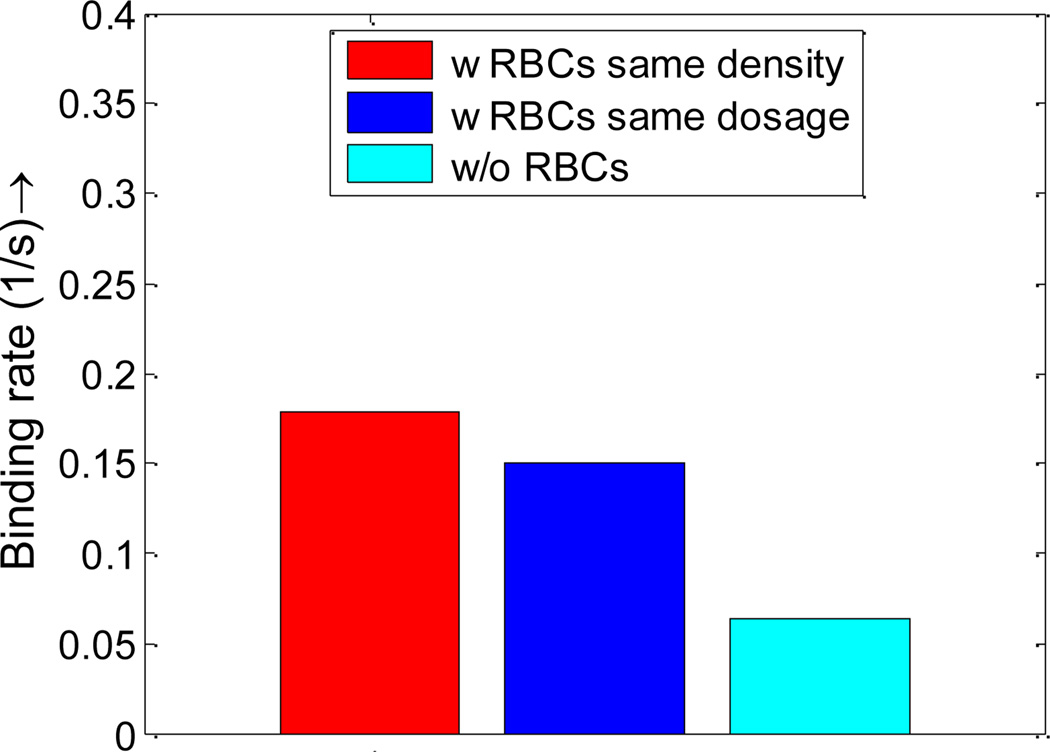
The same method is also used by Park et al.[61] to fit the data of non-equilibrium NP adsorption on a model biological substrate. By fitting the data obtained in NPs binding time history, the binding rates with RBCs, without RBCs, under the same density, and under the same dosage are summarized in Figure 12.
Figure 12.
NPs binding rates with RBCs and without RBCs under same density and same dosage. Such increased binding rate is explained by the higher NP concentration in the cell-free-layer and larger dispersion rate.
As shown in Figure 10, with RBCs, the percentage of particles in the cell free layer increase from 5% to 10%, almost doubled compared to that without RBCs. This favorable particle distribution leads to more than two times higher binding efficacy for NPs with RBCs compared to that without RBCs, as shown in Figure 12. This higher binding rate is likely induced by the tumbling and blocking effect of RBCs which can help increase the NP density in the cell free layer. The particles enter the cell free layer cannot easily diffuse back to the core region of the vessel filled with RBCs. While without RBCs, the particles are free to diffuse in any direction, consequently, the binding rate without RBCs is decreased.
D. NP delivery in small capillaries
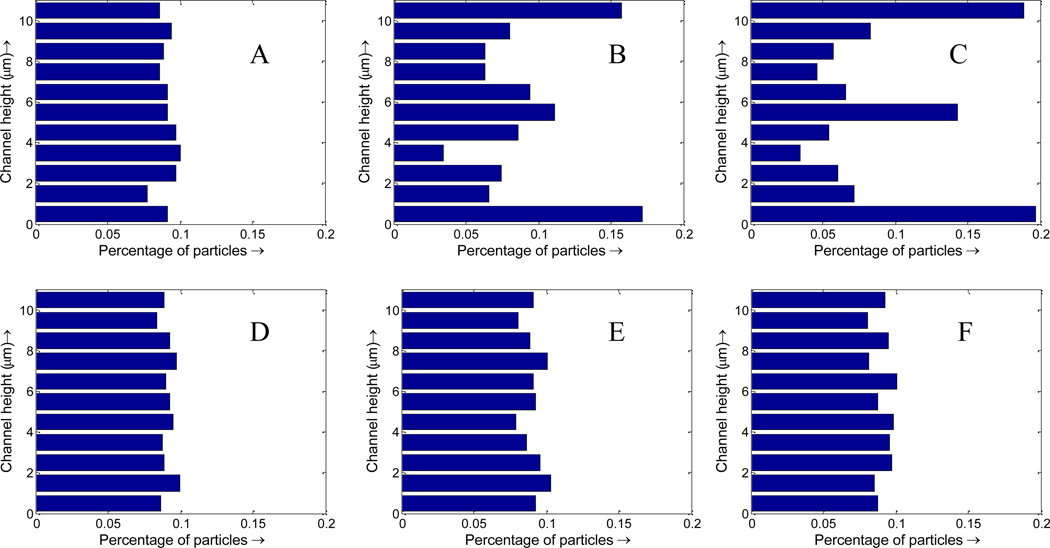
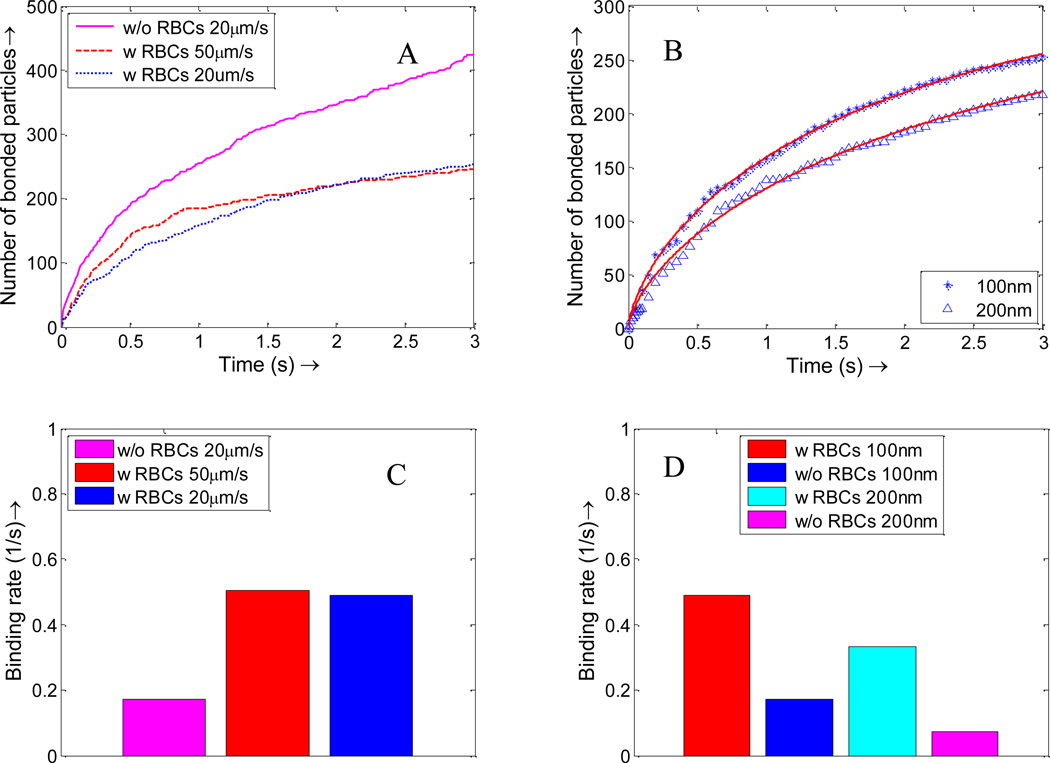
The NPs delivery process is also studied in a small capillary with a diameter of 11 µm. The configuration of the model is shown in Figure 13, with cells aligned inside the channel in a linear profile. Figure 14 shows that the NP concentration is higher in the near wall region with RBCs while the NP concentration is uniform across the capillary without RBCs. The higher NP concentration in the cell free layer leads to a larger binding rate compared to those NPs without RBCs, as shown in binding time history in Figure 15. For NPs without RBCs, the binding rate does not change with flow rate, thus only the NP binding time history under 20 µm/s is plotted in Figure 15A. The binding rate is also influenced by particle size. For example, binding rate for NPs with a diameter of 100 nm is larger than NP with a diameter of 200 nm due to the faster diffusion, as shown in Figure 15B. The binding rates are calculated by exponential fitting of binding time history and are summarized in Figure 15C–D. The NP binding rates with RBCs are always larger than that without RBCs. The binding rate increases with decreased particle size. For NPs with RBCs, the binding rate increases slightly when the average flow speed increases from 20 µm/s to 50 µm/s. Similar experimental results showing that flow rate minimally influence NP binding have been reported by Haun et al. [62] in a flow chamber test.
Figure 13.
(A) Initial configuration of NPs and RBCs; (B) snapshot of NP distribution in capillary flow at time 1s with an average flow velocity 20 µm/s.
Figure 14.
NPs distribution at t=0s, 0.5s and 1s when flowing with RBCs(A,B,C) and without RBCs(D,E,F) in capillary with diameter of 11 µm.
Figure 15.
(A) NPs binding time history with and without RBCs under different flow rates; (B) Binding time histories of NPs of different sizes, with and without RBCs, under a 20 µm/s flow. The star and triangle represent simulation data, while the solid line is obtained by data fitting. Using the first order reaction model fitting, the binding rates for NPs of different sizes with RBCs and without RBCs under different flow speeds are obtained: (C) NP binding rate under different flow rates; (D) Binding rate for NPs of different sizes with flow rate of 20 µm/s.
IV. Experimental validation
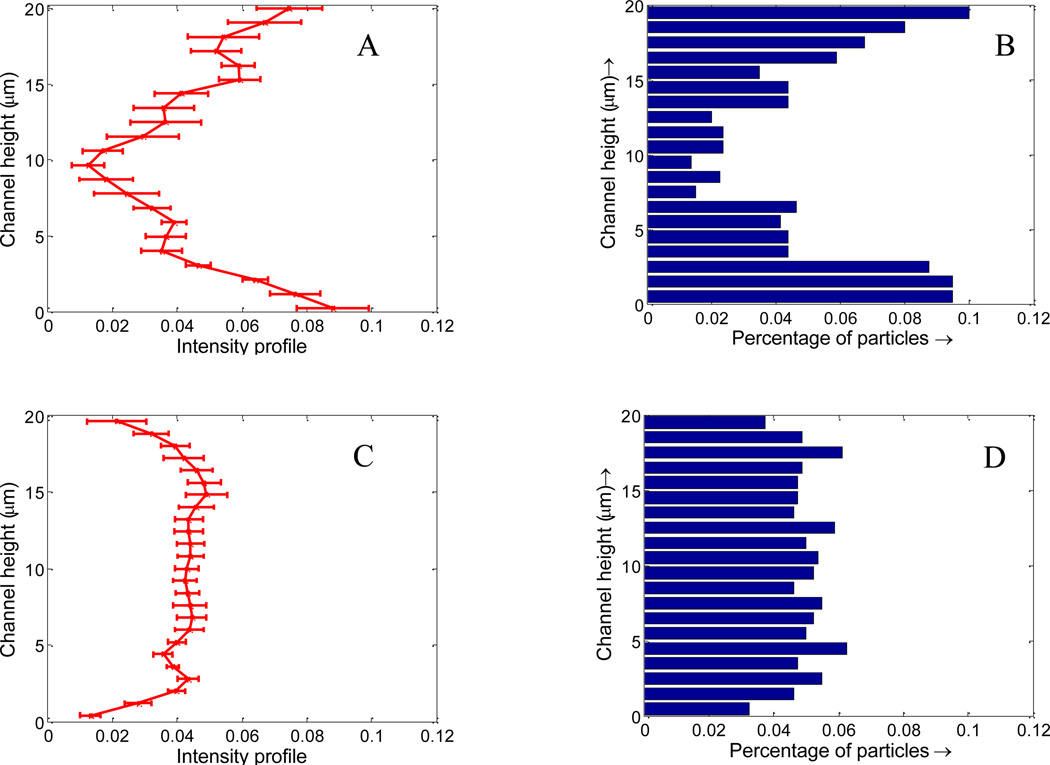
Microfluidic based blood vessel mimicking devices have been successfully applied in our lab to study NP transport and distribution[63]. To verify the results obtained in the simulation, experimental study on NPs distribution was performed by flowing 100 nm fluorescence NPs through a microfluidic channel of width 20 µm. In brief, straight 20 µm wide microfluidic channels were fabricated using standard soft lithography process[64]. The PDMS microfluidic device was bonded on clean glass slides after treating in an oxygen plasma chamber. The surface of the PDMS device was then functionalized with NeutrAvidin to bind with the biotin coated NPs. A mixture of RBCs and 100 nm biotin coated NPs with volume ratio of 36% was injected into the microfluidic device using a Harvard PHD 2000 syringe pump. The same flow rate used the simulation was chosen (20 µm/s). Channels were flushed with Phosphate Buffered Saline to remove unbound NPs from the channel after NPs distribution reached an equilibrium. Imaging was done using a fluorescent microscope (Olympus IX81). After eliminating the background noise and normalizing the fluorescence intensity with the total intensity, the fluorescence intensity distribution of NPs across the channel is analyzed and plotted in Figure 16A. It is observed that the NP fluorescent intensity is higher near the channel wall compared to the core region, which is consistent with the simulated NPs distribution profile shown in Figure 16B. As a control case, flux of pure NPs without RBCs was also performed, as shown in Figure 16C. The NP fluorescent intensity profile is flat across the channel, which again agrees with the simulation results shown in Figure 16D. It should be noted that NP fluorescent intensity is not exactly NP concentration. Due to the small size of the NPs and high flow rate, individual NPs are very hard to be visualized even with high-speed spinning disk confocal microscope. However, it is believed that NP fluorescence intensity profile essentially reflect the characteristics of the NPs distribution. Comparing the simulation and experiment data, it is concluded that RBCs can enhance the NP concentration in the margin of the vessels, thus leads to higher binding rate.
Figure 16.
Fluorescence intensity across the channel in microfluidic tests, the error bar is plotted based on 10 runs of tests: (A) with RBCs; (C) without RBCs; (B) and (D): simulated NP distribution across the channel in the simulation with and without RBCs from Figure 10.
V. Discussions and summary
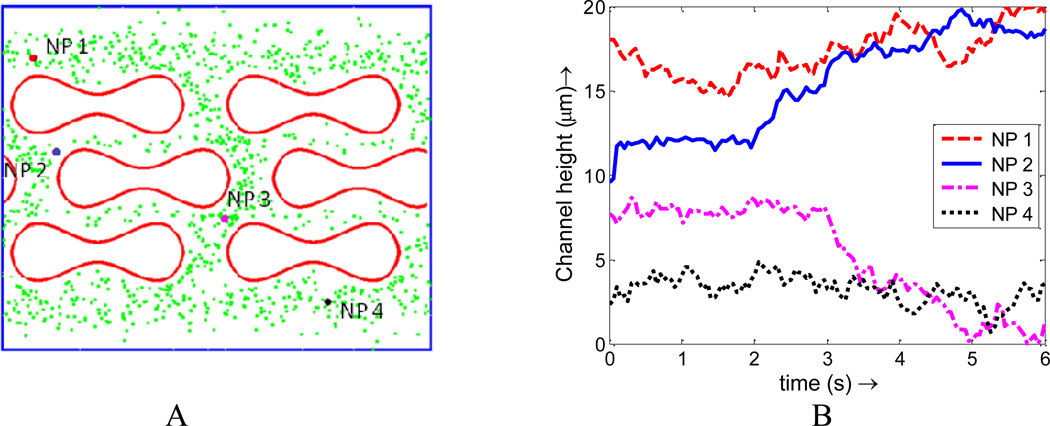
The enhanced NP dispersion and binding with the existence of RBCs observed in our simulations is believed to be not only a volume exclusion effect. We have shown that NP binding rate is higher for both RBC mixed with NPs of the same dosage and effective concentration compared to pure NPs cases. Such enhanced NP binding is directly induced by the higher concentration of NPs near the vessel wall, which indicates that NPs originally located in the center of the vessel will migrate toward the vessel edge during their collisions with the RBCs. To illustrate this dynamic migration process, trajectories of four NPs are tracked and analyzed in the simulation and illustrated in Figure 17. Two NPs in the core region (NP2 and NP3) are observed to migrate toward the edge of the channel. During the same period, two NPs in the edge (NP1 and NP4) are found difficult to diffuse toward the center due to the existence of RBCs moving in a relatively higher velocity in the core region.
Figure 17.
(A) Initial positions of four NPs chosen at different locations; (B) Trajectory of NPs under the interaction of RBCs in capillary flow
In summary, a particle-cell hybrid model is developed to model NPs transport, dispersion, and adhesion dynamics in blood stream through coupled Immersed Finite Element method and particle Brownian adhesion dynamics. The dispersion and adhesion kinetics of NPs in microcirculation is studied for the first time with cell hydrodynamics coupled with particle Brownian dynamics. The adhesion kinetics of NPs is found to be significantly influenced by the existence of RBCs and shear rates. The cell-free-layer and NP-cell interaction largely influence both the dispersion and binding rates, thus impact targeted delivery efficacy. Under a shear flow, the RBCs' tumbling motion will enhance NP dispersion. This leads to an increase in NP dispersion rate with increased shear rate. The distribution of NPs in capillary flow is not uniform, with more particles near the vessel wall surface. Such margination of NPs occurs due to hydrodynamic interaction and RBCs volumetric exclusion effect. Higher density of NPs in the near-wall region leads to higher binding rate for NPs in both 20 µm and 11 µm capillaries. The binding rate of NPs with RBCs is two times of that without RBCs. This observation is applicable to NPs of various sizes from 10 nm to 200 nm. Results from this study contribute to the fundamental understanding and knowledge on how the particulate nature of blood influences NP delivery, which will provide mechanistic insights on the nanomedicine design for targeted drug delivery applications.
ACKNOWLEDGMENT
The authors acknowledge the supports of this work from National Science Foundation (NSF) CAREER grant CBET-1113040, NSF CBET-1067502, and National Institute of Health (NIH) grant EB009786.
REFERENCE
- 1.Chauvierre C, et al. Novel polysaccharide-decorated poly(isobutyl cyanoacrylate) nanoparticles. Pharmaceutical Research. 2003;20(11):1786–1793. doi: 10.1023/b:pham.0000003376.57954.2a. [DOI] [PubMed] [Google Scholar]
- 2.Farokhzad OC, Langer R. Nanomedicine: Developing smarter therapeutic and diagnostic modalities. Advanced Drug Delivery Reviews. 2006;58(14):1456–1459. doi: 10.1016/j.addr.2006.09.011. [DOI] [PubMed] [Google Scholar]
- 3.Mathiowitz E, et al. Biologically erodable microsphere as potential oral drug delivery system. Nature. 1997;386(6623):410–414. doi: 10.1038/386410a0. [DOI] [PubMed] [Google Scholar]
- 4.Nasongkla N, et al. Multifunctional polymeric micelles as cancer-targeted, MRI-ultrasensitive drug delivery systems. Nano Letters. 2006;6(11):2427–2430. doi: 10.1021/nl061412u. [DOI] [PubMed] [Google Scholar]
- 5.Peppas NA. Intelligent biomaterials as pharmaceutical carriers in microfabricated and nanoscale devices. Mrs Bulletin. 2006;31(11):888–893. [Google Scholar]
- 6.Roney C, et al. Targeted nanoparticles for drug delivery through the blood-brain barrier for Alzheimer's disease. Journal of Controlled Release. 2005;108(2–3):193–214. doi: 10.1016/j.jconrel.2005.07.024. [DOI] [PubMed] [Google Scholar]
- 7.Shah P. Use of nanotechnologies for drug delivery. Mrs Bulletin. 2006;31(11):894–899. [Google Scholar]
- 8.Sukhorukov GB, Mohwald H. Multifunctional cargo systems for biotechnology. Trends in Biotechnology. 2007;25(3):93–98. doi: 10.1016/j.tibtech.2006.12.007. [DOI] [PubMed] [Google Scholar]
- 9.Petros RA, DeSimone JM. Strategies in the design of nanoparticles for therapeutic applications. Nat Rev Drug Discov. 2010;9(8):615–627. doi: 10.1038/nrd2591. [DOI] [PubMed] [Google Scholar]
- 10.Alexis F, et al. Factors Affecting the Clearance and Biodistribution of Polymeric Nanoparticles. MOLECULAR PHARMACEUTICS. 2008;5(4):505–515. doi: 10.1021/mp800051m. [DOI] [PMC free article] [PubMed] [Google Scholar]
- 11.Wang J, et al. More Effective Nanomedicines through Particle Design. Small. 2011;7(14):1919–1931. doi: 10.1002/smll.201100442. [DOI] [PMC free article] [PubMed] [Google Scholar]
- 12.Lutters BCH, et al. Blocking endothelial adhesion molecules: a potential therapeutic strategy to combat atherogenesis. Current Opinion in Lipidology. 2004;15(5):545–552. doi: 10.1097/00041433-200410000-00008. [DOI] [PubMed] [Google Scholar]
- 13.Aris R. On the dispersion of a solute in a fluid flowing through a tube. Proceedings of the Royal Society of London Series A-Mathematical and Physical Sciences. 1956;235(1200):67–77. [Google Scholar]
- 14.Taylor G. Dispersion of Soluble Matter in Solvent Flowing Slowly through a Tube. Proceedings of the Royal Society of London, Series A-Mathematical and Physical Science. 1953;219(1137):186–203. [Google Scholar]
- 15.Dembo M, et al. The Reaction-Limited Kinetics of Membrane-to-Surface Adhesion and Detachment. Proceedings of the Royal Society of London Series B-Biological Sciences. 1988;234(1274):55–83. doi: 10.1098/rspb.1988.0038. [DOI] [PubMed] [Google Scholar]
- 16.Dong C, et al. Mechanics of leukocyte deformation and adhesion to endothelium in shear flow. Annals of Biomedical Engineering. 1999;27(3):298–312. doi: 10.1114/1.143. [DOI] [PubMed] [Google Scholar]
- 17.Decuzzi P, Ferrari M. The adhesive strength of non-spherical particles mediated by specific interactions. Biomaterials. 2006;27(30):5307–5314. doi: 10.1016/j.biomaterials.2006.05.024. [DOI] [PubMed] [Google Scholar]
- 18.Decuzzi P, et al. A theoretical model for the margination of particles within blood vessels. Annals of Biomedical Engineering. 2005;33(2):179–190. doi: 10.1007/s10439-005-8976-5. [DOI] [PubMed] [Google Scholar]
- 19.Decuzzi P, et al. Adhesion of microfabricated particles on vascular endothelium: A parametric analysis. Annals of Biomedical Engineering. 2004;32(6):793–802. doi: 10.1023/b:abme.0000030255.36748.d3. [DOI] [PubMed] [Google Scholar]
- 20.Sanhai WR, et al. Seven challenges for nanomedicine. Nat Nano. 2008;3(5):242–244. doi: 10.1038/nnano.2008.114. [DOI] [PubMed] [Google Scholar]
- 21.Zhang L, et al. Immersed finite element method. Computer Methods in Applied Mechanics and Engineering. 2004;193(21–22):2051–2067. [Google Scholar]
- 22.Liu WK, et al. Immersed finite element method and its applications to biological systems. Computer Methods in Applied Mechanics and Engineering. 2006;195(13–16):1722–1749. doi: 10.1016/j.cma.2005.05.049. [DOI] [PMC free article] [PubMed] [Google Scholar]
- 23.Liu WK, Kim DW, Tang SQ. Mathematical foundations of the immersed finite element method. Computational Mechanics. 2007;39(3):211–222. [Google Scholar]
- 24.Lee TR, et al. Immersed finite element method for rigid body motions in the incompressible Navier-Stokes flow. Computer Methods in Applied Mechanics and Engineering. 2008;197(25–28):2305–2316. [Google Scholar]
- 25.Einstein A. Investigations on the Theory of Brownian Movement. New York: Dover; 1956. [Google Scholar]
- 26.Ermak DL, Mccammon JA. Brownian Dynamics with Hydrodynamic Interactions. Journal of Chemical Physics. 1978;69(4):1352–1360. [Google Scholar]
- 27.Li A, Ahmadi G. Dispersion and Deposition of Spherical-Particles from Point Sources in a Turbulent Channel Flow. Aerosol Science and Technology. 1992;16(4):209–226. [Google Scholar]
- 28.Mody NA, King MR. Influence of Brownian motion on blood platelet flow behavior and adhesive dynamics near a planar wall. Langmuir. 2007;23(11):6321–6328. doi: 10.1021/la0701475. [DOI] [PMC free article] [PubMed] [Google Scholar]
- 29.Longest PW, Kleinstreuer C. Comparison of blood particle deposition models for non-parallel flow domains. Journal of Biomechanics. 2003;36(3):421–430. doi: 10.1016/s0021-9290(02)00434-7. [DOI] [PubMed] [Google Scholar]
- 30.Gentile F, Ferrari M, Decuzzi P. The transport of nanoparticles in blood vessels: The effect of vessel permeability and blood rheology. Annals of Biomedical Engineering. 2008;36(2):254–261. doi: 10.1007/s10439-007-9423-6. [DOI] [PubMed] [Google Scholar]
- 31.Lee TR, et al. Numerical Simulation of a Nanoparticle Focusing Lens in a Microfluidic Channel by Using Immersed Finite Element Method. Journal of Nanoscience and Nanotechnology. 2009;9(12):7407–7411. doi: 10.1166/jnn.2009.1787. [DOI] [PubMed] [Google Scholar]
- 32.Sharma N, Patankar NA. Direct numerical simulation of the Brownian motion of particles by using fluctuating hydrodynamic equations. Journal of Computational Physics. 2004;201(2):466–486. [Google Scholar]
- 33.S.Shah YL. Modeling Particle Shape-Dependent Dynamics in Nanomedicine. Jounal of Nanoscience and Nanotechnology. 2011;11(2):919–928. doi: 10.1166/jnn.2011.3536. [DOI] [PMC free article] [PubMed] [Google Scholar]
- 34.Mori N, Kumagae M, Nakamura K. Brownian dynamics simulation for suspensions of oblong-particles under shear flow. Rheologica Acta. 1998;37(2):151–157. [Google Scholar]
- 35.Liu YL, Liu WK. Rheology of red blood cell aggregation by computer simulation. Journal of Computational Physics. 2006;220(1):139–154. [Google Scholar]
- 36.Liu YL, et al. Coupling of Navier-Stokes equations with protein molecular dynamics and its application to hemodynamics. International Journal for Numerical Methods in Fluids. 2004;46(12):1237–1252. [Google Scholar]
- 37.Skalak R, et al. Mechanics of Rouleau Formation. Biophysical Journal. 1981;35(3):771–781. doi: 10.1016/S0006-3495(81)84826-6. [DOI] [PMC free article] [PubMed] [Google Scholar]
- 38.Eggleton CD, Popel AS. Large deformation of red blood cell ghosts in a simple shear flow. Physics of Fluids. 1998;10(8):1834–1845. doi: 10.1063/1.869703. [DOI] [PMC free article] [PubMed] [Google Scholar]
- 39.Pozrikidis C. Numerical simulation of the flow-induced deformation of red blood cells. Annals of Biomedical Engineering. 2003;31(10):1194–1205. doi: 10.1114/1.1617985. [DOI] [PubMed] [Google Scholar]
- 40.Liu Y, et al. Immersed electrokinetic finite element method. International Journal for Numerical Methods in Engineering. 2007;71(4):379–405. [Google Scholar]
- 41.Peskin CS, Mcqueen DM. A 3-Dimensional Computational Method for Blood-Flow in the Heart .1. Immersed Elastic Fibers in a Viscous Incompressible Fluid. Journal of Computational Physics. 1989;81(2):372–405. [Google Scholar]
- 42.Peskin CS, Mcqueen DM. Modeling Prosthetic Heart-Valves for Numerical-Analysis of Blood-Flow in the Heart. Journal of Computational Physics. 1980;37(1):113–132. [Google Scholar]
- 43.Peskin CS. The immersed boundary method. Acta Numerica. 2002;11:479–517. [Google Scholar]
- 44.Saad Y, Schultz MH. Gmres - a Generalized Minimal Residual Algorithm for Solving Nonsymmetric Linear-Systems. Siam Journal on Scientific and Statistical Computing. 1986;7(3):856–869. [Google Scholar]
- 45.AlMomani T, et al. Micro-scale Dynamic Simulation of Erythrocyte–Platelet Interaction in Blood Flow. Annals of Biomedical Engineering. 2008;36(6):905–920. doi: 10.1007/s10439-008-9478-z. [DOI] [PubMed] [Google Scholar]
- 46.Arieh L, Edelstein NA. Brownian simulation of many-particle binding to a reversible receptor array. Journal of Computational Physics. 1997;132:260–275. [Google Scholar]
- 47.Breedveld V, et al. The measurement of the shear-induced particle and fluid tracer diffusivities in concentrated suspensions by a novel method. Journal of Fluid Mechanics. 1998;375:297–318. [Google Scholar]
- 48.Marchioro M, Acrivos A. Shear-induced particle diffusivities from numerical simulations. Journal of Fluid Mechanics. 2001;443:101–128. [Google Scholar]
- 49.Wang Y, Mauri R, Acrivos A. The transverse shear-induced liquid and particle tracer diffusivities of a dilute suspension of spheres undergoing a simple shear flow. Journal of Fluid Mechanics. 1996;327:255–272. [Google Scholar]
- 50.Boryczko K, Dzwinel W, Yuen DA. Dynamical clustering of red blood cells in capillary vessels. Journal of Molecular Modeling. 2003;9(1):16–33. doi: 10.1007/s00894-002-0105-x. [DOI] [PubMed] [Google Scholar]
- 51.Farokhzad OC, et al. Targeted nanoparticle-aptamer bioconjugates for cancer chemotherapy in vivo. Proceedings of the National Academy of Sciences. 2006;103(16):6315–6320. doi: 10.1073/pnas.0601755103. [DOI] [PMC free article] [PubMed] [Google Scholar]
- 52.Win KY, Feng S-S. In vitro and in vivo studies on vitamin E TPGS-emulsified poly(d,l-lactic-co-glycolic acid) nanoparticles for paclitaxel formulation. Biomaterials. 2006;27(10):2285–2291. doi: 10.1016/j.biomaterials.2005.11.008. [DOI] [PubMed] [Google Scholar]
- 53.Pandey R, et al. Nanoparticle encapsulated antitubercular drugs as a potential oral drug delivery system against murine tuberculosis. Tuberculosis. 2003;83(6):373–378. doi: 10.1016/j.tube.2003.07.001. [DOI] [PubMed] [Google Scholar]
- 54.Decuzzi P, Ferrari M. The adhesive strength of non-spherical particles mediated by specific interactions. Biomaterials. 2006;27(30):5307–5314. doi: 10.1016/j.biomaterials.2006.05.024. [DOI] [PubMed] [Google Scholar]
- 55.Lee J-H, et al. Effective viscosities and thermal conductivities of aqueous nanofluids containing low volume concentrations of Al2O3 nanoparticles. International Journal of Heat and Mass Transfer. 2008;51(11–12):2651–2656. [Google Scholar]
- 56.Bea Woldhuis G-JT. concentration profile of blood platelets differs in arterioles and venules. American Journal of Physiology-Heart and Circulatory Physiology. 1992;262(4):H1217–H1223. doi: 10.1152/ajpheart.1992.262.4.H1217. [DOI] [PubMed] [Google Scholar]
- 57.Crowl LM, Fogelson AL. Computational model of whole blood exhibiting lateral platelet motion induced by red blood cells. International Journal for Numerical Methods in Biomedical Engineering. 2010;26(3–4):471–487. doi: 10.1002/cnm.1274. [DOI] [PMC free article] [PubMed] [Google Scholar]
- 58.Zhao R, J.N.M., Antaki JF. Drag-reducing polymers diminish near-wall concentration of platelets in microchannel blood flow. Biorheology. 2011;47(3–4):193–203. doi: 10.3233/BIR-2010-0570. [DOI] [PMC free article] [PubMed] [Google Scholar]
- 59.Zhao R, et al. Micro-Flow Visualization of Red Blood Cell-Enhanced Platelet Concentration at Sudden Expansion. Annals of Biomedical Engineering. 2008;36(7):1130–1141. doi: 10.1007/s10439-008-9494-z. [DOI] [PMC free article] [PubMed] [Google Scholar]
- 60.Douglas JF, Steve Granick HEJ. A simple kinetic model of polymer adsorption and desorption. Science. 1993;262(24):2010–2012. doi: 10.1126/science.262.5142.2010. [DOI] [PubMed] [Google Scholar]
- 61.Park JJ, et al. Characterization of Non-Equilibrium Nanoparticle Adsorption on a Model Biological Substrate. Langmuir. 2010;26(7):4822–4830. doi: 10.1021/la903581w. [DOI] [PubMed] [Google Scholar]
- 62.Haun JB, Hammer DA. Quantifying Nanoparticle Adhesion Mediated by Specific Molecular Interactions. Langmuir. 2008;24(16):8821–8832. doi: 10.1021/la8005844. [DOI] [PubMed] [Google Scholar]
- 63.Thomas A, DD, Tan J, Muzykantov V, Liu Y. Characterization of Nanoparticle Transport and Distribution by Microfluidic Channels. 2011 in preparation, [Google Scholar]
- 64.Whitesides GM, et al. Soft lithography in biology and biochemisty. Annual Review of Biomedical Engineering. 2001;3(1):335–373. doi: 10.1146/annurev.bioeng.3.1.335. [DOI] [PubMed] [Google Scholar]


