

Abstract
Non-technical summary
Imaging of slow, long-lasting changes in intracellular Ca2+ levels ([Ca2+]i) is a common method to assess neuronal activity. We found that fast [Ca2+]i imaging (≥200 Hz sampling rate) may be a new option to record fast neuronal events including spike discharge and fast synaptic transmission in enteric neurones. These [Ca2+]i peaks required opening of voltage-gated sodium and calcium channels as well as Ca2+ release from intracellular stores.
Abstract
Slow changes in [Ca2+]i reflect increased neuronal activity. Our study demonstrates that single-trial fast [Ca2+]i imaging (≥200 Hz sampling rate) revealed peaks each of which are associated with single spike discharge recorded by consecutive voltage-sensitive dye (VSD) imaging in enteric neurones and nerve fibres. Fast [Ca2+]i imaging also revealed subthreshold fast excitatory postsynaptic potentials. Nicotine-evoked [Ca2+]i peaks were reduced by ω-conotoxin and blocked by ruthenium red or tetrodotoxin. Fast [Ca2+]i imaging can be used to directly record single action potentials in enteric neurones. [Ca2+]i peaks required opening of voltage-gated sodium and calcium channels as well as Ca2+ release from intracellular stores.
Introduction
The enteric nervous system (ENS), which controls gut functions rather autonomously, contains approximately 100 million neurones organised in a myenteric and submucous plexus located in the gut wall. The ENS has been studied extensively with classical electrophysiological techniques (for review see e.g. Wood, 2006). Additionally, neuronal network activity in the ENS has been studied by the application of neuroimaging techniques using voltage-sensitive dyes (VSD) (e.g. Schemann et al. 2002; Breunig et al. 2007; Mazzuoli & Schemann, 2009) or imaging of intracellular calcium [Ca2+]i (Vanden Berghe et al. 2001). Using electrode techniques in combination with calcium imaging, a tight correlation between slow, long-lasting changes in [Ca2+]i and neuronal excitation was shown to exist in myenteric neurones (Hillsley et al. 2000; Vanden Berghe et al. 2002). Increased excitation and number of action potentials correlated with the degree of slow increases in [Ca2+]i. Recordings of changes in [Ca2+]i are most often used to detect cell activation over a time span of several seconds or minutes. However, the relationship between individual action potential discharge and fast changes in [Ca2+]i in the ENS is currently elusive. The demonstration of a link between fast [Ca2+]i changes and single actions potentials requires high sampling rates that resolve [Ca2+]i signals with a higher fidelity than low frame rate imaging used in most studies (Vogt et al. 2011).
Therefore, it was our aim to image changes of membrane potential and [Ca2+]i in enteric neurones at high frame rates and investigate the features of a transient calcium increase associated with action potential discharge or subthreshold fast excitatory postsynaptic potentials (fEPSPs). Our strategy was to apply consecutive fast imaging using a camera system sensitive enough to detect fast changes in [Ca2+]i and correlate these to action potential firing patterns of enteric neurones. Action potentials were evoked by nicotine as most enteric neurones express cholinergic nicotinic receptors.
Methods
Experiments were performed on primary cultures of myenteric neurones from male guinea-pig (Dunkin-Hartley, Harlan, Borchen, Germany) small intestine and on whole-mount preparations from human submucous and guinea-pig myenteric plexus. The culture method has been described previously (Vanden Berghe et al. 2000).
Stock solutions of dyes were stored at −20°C and prepared as follows: di-8-ANEPPS (15 mm) was dissolved in 50% DMSO ‘extra dry’ (Acros Organics, Geel, Belgium) and 50% Pluronic F-127 in DMSO (20% w/v); Fluo-4 AM (1 mm) was dissolved in 100% DMSO. Prior to the experiment, stock solutions were thawed and diluted to final concentrations (di-8-ANEPPS, 20 μm: Fluo-4 AM, 10 μm) with Hepes buffer (in mm: MgCl2 1, CaCl2 2, NaCl 150, Hepes 10, glucose 10 and KCl 5). Cultured cells were stained first with 1 ml di-8-ANEPPS solution for 10 min at room temperature in the dark. The staining solution was removed and the preparation was mounted in the perfusion system. After a washing period of 15 min, the cells were loaded with 1 ml Fluo-4 AM solution for 20 min at room temperature. Finally, the staining solution was removed and the perfusion was started again.
Whole-mount preparations of the human submucous plexus or guinea-pig ileum myenteric plexus were stained at room temperature with Fluo-4 AM (30 μm in continuously gassed Krebs solution (in mm: 117 NaCl, 4.7 KCl, 1.2 MgCl2 6 H2O, 1.2 NaH2PO4, 25 NaHCO3, 2.5 CaCl2.2H2O and 11 glucose) for 120 min followed by 60 min superfusion of Krebs solution at room temperature in the recording chamber (Wunderlich et al. 2008; Mazzuoli & Schemann, 2009). The staining and recording procedure for the experiments using whole-mounts, where we electrically stimulated interganglionic fibre tracts, were as follows: We first recorded [Ca2+]i transients after Fluo-4 AM staining in control buffer and then in the presence of hexamethonium (200 μm) in the bath. Ganglia from which we recorded were then stained with Di-8-ANEPPS (Mazzuoli & Schemann, 2009) and electrically evoked signals were recorded still in the presence of hexamethonium. Finally, electrically evoked Di-8-ANEPPS signals were recorded after washout of hexamethonium.
The neuroimaging set-up has been described previously (Mazzuoli & Schemann, 2009). The main component of this set-up is a sensitive high-speed CCD camera (frame rates up to 2 kHz) with a relatively low spatial resolution (80 × 80 pixels) (NeuroCCD-SMQ, RedShirt Imaging, Decatur, USA). For the Fluo-4 AM measurements we used a FITC filterset (excitation: HC482/35, dichroic: BS506, emission: HC536/40, AHF Analysentechnik). For consecutive [Ca2+]i and VSD imaging, recordings of 2 s duration were performed at a frame rate of 1 kHz using a 40× objective (UAPO/340 Oil, Iris, Olympus).
Nicotine (100 μm) was applied to the neurones by pressure ejection from fine-tipped glass pipettes (100–400 ms pulse duration, 70 kPa), which resulted in a final tenfold dilution of the pipette content (Breunig et al. 2007). Hexamethonium (200 μm), ω-conotoxin GVIA (0.02 μm), ruthenium red (30 μm) or TTX (0.5 μm) were added directly to the perfusing buffer.
Electrical stimulation was performed with a Teflon-coated platinum electrode (25 μm diameter) placed directly over interganglionic nerve strands. We used single pulses (constant voltage, duration 0.6 ms) from a Grass SD9 stimulator.
Data analysis and statistics
All recordings were performed as single trial recordings. Data from camera pixels belonging to individual neurones was averaged and displayed as percentage change of resting fluorescence (ΔF/F). For [Ca2+]i measurements we identified the maximal value during the measurement period. Signals were only included if their amplitude was at least twice the background noise signal. Parametric or non-parametric analysis of variance (ANOVA) was used to compare amplitudes of maximal responses to nicotine application under various conditions (SigmaStat 3.11, Systat Software). Normally distributed data are given as mean value ± standard deviation while non-normally distributed data are reported as median values with the 25% and 75% quartiles given in brackets. The n numbers in the text always denote the number of neurones tested. A P value of less than 0.05 was considered as statistically significant. Traces of [Ca2+]i were not filtered. For the figures VSD signals were usually treated with a low-pass filter (300 Hz) to remove noise and a high-pass filter (3 Hz–30 Hz) to remove baseline drift due to dye bleaching.
Results
Features of [Ca2+]i signals during fast imaging
Nicotine application to primary cultures of guinea-pig myenteric neurones evoked two types of [Ca2+]i signals when using high frame rates of up to 1 kHz: the well-known slow rise in [Ca2+]i and in addition superimposed individual [Ca2+]i peaks (Fig. 1A and B). The [Ca2+]i peaks had a mean rise time of 9.4 ± 2.5 ms, an amplitude of 10.7 ± 4.5%ΔF/F (n = 12) and occurred at a frequency of 7.3 ± 4.5 Hz (n = 34). We observed similar [Ca2+]i peaks from neurones in whole-mount preparations of the human submucous plexus (Fig. 1D) and the guinea-pig myenteric plexus. Relatively low frame rates (<40 Hz), commonly used with [Ca2+]i, did not reveal the fast [Ca2+]i peaks (Fig. 1E).
Figure 1. Patterns of [Ca2+]i peaks and action potential discharge showed a high degree of similarity in individual neurones.
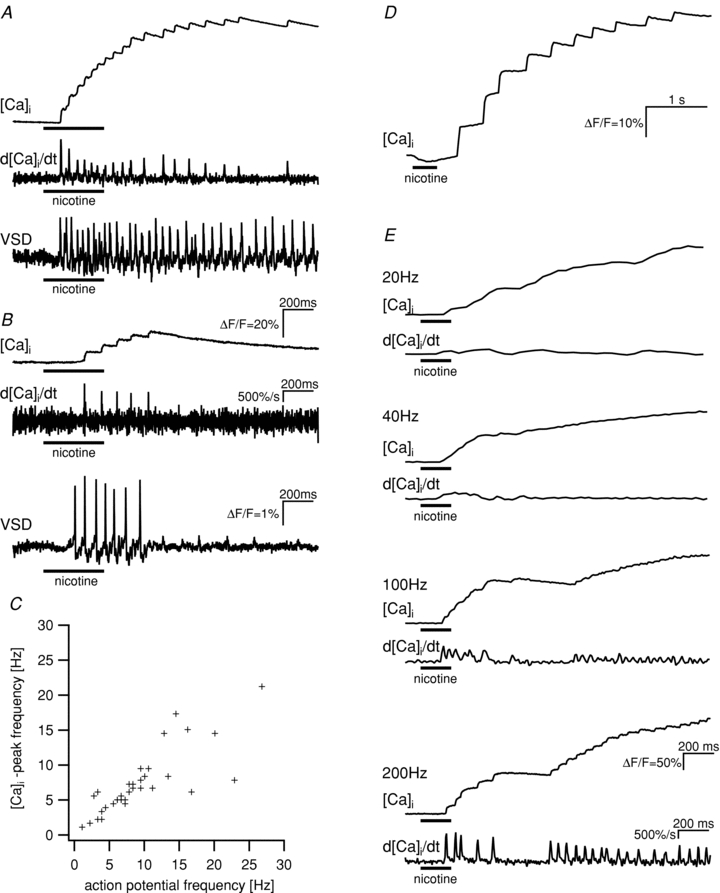
A and B show the response patterns to the application of nicotine (100 μm, horizontal bars) for the [Ca2+]i signal (top traces, scale bar in B), the first derivative of the calcium signals (middle traces, scale bar in B) and the change in membrane potential (bottom traces, scale bar in B) for two neurones. [Ca2+]i signals and changes in membrane potential were measured consecutively. Similarities between [Ca2+]i peaks and action potential discharge can be seen for long- (A) and short- (B) lasting spike discharge. C, frequency of action potentials and [Ca2+]i peaks is highly correlated in cultured myenteric neurones (Spearman's rank order correlation, P < 0.001). The frequencies were determined in separate, consecutive measurements of changes of membrane potential and [Ca2+]i in response to the application of nicotine in 34 neurones. D, change of [Ca2+]i in response to the application of nicotine in a neurone of a whole-mount preparation from the human submucous plexus. The signal shows the same characteristics as the signals from cultured guinea-pig myenteric neurones. E, nicotine evoked [Ca2+]i signals in a single neurone of guinea-pig myenteric plexus. While frame rates of 200 Hz allowed the detection of fast [Ca2+]i peaks, the lower frame rates of 20, 40 or 100 Hz only revealed slow [Ca2+]i transient or did not fully resolve the [Ca2+]i peaks, respectively. The first derivative of the calcium signals are shown below the [Ca2+]i traces.
Association between [Ca2+]i peaks and action potentials
Frequency and timing of the [Ca2+]i peaks suggested that the underlying signal represented action potentials. To analyse this further we consecutively recorded changes in [Ca2+]i and VSD in the same neurones in response to nicotine applications. Examples in Fig. 1 show a close similarity between patterns of [Ca2+]i peaks and action potential discharge in corresponding neurones. This is even more obvious when comparing the derivatives of the [Ca2+]i signals with the spike discharge pattern (Fig. 1). There was a significant correlation between the frequency of [Ca2+]i peaks and the frequency of action potentials (Fig. 1C, Spearman rank order correlation, correlation coefficient = 0.870, P < 0.001, n = 34).
In cultures of ENS neurones, we used single-pulse electrical stimulation of interconnecting nerve fibres to evoke single action potentials in the neuronal cell body and at the same time to follow the spread of action potentials along axons (Fig. 2). This allowed us to demonstrate that the discharge of a single action potential in the cell body or the axon is associated with a detectable [Ca2+]i peak. Relative to the time of electrical stimulation, the [Ca2+]i peak occurred after the action potential (Fig. 2) suggesting that the action potential triggered the [Ca2+]i signal.
Figure 2. Recording of single soma and axon action potentials with fast calcium imaging.
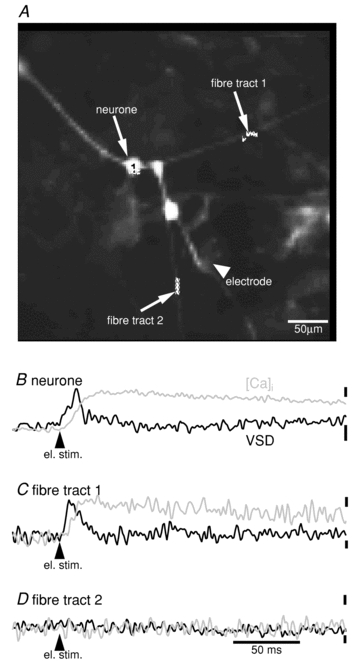
A, image of cultured ENS neurones acquired with a high-speed camera with a resolution of 80 × 80 pixels. Signals from the indicated regions are shown below. Traces for change in membrane potential (black traces) and [Ca2+]i (grey traces) were obtained in separate, consecutive measurements. B, the response of the neurone shown in A was evoked by electrical stimulation of nerve fibres (location of electrode also shown in A). The action potential is accompanied by a single [Ca2+]i peak. C, action potentials recorded on a nerve fibre. D, another fibre tract showed no response to electrical stimulation suggesting that the action potential did not invade this particular nerve trunk. Scale bar for the time in D applies to all traces. Scale bars to the right side of the traces show signal amplitude of [Ca2+]i signals (top bars, ΔF/F = 2%) and voltage-sensitive dye signals (ΔF/F = 1%).
Occurrence of [Ca2+]i peaks requires action potential discharge, Ca2+ entry through N-type channels and release from intracellular Ca2+ stores
TTX (0.5 μm) abolished nicotine-evoked action potentials as well as [Ca2+]i peaks and both recovered after washout of TTX (Fig. 3A and B; P < 0.05, n = 10). Although the [Ca2+]i peaks were blocked in the presence of TTX, nicotine still evoked the slow [Ca2+]i rise with a much smaller amplitude (Fig. 3A). The median amplitude of the nicotine-evoked slow [Ca2+]i rise was 48.4% before and 8.2% during TTX perfusion (P < 0.05, n = 12).
Figure 3. Blockade of fast sodium channels with tetrodotoxin abolished action potentials and [Ca2+]i peaks in response to the application of nicotine.
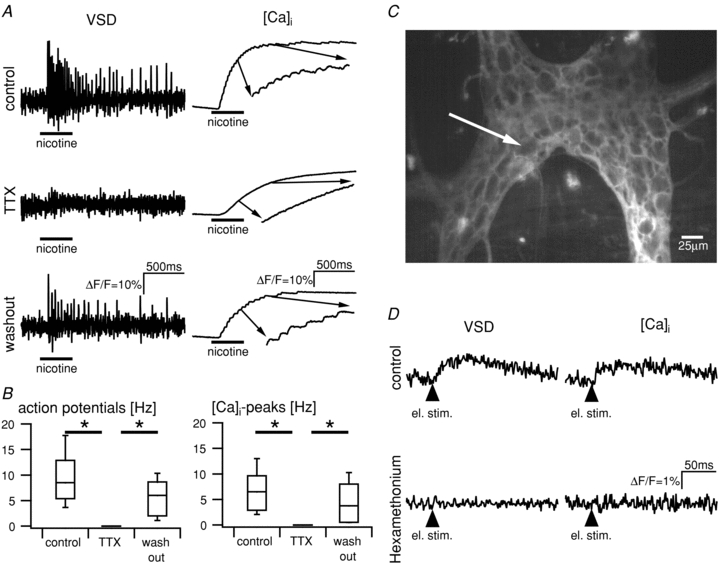
A, example traces of a cultured neurone show the response to nicotine application. Traces for the change of membrane potential (left) and change of [Ca2+]i (right) were obtained during separate, consecutive measurements. The inset shows the indicated part of the calcium trace at 5× magnification. Top traces: under control conditions, nicotine application (100 μm, black bar) evoked a discharge of action potentials and the generation of [Ca2+]i peaks. Middle traces: TTX (0.5 μm) blocked action potentials as well as [Ca2+]i peaks. A slow rise of the calcium concentration is still present. This may be explained by the influx of calcium through the ligand-gated nicotinic channel. Bottom traces: action potentials and [Ca2+]i peaks are restored after washout of TTX. Scale bars in the lower traces refer to all traces in A. B, summarized data from 10 neurones show a complete, reversible block of action potentials (left) and [Ca2+]i peaks (right) in TTX (0.5 μm) (Kruskal–Wallis one-way ANOVA). C, image of a Di-8-ANEPPS-stained guinea-pig myenteric ganglion acquired with a high-resolution camera. D, single pulse electrical stimulation of an interconnecting fibre strand evoked a fast synaptic response in the neurone marked by the arrow in C. Voltage-sensitive dye recording reveals a fEPSP in the top left trace. The fEPSP is associated with a [Ca2+]i transient (top right trace). Both signals are blocked by hexamethonium (bottom traces) which blocks the action of acetylcholine – the primary mediator of fEPSPs in the ENS. Scale bar applies to all traces.
In whole-mount myenteric plexus preparations, both the amplitude and frequency of nicotine-evoked [Ca2+]i peaks were significantly reduced by the N-type Ca2+ channel blocker ω-conotoxin GVIA (4 [3/5]%ΔF/F versus 2 [1.3/3.5]%ΔF/F; 8 [4/12] Hz versus 3 [1/4] Hz; n = 19). The remaining [Ca2+]i peaks as well as the remaining slow [Ca2+]i rise were abolished in the presence of ruthenium red, which inhibits calcium release from ryanodine-sensitive intracellular Ca2+ stores. Ruthenium red did not affect nicotine-evoked spike discharge as recorded with VSD imaging (1.6 [1.0/2.19] Hz versus 1.1 [0.5/2.1] Hz; n = 25).
Fast EPSPs are associated with [Ca2+]i transients
The above results showed that action potentials are associated with [Ca2+]i peaks. We discovered that fast [Ca2+]i imaging can be also used to resolve subthreshold fast synaptic potentials. This is concluded from experiments in guinea-pig whole-mount myenteric plexus preparations where we recorded a small, transient rise of [Ca2+]i in neurones in response to single-pulse electrical stimulation of interganglionic fibre tracts (ΔF/F = 2.1 ± 1.7%, n = 43, 7 animals). These [Ca2+]i transients were significantly slower than the action potential-associated [Ca2+]i peaks (rise time to maximum: 33 ± 20 ms, n = 24, t test, P < 0.001). Consecutive [Ca2+]i and VSD recordings revealed that these signals were fEPSPs and fully abolished in hexamethonium, which blocks the action of acetylcholine as the primary transmitter for fEPSPs in the ENS (Fig. 3D).
Discussion
The present study demonstrated that fast [Ca2+]i imaging revealed [Ca2+]i peaks associated with actions potentials in single trial recordings. High sample frequencies in combination with sensitive cameras even revealed postsynaptic [Ca2+]i transients as a result of fast synaptic transmission. The [Ca2+]i peaks or transients were recorded in enteric neurones in response to nicotine application or electrical stimulation of interganglionic fibre tracts. The [Ca2+]i peaks had rise times of around 10 ms which means that imaging frequencies of at least 200 Hz are required to analyse the peaks and reliably calculate action potential frequencies from [Ca2+]i measurements (sampling theorem). The correlation between [Ca2+]i peak and action potential frequencies and the total block of [Ca2+]i peaks by the inhibition of fast sodium channels with TTX strongly suggested that each action potential was associated with a fast change of [Ca2+]i. Generation of [Ca2+]i peaks required Ca2+ entry through N-type voltage-gated Ca2+ channels and Ca2+ release from intracellular stores. The finding that ruthenium red did not change nicotine-evoked spike discharge (VSD imaging) may rule out possible unspecific actions. These results suggest that recording fast [Ca2+]i transients may be a way to also detect kinetics of release from intracellular Ca2+stores. Using sampling frequencies of up to 32.4 Hz, Bayguinov et al. (2010) illustrated TTX-sensitive calcium transients in myenteric neurones. The slower time course of these calcium transients suggests that they were caused by bursts of actions potentials rather than by single spikes.
We observed a strong association between action potential frequency and the frequency of [Ca2+]i with an overall correlation coefficient of 0.87. The deviation from a 1:1 relation at higher frequencies may have two reasons. Firstly, an on average higher spike discharge to nicotine application was often caused by a high-frequency burst-like discharge at the beginning of the response. This made it more difficult to distinguish at that point of the response [Ca2+]i peaks from the underlying [Ca2+]i transients (which were due to calcium entry independent of spike discharge). Secondly, the spike discharge pattern in response to repeated nicotine applications, although very similar, is not identical; action potential discharge rate varied by 5.8% (Schemann et al. 2010).
Our finding that [Ca2+]i peaks corresponded to action potentials was based on successive recordings from the same neurones. Admittedly, simultaneous recordings of calcium and voltage signals would have been optimal but were not possible with the available imaging equipment. Such a study has been performed recently in brain slices and neuronal cultures, showing that changes in [Ca2+]i primarily reflected action potential discharge (Vogt et al. 2011).
The experiments in whole-mount preparations of human and guinea-pig intestines show that the observed [Ca2+]i peaks were neither an exclusive feature of guinea-pig enteric neurones nor are the recordings restricted to cultured neurones. High-speed calcium imaging did not only allow detection of single action potentials. We also demonstrated that this approach can be used to record calcium transients during a subthreshold fEPSP.
We have used voltage-sensitive dyes extensively to study the neurophysiology of the human ENS (Schemann et al. 2002). Sample frequencies of 1 kHz are required to reliably record action potentials with voltage-sensitive dyes. Although we optimized the technique over the years allowing us to record for as long as 15 s, phototoxicity remains a limitation. The finding that [Ca2+]i peaks reflect action potential discharge extends the application of more commonly available calcium imaging set-ups to record neuronal spikes.
Glossary
Abbreviations
- ENS
enteric nervous system
- VSD
voltage-sensitive dye
Author contributions
Design of the experiments: M.S., P.V.B. Performing the experiments: M.M., G.M., K. Michel, K. Mueller. Writing and revising the article: K. Michel, M.S. All authors approved the final version.
Present address
M. Michaelis: Carl-Ludwig-Institute for Physiology, Universität Leipzig, Leipzig, Germany.
References
- Bayguinov PO, Hennig GW, Smith TK. Calcium activity in different classes of myenteric neurons underlying the migrating motor complex in the murine colon. J Physiol. 2010;588:399–421. doi: 10.1113/jphysiol.2009.181172. [DOI] [PMC free article] [PubMed] [Google Scholar]
- Breunig E, Michel K, Zeller F, Seidl S, Weyhern CW, Schemann M. Histamine excites neurones in the human submucous plexus through activation of H1, H2, H3 and H4 receptors. J Physiol. 2007;583:731–742. doi: 10.1113/jphysiol.2007.139352. [DOI] [PMC free article] [PubMed] [Google Scholar]
- Hillsley K, Kenyon JL, Smith TK. Ryanodine-sensitive stores regulate the excitability of AH neurons in the myenteric plexus of guinea-pig ileum. J Neurophysiol. 2000;84:2777–2785. doi: 10.1152/jn.2000.84.6.2777. [DOI] [PubMed] [Google Scholar]
- Mazzuoli G, Schemann M. Multifunctional rapidly adapting mechanosensitive enteric neurons (RAMEN) in the myenteric plexus of the guinea pig ileum. J Physiol. 2009;587:4681–4694. doi: 10.1113/jphysiol.2009.177105. [DOI] [PMC free article] [PubMed] [Google Scholar]
- Schemann M, Hafsi N, Michel K, Kober OI, Wollmann J, Li Q, Zeller F, Langer R, Lee K, Cellek S. The β3-adrenoceptor agonist GW427353 (Solabegron) decreases excitability of human Enteric neurons via release of somatostatin. Gastroenterology. 2010;138:266–274. doi: 10.1053/j.gastro.2009.09.046. [DOI] [PubMed] [Google Scholar]
- Schemann M, Michel K, Peters S, Bischoff SC, Neunlist M. Cutting-edge technology. III. Imaging and the gastrointestinal tract: mapping the human enteric nervous system. Am J Physiol Gastrointest Liver Physiol. 2002;282:G919–G925. doi: 10.1152/ajpgi.00043.2002. [DOI] [PubMed] [Google Scholar]
- Vanden Berghe P, Bisschops R, Tack J. Imaging of neuronal activity in the gut. Curr Opin Pharmacol. 2001;1:563–567. doi: 10.1016/s1471-4892(01)00097-2. [DOI] [PubMed] [Google Scholar]
- Vanden Berghe P, Kenyon JL, Smith TK. Mitochondrial Ca2+ uptake regulates the excitability of myenteric neurons. J Neurosci. 2002;22:6962–6971. doi: 10.1523/JNEUROSCI.22-16-06962.2002. [DOI] [PMC free article] [PubMed] [Google Scholar]
- Vanden Berghe P, Tack J, Andrioli A, Missiaen L, Janssens J. Receptor-induced Ca2+ signaling in cultured myenteric neurons. Am J Physiol Gastrointest Liver Physiol. 2000;278:G905–G914. doi: 10.1152/ajpgi.2000.278.6.G905. [DOI] [PubMed] [Google Scholar]
- Vogt KE, Gerharz S, Graham J, Canepari M. High-resolution simultaneous voltage and Ca2+ imaging. J Physiol. 2011;589:489–494. doi: 10.1113/jphysiol.2010.200220. [DOI] [PMC free article] [PubMed] [Google Scholar]
- Wood JD. Cellular Neurophysiology of Enteric Neurons. In: Johnson LR, editor. Physiology of the Gastrointestinal Tract. Academic Press; 2006. pp. 629–665. [Google Scholar]
- Wunderlich JE, Needleman BJ, Chen Z, Yu JG, Wang Y, Grants I, Mikami DJ, Melvin WS, Cooke HJ, Christofi FL. Dual purinergic synaptic transmission in the human enteric nervous system. Am J Physiol Gastrointest Liver Physiol. 2008;294:G554–G566. doi: 10.1152/ajpgi.00500.2007. [DOI] [PubMed] [Google Scholar]