

Abstract
Non-technical summary
Diseases, genetic defects, or ionic imbalances can alter the normal electrical activity of cardiac myocytes causing an anomalous heart rhythm, which can degenerate to ventricular fibrillation (VF) and sudden cardiac death. Well-recognized triggers for VF are aberrations of the cardiac action potential, known as early afterdepolarizations (EADs). In this study, combining mathematical modelling and experimental electrophysiology in real-time (dynamic clamp), we investigated the dependence of EADs on the biophysical properties of the L-type Ca2+ current (ICa,L) and identified modifications of ICa,L properties which effectively suppress EAD. We found that minimal changes in the voltage dependence of activation or inactivation of ICa,L can dramatically reduce the occurrence of EADs in cardiac myocytes exposed to different EAD-inducing conditions. This work assigns a critical role to the L-type Ca2+ channel biophysical properties for EADs formation and identifies the L-type Ca2+ channel as a promising therapeutic target to suppress EADs and their arrhythmogenic effects.
Abstract
Sudden cardiac death (SCD) due to ventricular fibrillation (VF) is a major world-wide health problem. A common trigger of VF involves abnormal repolarization of the cardiac action potential causing early afterdepolarizations (EADs). Here we used a hybrid biological–computational approach to investigate the dependence of EADs on the biophysical properties of the L-type Ca2+ current (ICa,L) and to explore how modifications of these properties could be designed to suppress EADs. EADs were induced in isolated rabbit ventricular myocytes by exposure to 600 μmol l−1 H2O2 (oxidative stress) or lowering the external [K+] from 5.4 to 2.0–2.7 mmol l−1 (hypokalaemia). The role of ICa,L in EAD formation was directly assessed using the dynamic clamp technique: the paced myocyte's Vm was input to a myocyte model with tunable biophysical parameters, which computed a virtual ICa,L, which was injected into the myocyte in real time. This virtual current replaced the endogenous ICa,L, which was suppressed with nifedipine. Injecting a current with the biophysical properties of the native ICa,L restored EAD occurrence in myocytes challenged by H2O2 or hypokalaemia. A mere 5 mV depolarizing shift in the voltage dependence of activation or a hyperpolarizing shift in the steady-state inactivation curve completely abolished EADs in myocytes while maintaining a normal Cai transient. We propose that modifying the biophysical properties of ICa,L has potential as a powerful therapeutic strategy for suppressing EADs and EAD-mediated arrhythmias.
Introduction
Early afterdepolarizations (EADs) are transient reversals of normal repolarization (i.e. positive dV/dt), occurring in late phase 2 or phase 3 of the cardiac action potential (AP). These events, observable both at the cellular and tissue level, are recognized as triggers of cardiac arrhythmias (Sato et al. 2009; Weiss et al. 2010b). When EADs propagate through cardiac tissue, they can generate premature heart beats, ventricular tachycardia (VT) and ventricular fibrillation (VF), common causes of sudden cardiac death in a variety of clinical settings.
EADs classically occur during bradycardia under conditions of reduced repolarization reserve, due to either abnormally decreased outward currents, or increased inward currents, or both. The predominant inward currents in ventricular myocytes which have been implicated in EAD genesis are the persistent INa (Maltsev et al. 1998), INCX (Volders et al. 1997; Szabo et al. 1994) and ICa,L (January & Riddle, 1989). Previous work has shown that reactivation of the L-type Ca2+ current (ICa,L) during phase 2 and 3 of the action potential (AP) plateau plays a major role in EAD formation (January et al. 1988), although other factors are also important (Weiss et al. 2010a). Most EADs are initiated between −40 and 0 mV (Fig. 1), corresponding to the range of membrane potentials where the steady-state activation and inactivation curves of ICa,L overlap, often referred to as the ‘window current’ region (January & Riddle, 1989; Antoons et al. 2007a). As the AP repolarizes into this voltage ‘window’, a fraction of the L-type Ca2+ channels not inactivated may be available for reactivation to generate the upstroke of the EAD. In this study, we sought to determine the relevance of ICa,L in EAD formation, and investigated whether EAD suppression can be achieved solely by manipulating ICa,L without altering other ionic conductances or signalling pathways. We analysed whether EAD formation can be suppressed by minimal perturbation of the biophysical properties of L-type Ca2+ channels affecting the ICa,L window voltage region. Since it is difficult to control these properties experimentally with any degree of precision, we adopted a hybrid biological–computational approach using the dynamic clamp technique (Dorval et al. 2001; Berecki et al. 2005, 2006, 2007; Wilders, 2006). This allowed us to replace the native ICa,L of the myocyte with a computed virtual ICa,L with programmable properties. Our findings show that EAD formation is highly sensitive to ICa,L properties and properties of the window region (such as the slopes of the activation and inactivation curves (Tran et al. 2009)), such that subtle shifts in the voltage dependence of steady-state ICa,L activation or inactivation can abolish EADs. Moreover, these changes are predicted to have no significant effects on the amplitude or kinetics of the intracellular Ca2+ transient, suggesting that pharmacological or genetic manipulation of the voltage-dependent properties of ICa,L could have therapeutic potential for suppressing EAD-mediated arrhythmias without adversely affecting excitation–contraction coupling.
Figure 1. Oxidative stress and hypokalaemia generate EADs in dissociated rabbit cardiomyocytes.

A, representative AP recordings in current-clamped ventricular myocytes stimulated at a pacing cycle length of 5 s. EADs, absent in control conditions, were consistently induced by addition of 600 μmol l−1 H2O2 to the bath solution or by reducing extracellular [K+] from 5.4 mmol l−1 to 2.7 mmol l−1 (hypokalaemia). The histogram to the left of each trace shows the distribution of action potential duration measured at 90% repolarization (APD90) for each condition. B, action potentials in the dotted box in A are shown on an expanded scale (arrows point to EADs). C, percent of action potentials displaying EADs in Control, H2O2 and hypokalaemia conditions.
Methods
Ethical approval
All animal protocols were approved by the UCLA Institutional Animal Care and Use Committee and conformed to the Guide for the Care and Use of Laboratory Animals published by the US National Institutes of Health.
Electrophysiology
Ventricular myocytes were isolated from New Zealand White rabbits as previously described (Mahajan et al. 2008a). All animals were anaesthetized with 50 mg ml−1 intravenous pentobarbital, before excision of the hearts, which were subsequently submerged in Ca2+-free Tyrode solution containing (in mmol l−1): 136 NaCl, 5.4 KCl, 1 MgCl2, 0.33 NaH2PO4, 10 glucose, and 10 Hepes, adjusted to pH 7.4. The hearts were cannulated and perfused retrogradely on a Langendorff apparatus with Ca2+-free Tyrode buffer containing 1.65 mg ml−1 collagenase and 0.8 mg ml−1 bovine serum albumin for 30–40 min. After washing out the enzyme solution, the hearts were swirled in a beaker to dissociate cells. The Ca2+ concentration was gradually increased to 1.8 mmol l−1, and the cells were stored at room temperature. This procedure typically yielded 50% rod-shaped Ca2+-tolerant myocytes. Only Ca2+-tolerant, rod-shaped ventricular myocytes with clear striations were randomly selected for electrophysiological studies within 8 h of isolation. All recordings were measured with AxoPatch 200B (Axon Instruments). Whole-cell patch-clamp recordings (in current or voltage clamp mode) were performed at 34–36°C using pipettes of 1–2 MΩ. The intracellular solution contained (in mmol l−1): 110 potassium aspartate, 30 KCl, 5 NaCl, 10 Hepes, 0.1 EGTA, 5 MgATP, 5 creatine phosphate, 0.05 cAMP adjusted to pH 7.2. For ICa,L recordings the solutions were as described above, except that K+ was replaced with Cs+ to abolish K+ conductance and 10 μmol l−1 TTX was added to the extracellular solution to block Na+ conductance. The L-type-specific Ca2+ current was determined by subtracting the current after 20 μmol l−1 nifedipine from the total current. Data were acquired and analysed using custom-made software (G-Patch, Analysis). Currents were filtered at 1/5 of the sampling frequency. The steady-state activation curves were constructed by dividing the peak I–V curve by the driving force to calculate conductance (G) and dividing G by Gmax. The inactivation curves were constructed by plotting the normalized peak current during a test pulse at 10 mV following a 300 ms inactivating pulse at various voltages. The slope and half-activation/inactivation potential of these curves were estimated by fitting to a Boltzmann distribution, and these parameters were used to constrain the dynamic clamp model for both control and H2O2 conditions. These two versions of the model were then implemented for Dynamic Clamp in RTXI (http://www.rtxi.org) (Lin et al. 2010). Sampling/computation frequency was 10 kHz.
Intracellular calcium measurements
Myocytes were loaded with 10 μmol l−1 Fluo4-AM (Molecular probes) for 30 min at room temperature. Cells were then washed twice in regular Tyrode solution and placed in a heated chamber at 34–36°C for fluorescence and electrophysiology measurements. Intracellular calcium (Cai) transients were recorded using a CMOS camera (Silicon Imaging SI-1300, Niskayuna, NY, USA).
Dynamic clamp
The ionic conductances included in the model are ICa,L, the fast sodium current INa, the Na+–K+ pump current INaK, the Na+–Ca2+ exchange current INCX, and the Ca2+-dependent slow component of the delayed rectifier potassium channel IKs. The intracellular Ca2+ concentration was divided into four compartments, i.e. submembrane Ca2+ (Cs), cytosolic Ca2+ (Ci) and network SR Ca2+ and junctional SR Ca2+. The average submembrane Ca2+ concentration, Cs, is used to compute Ca2+-dependent inactivation in the ICa,L formulation. The Ca2+ flux into the cell due to ICa,L is given by (Mahajan et al. 2008b):
| (1) |
where JCa is the current flux into the cell via L-type Ca2+ channels, gCa is determined by fitting to the nifedipine-sensitive current traces measured under voltage clamp, Po is the probability of finding an L-type Ca2+ channel in the open state, and iCa is the driving force for Ca2+ given by:
| (2) |
where Cs is the submembrane concentration in units of mmol l−1, PCa (0.00054 cm/s) is the Ca channel permeability and V is the membrane voltage, F is the Faraday constant, and T is temperature. In order to facilitate shifts of the activation and inactiation curves, we replaced the Markovian calcium channel open probability Po (Mahajan et al. 2008b) with the Hodgkin–Huxley formulation from the Luo–Rudy dynamic model (Luo & Rudy, 1994), where Po is formulated as:
where d is the voltage-dependent activation gate, f is the voltage-dependent inactivation gate and q is the Ca2+-dependent inactivation gate. The steady states of these gating variables as functions of voltage are formulated in the following manner:
| (3) |
| (4) |
| (5) |
| (6) |
| (7) |
where τd and τf are the time constants of d gate and f gate respectively, dhalf is the voltage at half maximum of activation/inactivation (fhalf), dslope is the slope factor of the activation curve, pdest is the non-inactivating pedestal of the inactivation gate, Cs is the submembrane Ca concentration in units of mM, Cst is the affinity for Ca of the inactivation gate, and a1, a2, b1, b2, b3, and b4 are additional factors used for fitting. All the parameters listed in the equations are fitted to our experimental data (the fitting parameters are shown in online supplemental materials). The Ca2+ cycling is the same as that in the rabbit ventricular myocyte model (Mahajan et al. 2008b).
Results
Oxidative stress-induced and hypokalaemia-induced EADs in isolated rabbit ventricular myocytes
To determine the relevance of ICa,L biophysical properties to EAD formation and/or suppression, we used two methods to induce EAD in whole-cell patch-clamped isolated rabbit ventricular myoyctes: (i) oxidative stress, by exposure to 600 μmol l−1 H2O2 (Xie et al. 2009), or (ii) hypokalaemia, by lowering extracellular [K+] (from 5.4 to 2.0–2.7 mmol l−1). Myocytes were superfused in the recording chamber at 34–36°C, and stimulated at a pacing cycle length (PCL) of 5 s (Fig. 1). Under current clamp, both H2O2 (n = 14) and hypokalaemia (n = 8) prolonged the APD significantly and consistently produced EADs in ∼70% of paced APs (Fig. 1A and B) within 5–10 min. In our analysis, we individually inspected each action potential for EAD occurrence, defined as well-resolved deflections of the voltage with a positive dV/dt during late phase 2 or phase 3 of the AP. EAD morphology varied among experiments and also within the same action potential as in Fig. 1B (under hypokalaemia). Typically, EADs exhibited a positive voltage deflection of ≥5 mV with durations (from inflection point to peak) between 30 and 150 ms).
Among other effects, oxidative stress with H2O2 is known to promote EADs by activating Ca2+–calmodulin-dependent protein kinase II (CaMKII) (Xie et al. 2009), which alters ICa,L (Dzhura et al. 2000) and induces late INa (Wagner et al. 2006; Wagner et al. 2011). To characterize how H2O2 altered ICa,L properties under our experimental conditions, we recorded the nifedipine-sensitive Ca2+ current in voltage-clamped isolated myocytes before and after exposure to 600 μmol l−1 H2O2 (n = 5) (Fig. 2): in addition to an overall slowing of inactivation (Fig. 2A and B), H2O2 shifted the peak of the current–voltage (I–V) relationship by −5 mV as shown in Fig. 2C. By constructing steady-state activation and inactivation curves, we found that H2O2 produced an ∼−5 mV shift of the steady state half-activation potential (V1/2,act), accompanied by an ∼+5 mV shift in the steady state half-inactivation potential (V1/2,inact) (Fig. 2D). Effectively, H2O2 increased the height of the ICa,L window current region, changes which are expected to promote EAD formation (Antoons et al. 2007b; Qi et al. 2009; Tran et al. 2009).
Figure 2. H2O2 alters both the time-dependent and steady-state properties of ICa,L in rabbit ventricular myocytes.

A, voltage clamp recordings of nifedipine (20 μmol l−1) sensitive ICa,L in response to depolarizing pulses from −40 mV (HP = −80 mV), under control conditions (black) or after 2 min of exposure to 600 μmol l−1 H2O2 (red). B, voltage clamp recordings of nifedipine-sensitive ICa,L in response to a two-pulse protocol from a holding potential of −90mV, under control conditions (black) or after 2 min of exposure to 600 μmol l−1 H2O2 (red). The inactivating pulse was 300 ms to approximate the duration of a normal action potential. C, the I–V relationship for ICa,L (normalized to the peak current) under control conditions (black circles, n = 4) and H2O2 (red circles, n = 5). Note the negative shift of the I–V curve in H2O2. D, mean steady-state activation and inactivation curves for ICa,L in control (black circles, n = 4) and H2O2 conditions (red diamonds, n = 5). Note that the H2O2-induced shift of steady-state curves results in a higher ICa,L window area. External solution (mmol l−1): 136 NaCl, 5.4 CsCl, 1 MgCl2, 0.33 NaH2PO4, 1.8 CaCl2, 10 glucose, 10 Hepes, and 10 μmol l−1 TTX, pH 7.4. Pipette solution (in mmol l−1): 100 caesium aspartate, 30 CsCl, 5 NaCl, 10 Hepes, 0.1 EGTA, 5 MgATP, 5 creatine phosphate, 0.05 cAMP, pH 7.2. Temperature = 35–37°C.
Role of oxidative stress-mediated ICa,L alterations in EAD generation
To understand how the H2O2-induced changes in ICa,L described above contributed to EAD formation, we next used the dynamic clamp technique (Tan & Joyner, 1990) to replace the myocyte's native ICa,L with a virtual ICa,L with programmable properties. The principle of the dynamic clamp operation is illustrated in Fig. 3A. The recorded membrane potential of a current-clamped myocyte (Vm) is fed into a Linux-based computer with the Real-time Experimental Interface (RTXI) software (Dorval et al. 2001) running the UCLA ventricular myocyte AP model (Mahajan et al. 2008b). The model computes, in real time, the macroscopic L-type Ca2+ channel current, which is injected continuously into the myocyte, in turn changing its membrane potential. This cycle (Vm sampling →ICa,L computation →ICa,L injection →Vm sampling …) is iterated at 10 kHz, creating a dynamic, bidirectional relationship between the model and the cell.
Figure 3. The dynamic patch clamp implements a virtual Ca2+ current computed with detailed Ca2+ cycling dynamics.

A, diagram of the dynamic clamp system. A ventricular myocyte is whole-cell patch-clamped with an amplifier in current-clamp mode. The myocyte's Vm signal (red arrow) is digitized and input to a computer running a cardiac action potential model (Mahajan et al. 2008) containing macroscopic Hodgin–Huxley (HH)-type formulations for five conductances (ICa,L; the fast Na+ channel INa; the Na+/K+ pump INaK; the Na+/Ca2+ exchanger INCX; and the Ca2+-dependent K+ rectifier IKs) and [Ca2+] in four discrete cellular compartments (Cs, Ci, Cjp and Cj). Ionic conductances and concentrations can be fine-tuned by altering model parameters online. The calculated ionic conductances can be output in any combination to produce ICommand. In this case, ICommand = ICa,L (blue arrow). ICommand is combined with a pacing AP stimulus and converted to analog before being input to the amplifier to be injected into the clamped myocyte. This alters the myocyte Vm, which is in turn sampled for the next computation. Thus, there is a dynamic, bidirectional relationship between Vm and model conductance output, at a sampling/computation frequency of 10 kHz. B, the predicted ICa,L conductance from the model in panel A (red) accurately predicts a current similar in amplitude and kinetics to experimentally recorded ICa,L from rabbit cardiomyocytes (black) in response to depolarizing pulses from a holding potential of −40 mV.
The virtual ICa,L computed in the AP model was tuned to fit experimental recordings of native ICa,L recorded from rabbit ventricular myocytes (Fig. 3B). In addition to computing ICa,L, the model also computes all other elements of Cai cycling in the UCLA rabbit ventricular myocyte model (Mahajan et al. 2008b), which is critical for simulating the effects of intracellular Ca2+ on Ca2+-dependent inactivation of the virtual ICa,L being injected into the myocyte. Thus, this model also generates a virtual intracellular Ca2+ transient, which showed good agreement with the intracellular Ca2+ transient recorded directly from a myocyte under control conditions (Fig. S1). The model computes Ca2+ concentrations in four discrete subcellular compartments (Fig. 3A), with the average submembrane Ca2+ concentration (Cs) used for the calculation of Ca2+-dependent inactivation of ICa,L, as described previously (Mahajan et al. 2008b). Although we initially used a seven-state Markovian description of ICa,L, we achieved equivalent accuracy of fitting the experimental ICa,L data with a Hodgkin–Huxley type ICa,L formulation, with the advantage that the biophysical parameters relevant to this work could be directly modified, such as V1/2,act and V1/2,inact, which determine the steady-state activation and inactivation properties of the injected virtual ICa,L.
In our experimental protocol utilizing the dynamic clamp technique, we first paced a rabbit ventricular myocyte to record the AP in the current clamp mode (Fig. 4A, trace 1). The recorded AP waveform was used to compute a virtual Cai transient, displayed below the AP trace (Fig. 4B, trace 1). The myocyte was then exposed to 600 μmol l−1 H2O2 until EADs appeared consistently (Fig. 4A, trace 2). Nifedipine (20 μmol l−1) was then added to block the native ICa,L, which markedly shortened APD and abolished EADs (Fig. 4, trace 3). Current injection by the dynamic clamp was then turned on, adding the virtual ICa,L computed from the UCLA rabbit ventricular AP cell model (Mahajan et al. 2008b), whose properties had been adjusted to simulate the previously analysed effects of H2O2 on ICa,L gating properties shown in Fig. 2. Injection of this ‘H2O2-modified’ virtual ICa,L effectively restored the electrical properties of the myocyte membrane, resulting in AP prolongation and the reappearance of EADs (Fig. 4, trace 4). The associated computed virtual Cai transients are shown in Fig. 4B.
Figure 4. Reconstitution of EADs by a virtual ICa,L and their suppression by shifting ICa,L V1/2 activation.

A, APs from rabbit ventricular myocytes recorded at a pacing cycle length of 5 s at 36–37°C in control conditions (1). Addition of 600 μmol l−1 H2O2 to the bath solution induced EADs within 5–10 min (2). Addition of 20 μmol l−1 nifedipine blocked the native ICa,L, shortened APD and abolished EADs (3). The dynamic clamp was then turned on to inject a virtual ‘ICa,L’ computed in real time (red trace), which restored EADs (4). Varying a single ICa,L parameter (V1/2 activation) by +5 mV to effectively reduce the ‘ICa,L window region’ abolished EADs, despite the presence of H2O2 (5). B, representative action potentials from each condition (numbered) in A and their corresponding virtual Cai transients. Note that both action potential duration and the shape and amplitude of the computed Cai transient in conditions (1) and (5) are similar. C, graphical representation of the change in the overlap of the activation and steady-state inactivation curves upon a +5 mV shift in the V1/2 of activation.
To investigate the sensitivity of EAD formation to the properties of the virtual ICa,L, we then shifted the voltage dependence of ICa,L activation (V1/2,act) by +5 mV, to resemble the normal steady activation curve prior to H2O2 exposure. This small shift, which effectively suppressed the ICa,L‘window’ current by reducing the overlap between the steady state activation and inactivation curves to (Fig. 4C), abolished EADs and restored the AP duration towards the control value (Fig. 4, trace 5). Moreover, the virtual Cai transient (Fig. 4B, trace 5) had similar amplitude and kinetics to that computed for the normal control AP (Fig. 4B, trace 1). Similar results were also achieved by shifting the voltage dependence of ICa,L inactivation (V1/2,inact) in the negative direction to reduce the window current region (not shown).
The overall results, summarized in Fig. 5, demonstrate that the small shifts in the V1/2 of steady-state activation and inactivation of ICa,L strongly suppress EAD formation. A +4 mV shift of the V1/2,act from −5 mV to −1 mV (Fig. 5A) shortened APD90 from 1197 ± 112 (n = 7) to 373 ± 15 ms (n = 4) (Fig. 5B) and suppressed EAD occurrence from 91 ± 4% to 24 ± 20% of paced APs (Fig. 5C). An additional +1 mV shift to 0 mV (Fig. 5A) shortened APD90 to 331 ± 15 ms (n = 6) (Fig. 5B) and further suppressed EAD occurrence to ∼2% (Fig. 5C). Similar results were achieved with small hyperpolarizing shifts in the V1/2,inact. A −3 mV shift from −17 mV to −20 mV (Fig. 5D) reduced APD90 to 696 ± 42 ms (n = 3) (Fig. 5E) and EAD occurrence to 52% (Fig. 5F). Further shifting V1/2,inact by an additional −2 mV to −22 mV (Fig. 5D) reduced APD90 to 488 ± 21 ms (n = 4) (Fig. 5E) and EAD occurrence to 10%.
Figure 5. EADs induced by oxidative stress are steeply dependent on V1/2 of activation and inactivation.

A, steady-state activation and inactivation of the virtual ICaL under control conditions (black) and with the V1/2 activation shifted by −1 (blue) or −5 mV (red) to partially simulate the effects of oxidative stress increasing the ICaL window region (cross-hatched). B and C, APD90 (B) and the percentage of AP's exhibiting EADs (C) corresponding to the virtual ICa,L activation/inactivation properties in A, when the respective currents were injected by the dynamic clamp into ventricular myocytes in the presence of 0.6 mmol l−1 H2O2 and 20 μmol l−1 nifedipine. The virtual ICa,L simulating oxidative stress caused marked AP prolongation and EADs, which were suppressed by returning the V1/2 activation towards normal (blue and black). D, steady-state activation and inactivation of the virtual ICa,L under control conditions (black) and with the V1/2 inactivation shifted by +3 (blue) or +5 mV (red) to partially simulate the effects of oxidative stress increasing the ICa,L window region (cross-hatched). E and F, APD90 (E) and the percentage of APs exhibiting EADs (F) corresponding to the virtual ICa,L activation/inactivation properties in A, when the respective currents were injected by the dynamic clamp into ventricular myocytes in the presence of 0.6 mmol l−1 H2O2 and 20 μmol l−1 nifedipine. The virtual ICa,L corresponding to the red curve simulating oxidative stress caused marked AP prolongation and EADs, which were suppressed by returning the V1/2 inactivation towards normal (blue and black).
Reducing ICa,L window current also suppresses hypokalaemia-induced EADs
To demonstrate that the results described above are not unique to H2O2-induced EADs, we also assessed the effectiveness of shifting V1/2,act or V1/2,inact at suppressing hypokalaemia-induced EADs. Lowering extracellular K+ from 5.4 to 2.0 mmol l−1 hyperpolarized the resting membrane potential to nearly −100 mV and induced EADs within 5 min (Fig. 1 and 6). As with H2O2-induced EADs, blocking ICa,L with 20 μmol l−1 nifedipine abolished EADs and shortened the action potential (not shown). Adding a virtual ICa,L with dynamic clamp prolonged APD90 to 2170 ± 190 ms (n = 6) (Fig. 6C and E, hatched bars) and reconstituted EADs in 83% of APs (Fig. 6D and F, hatched bars). A +5 mV depolarizing shift in the steady state activation curve from −1 to +4 mV shortened APD90 to 476 ± 39 ms (n = 3) (Fig. 6C, open bar) and reduced EAD occurrence to 0% (Fig. 6D, open bar). Similarly, a hyperpolarizing shift in the steady state inactivation curve from −18 to −23 mV shortened APD90 to 869 ± 167 ms (n = 3) and reduced EAD occurrence to 10% of APs.
Figure 6. EADs induced by hypokalemia are steeply dependent on V1/2 of activation and inactivation.
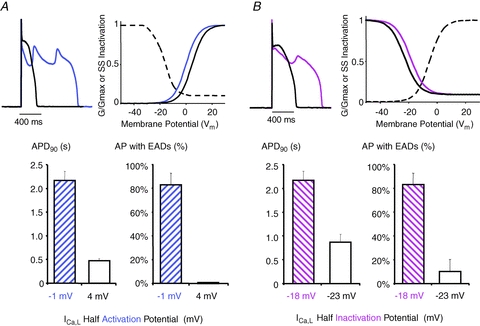
A, Under hypokalemic conditions (2.0 mM external K+), EADs (blue) were reconstituted in the presence of 20 mM nifedipine by injecting via the dynamic clamp a virtual ICa,L, with normal activation (blue) and inactivation (black) properties. Shifting the V1/2 of activation by +5 mV (black) to reduce the ICa,L window region reversed AP prolongation and abolished EADs. B, Similar effects were observed when V1/2 of inactivation was shifted by −5 mV to reduce the ICa,L window region. C, The +5 mV shift in the activation curve shortened and D, abolished EADs. E, The −5 mV shift in the inactivation curve also shortened APD90 and F, dramatically reduced EAD occurrence.
Discussion
It is widely accepted that EADs are important cellular triggers for VT and VF when repolarization reserve is reduced, as can occur clinically in acquired and congenital long QT syndromes and heart failure (Huffaker et al. 2004; Maruyama et al. 2011). In the present study, we used two different conditions, oxidative stress (H2O2) and hypokalaemia (Fig. 1), which reliably induce bradycardia-dependent EADs (positive dV/dt during phase 2 or 3) by different mechanisms in >90% of rabbit ventricular myocytes within 5–10 min of exposure. After blocking the native ICa,L with nifedipine, we used the dynamic clamp technique to inject a virtual ICa,L, which successfully reconstituted EADs. Moreover, the biophysical properties of the virtual ICa,L could be reprogrammed to explore its role in EAD formation. Our major findings are: (i) EAD formation is very sensitive to small shifts in the voltage sensitivity of steady state activation and inactivation of ICa,L, such that a +5 mV depolarizing shift in V1/2,act, or a −5 mV hyperpolarizing shift in V1/2,inact powerfully suppressed EAD formation (Figs 4–6); (ii) these small shifts were predicted to have minimal effects on peak ICa,L during the AP, such that the Cai transient, hence excitation–contraction coupling and contractility, remain normal (Fig. 4B); (iii) the same strategy was effective at suppressing EADs generated by two different mechanisms (Figs 4 and 6): oxidative stress in which CaMKII activation potentiating inward Na+ and Ca2+ currents plays a critical role (Dzhura et al. 2000; Anderson, 2004; Wagner et al. 2006; Xie et al. 2009; Koval et al. 2010; Wagner et al. 2011), and hypokalaemia, in which decreased outward K+ currents play the major role (Sato et al. 2010). Moreover, the degree of hypokalaemia used in this study is clinically relevant to values associated with EAD-mediated arrhythmias in patients (Osadchii, 2010).
These findings have therapeutic implications, namely that novel agents which alter the voltage dependence and/or kinetics of ICa,L could be developed to suppress EAD-mediated arrhythmias without adversely depressing excitation–contraction coupling.
Sensitivity of EADs to ICa,L properties
In the present study, we analysed the effects of small shifts in the V1/2,act and V1/2,inact on EAD formation, as a convenient way to suppress ICa,L reactivation in the window voltage region. However, ICa,L reactivation causing EADs during AP repolarization is not solely dependent on V1/2,act and V1/2,inact, but instead is a complex function of many ICa,L parameters juxtaposed with other factors, such as K+ currents influencing the speed of repolarization (Tran et al. 2009). With respect to ICa,L, other parameters in addition to V1/2,act and V1/2,inact influence ICa,L reactivation during repolarization, including the maximal L-type Ca2+ current conductance; the steepness (slope factor) of voltage-dependent activation and inactivation; the time constants of activation, inactivation (both Ca2+ dependent and voltage dependent), and recovery from inactivation; and the amplitude of the non-inactivating pedestal current. These factors can be combined into a single mathematical expression giving a necessary condition for EADs (Tran et al. 2009). In the present study, our modifications to the virtual ICa,L assumed that all of these other factors remained constant, allowing us to examine the isolated effects of V1/2,act and V1/2,inact. Thus, a major advantage of the dynamic clamp approach is that the virtual ICa,L can be programmed to simulate all of the effects that a candidate agent has on these ICa,L properties, once they have been characterized experimentally. The appropriately reshaped virtual ICa,L can then be evaluated to determine whether or not it suppresses EADs in real myocytes when introduced by the dynamic clamp technique.
Limitations
Although the dynamic clamp provides a technique to systematically dissect the role of key ionic currents such as ICa,L in EAD formation, an important limitation is that a virtual ICa,L does not trigger SR Ca2+ release, so it is not possible to directly test the effects of a modified virtual ICa,L on the Cai transient or cell shortening. This limitation was partially offset by using an AP model incorporating detailed Ca2+ cycling dynamics which allowed us to make predictions about the Cai transient, validated by experimental recordings of the Cai transient in rabbit ventricular myocytes using a Ca2+-sensitive fluorescent dye (Fig. S1). In fact, the lack of Ca2+ entering the cell during the virtual ICa,L injection also provides an advantage, allowing us to distinguish the purely electrical effects of ionic currents from their biochemical consequences (Ca2+-mediated signalling). Thus, these results demonstrate that EADs can occur in the absence of Ca2+ influx or SR Ca2+ release and can be a purely electrical phenomenon. For example, we computed the virtual Na+–Ca2+ exchange current accompanying the virtual Cai transient in our model, but chose not to inject this current into the myocyte via the dynamic clamp, since our initial goal was to investigate whether ICa,L alone was sufficient to reconstitute EADs without other Ca2+-sensitive currents. Furthermore, through the dynamic clamp, the contributions of other currents to EAD formation can be analysed systematically, assuming they have been accurately formulated in the model.
Therapeutic implications
Our study demonstrates ‘proof-of-concept’ for a hybrid biological–computational approach designed to predict how modifications of ion channel properties affect cellular arrhythmogenic phenomena such as EADs. Thus, in this study, the dynamic clamp has highlighted potential therapeutic targets (i.e. ICa,L properties such as V1/2,act, V1/2,inact) for new drugs or genetic interventions to suppress EAD-mediated arrhythmias.
Interstingly, whereas pharmacological agents may have off-target effects in both cardiac and non-cardiac tissue, a specific way to target ICa,L could be to take advantage of the modulatory accessory subunits of the L-type Ca2+ channel (Birnbaumer et al. 1998; Davies et al. 2007; Dolphin, 2009) such as α2δ or β subunits. These accessory subunits are highly specific for the channel and are known to modulate its biophysical properties (Birnbaumer et al. 1998; Olcese et al. 1994; Platano et al. 2000). Thus, genetic interventions to tune the biophysical properties of ICa,L by altering its subunit composition could be a promising approach to suppress EAD formation in a highly specific manner.
Acknowledgments
We are grateful to David Cristini and Jonathan Bettencourt for providing expert support with RTXI installation and Maurizio Carnesecchi for contributing analytical software. We thank the members of the Olcese, Weiss, Qu, Garfinkel, Karaguezian and Chen laboratories for constructive discussions during the development of the project. This work was supported by research grants NIH/NHLBI P01HL078931 and R01 HL103662 (to J.W.), NIH/NIGMS R01GM082289 (to R.O.), American Heart Association Predoctoral Fellowship (W.S.A.) 10PRE3290025 to R.M. and American Heart Association Postdoctoral Fellowship (W.S.A.) 11POST7140046 to A.P., and the Laubisch and Kawata endowments (to J.W.).
Glossary
Abbreviations
- AP
action potential
- APD
action potential duration
- CaMKII
Ca2+–calmodulin-dependent protein kinase II
- EAD
early afterdepolarization
- ICa,L
L-type Ca2+ current
- RTXI
real-time experimental interface
- SR
sarcoplasmic reticulum
- VF
ventricular fibrillation
- VT
ventricular tachycardia
Author contributions
R.V.M. performed research. Y.X. and A.P. provided analytical tools. R.V.M. and R.O. analyzed data. R.V.M, A.G., Z.Q., J.N.W, and R.O. designed research. R.V.M, A.P., A.G., Z.Q., J.N.W and R.O. wrote the paper. All authors have approved the final version of the paper for publication. The authors have no disclosures.
Supplementary material
Supplementary Fig. S1
Supplementary Table. S1
As a service to our authors and readers, this journal provides supporting information supplied by the authors. Such materials are peer-reviewed and may be re-organized for online delivery, but are not copy-edited or typeset. Technical support issues arising from supporting information (other than missing files) should be addressed to the authors
References
- Anderson ME. Calmodulin kinase and L-type calcium channels; a recipe for arrhythmias? Trends Cardiovasc Med. 2004;14:152–161. doi: 10.1016/j.tcm.2004.02.005. [DOI] [PubMed] [Google Scholar]
- Antoons G, Volders PG, Stankovicova T, Bito V, Stengl M, Vos MA, Sipido KR. Window Ca2+ current and its modulation by Ca2+ release in hypertrophied cardiac myocytes from dogs with chronic atrioventricular block. J Physiol. 2007b;579:147–160. doi: 10.1113/jphysiol.2006.124222. [DOI] [PMC free article] [PubMed] [Google Scholar]
- Antoons G, Volders PG, Stankovicova T, Bito V, Stengl M, Vos MA, Sipido KR. Window Ca2+ current and its modulation by Ca2+ release in hypertrophied cardiac myocytes from dogs with chronic atrioventricular block. J Physiol. 2007a;579:147–160. doi: 10.1113/jphysiol.2006.124222. [DOI] [PMC free article] [PubMed] [Google Scholar]
- Berecki G, Zegers JG, Bhuiyan ZA, Verkerk AO, Wilders R, Van Ginneken AC. Long-QT syndrome-related sodium channel mutations probed by the dynamic action potential clamp technique. J Physiol. 2006;570:237–250. doi: 10.1113/jphysiol.2005.096578. [DOI] [PMC free article] [PubMed] [Google Scholar]
- Berecki G, Zegers JG, Verkerk AO, Bhuiyan ZA, de Jonge B, Veldkamp MW, Wilders R, Van Ginneken AC. HERG channel (dys)function revealed by dynamic action potential clamp technique. Biophys J. 2005;88:566–578. doi: 10.1529/biophysj.104.047290. [DOI] [PMC free article] [PubMed] [Google Scholar]
- Berecki G, Zegers JG, Wilders R, Van Ginneken AC. Cardiac channelopathies studied with the dynamic action potential-clamp technique. Methods Mol Biol. 2007;403:233–250. doi: 10.1007/978-1-59745-529-9_16. [DOI] [PubMed] [Google Scholar]
- Birnbaumer L, Qin N, Olcese R, Tareilus E, Platano D, Costantin J, Stefani E. Structures and functions of calcium channel beta subunits. J Bioenerg Biomembr. 1998;30:357–375. doi: 10.1023/a:1021989622656. [DOI] [PubMed] [Google Scholar]
- Davies A, Hendrich J, Van Minh AT, Wratten J, Douglas L, Dolphin AC. Functional biology of the α2δ subunits of voltage-gated calcium channels. Trends Pharmacol Sci. 2007;28:220–228. doi: 10.1016/j.tips.2007.03.005. [DOI] [PubMed] [Google Scholar]
- Dolphin AC. Calcium channel diversity: multiple roles of calcium channel subunits. Curr Opin Neurobiol. 2009;19:237–244. doi: 10.1016/j.conb.2009.06.006. [DOI] [PubMed] [Google Scholar]
- Dorval AD, Christini DJ, White JA. Real-time linux dynamic clamp: a fast and flexible way to construct virtual ion channels in living cells. Ann Biomed Eng. 2001;29:897–907. doi: 10.1114/1.1408929. [DOI] [PubMed] [Google Scholar]
- Dzhura I, Wu Y, Colbran RJ, Balser JR, Anderson ME. Calmodulin kinase determines calcium-dependent facilitation of L-type calcium channels. Nat Cell Biol. 2000;2:173–177. doi: 10.1038/35004052. [DOI] [PubMed] [Google Scholar]
- Gaborit N, Le BS, Szuts V, Varro A, Escande D, Nattel S, Demolombe S. Regional and tissue specific transcript signatures of ion channel genes in the non-diseased human heart. J Physiol. 2007;582:675–693. doi: 10.1113/jphysiol.2006.126714. [DOI] [PMC free article] [PubMed] [Google Scholar]
- Huffaker R, Lamp ST, Weiss JN, Kogan B. Intracellular calcium cycling, early afterdepolarizations, and reentry in simulated long QT syndrome. Heart Rhythm. 2004;1:441–448. doi: 10.1016/j.hrthm.2004.06.005. [DOI] [PubMed] [Google Scholar]
- January CT, Riddle JM. Early afterdepolarizations: mechanism of induction and block. A role for L-type Ca2+ current. Circ Res. 1989;64:977–990. doi: 10.1161/01.res.64.5.977. [DOI] [PubMed] [Google Scholar]
- January CT, Riddle JM, Salata JJ. A model for early afterdepolarizations: induction with the Ca2+ channel agonist Bay K 8644. Circ Res. 1988;62:563–571. doi: 10.1161/01.res.62.3.563. [DOI] [PubMed] [Google Scholar]
- Koval OM, Guan X, Wu Y, Joiner ML, Gao Z, Chen B, Grumbach IM, Luczak ED, Colbran RJ, Song LS, Hund TJ, Mohler PJ, Anderson ME. CaV1.2 β-subunit coordinates CaMKII-triggered cardiomyocyte death and afterdepolarizations. Proc Natl Acad Sci U S A. 2010;107:4996–5000. doi: 10.1073/pnas.0913760107. [DOI] [PMC free article] [PubMed] [Google Scholar]
- Lin RJ, Bettencourt J, Wha IJ, Christini DJ, Butera RJ. Real-time experiment interface for biological control applications. Conf Proc IEEE Eng Med Biol Soc. 2010;2010:4160–4163. doi: 10.1109/IEMBS.2010.5627397. [DOI] [PMC free article] [PubMed] [Google Scholar]
- Lin S, Wang Z, Fedida D. Influence of permeating ions on Kv1.5 channel block by nifedipine. Am J Physiol Heart Circ Physiol. 2001;280:H1160–H1172. doi: 10.1152/ajpheart.2001.280.3.H1160. [DOI] [PubMed] [Google Scholar]
- Luo CH, Rudy Y. A dynamic model of the cardiac ventricular action potential. I. Simulations of ionic currents and concentration changes. Circ Res. 1994;74:1071–1096. doi: 10.1161/01.res.74.6.1071. [DOI] [PubMed] [Google Scholar]
- Mahajan A, Sato D, Shiferaw Y, Baher A, Xie LH, Peralta R, Olcese R, Garfinkel A, Qu Z, Weiss JN. Modifying L-type calcium current kinetics: consequences for cardiac excitation and arrhythmia dynamics. Biophys J. 2008a;94:411–423. doi: 10.1529/biophysj.106.98590. [DOI] [PMC free article] [PubMed] [Google Scholar]
- Mahajan A, Shiferaw Y, Sato D, Baher A, Olcese R, Xie LH, Yang MJ, Chen PS, Restrepo JG, Karma A, Garfinkel A, Qu Z, Weiss JN. A rabbit ventricular action potential model replicating cardiac dynamics at rapid heart rates. Biophys J. 2008b;94:392–410. doi: 10.1529/biophysj.106.98160. [DOI] [PMC free article] [PubMed] [Google Scholar]
- Maltsev VA, Sabbah HN, Higgins RS, Silverman N, Lesch M, Undrovinas AI. Novel, ultraslow inactivating sodium current in human ventricular cardiomyocytes. Circulation. 1998;98:2545–2552. doi: 10.1161/01.cir.98.23.2545. [DOI] [PubMed] [Google Scholar]
- Maruyama M, Lin SF, Xie Y, Chua SK, Joung B, Han S, Shinohara T, Shen MJ, Qu Z, Weiss JN, Chen PS. Genesis of phase 3 early afterdepolarizations and triggered activity in acquired long-QT syndrome. Circ Arrhythm Electrophysiol. 2011;4:103–111. doi: 10.1161/CIRCEP.110.959064. [DOI] [PMC free article] [PubMed] [Google Scholar]
- Olcese R, Qin N, Schneider T, Neely A, Wei X, Stefani E, Birnbaumer L. The amino terminus of a calcium channel β subunit sets rates of channel inactivation independently of the subunit's effect on activation. Neuron. 1994;13:1433–1438. doi: 10.1016/0896-6273(94)90428-6. [DOI] [PubMed] [Google Scholar]
- Osadchii OE. Mechanisms of hypokalemia-induced ventricular arrhythmogenicity. Fundam Clin Pharmacol. 2010;24:547–559. doi: 10.1111/j.1472-8206.2010.00835.x. [DOI] [PubMed] [Google Scholar]
- Platano D, Qin N, Noceti F, Birnbaumer L, Stefani E, Olcese R. Expression of the α2δ subunit interferes with prepulse facilitation in cardiac L-type calcium channels. Biophys J. 2000;78:2959–2972. doi: 10.1016/S0006-3495(00)76835-4. [DOI] [PMC free article] [PubMed] [Google Scholar]
- Qi X, Yeh YH, Chartier D, Xiao L, Tsuji Y, Brundel BJ, Kodama I, Nattel S. The calcium/calmodulin/kinase system and arrhythmogenic afterdepolarizations in bradycardia-related acquired long-QT syndrome. Circ Arrhythm Electrophysiol. 2009;2:295–304. doi: 10.1161/CIRCEP.108.815654. [DOI] [PubMed] [Google Scholar]
- Sato D, Xie LH, Nguyen TP, Weiss JN, Qu Z. Irregularly appearing early afterdepolarizations in cardiac myocytes: random fluctuations or dynamical chaos? Biophys J. 2010;99:765–773. doi: 10.1016/j.bpj.2010.05.019. [DOI] [PMC free article] [PubMed] [Google Scholar]
- Sato D, Xie LH, Sovari AA, Tran DX, Morita N, Xie F, Karagueuzian H, Garfinkel A, Weiss JN, Qu Z. Synchronization of chaotic early afterdepolarizations in the genesis of cardiac arrhythmias. Proc Natl Acad Sci U S A. 2009;106:2983–2988. doi: 10.1073/pnas.0809148106. [DOI] [PMC free article] [PubMed] [Google Scholar]
- Szabo B, Sweidan R, Rajagopalan CV, Lazzara R. Role of Na+:Ca2+ exchange current in Cs+-induced early afterdepolarizations in Purkinje fibers. J Cardiovasc Electrophysiol. 1994;5:933–944. doi: 10.1111/j.1540-8167.1994.tb01133.x. [DOI] [PubMed] [Google Scholar]
- Tan RC, Joyner RW. Electrotonic influences on action potentials from isolated ventricular cells. Circ Res. 1990;67:1071–1081. doi: 10.1161/01.res.67.5.1071. [DOI] [PubMed] [Google Scholar]
- Tran DX, Sato D, Yochelis A, Weiss JN, Garfinkel A, Qu Z. Bifurcation and chaos in a model of cardiac early afterdepolarizations. Phys Rev Lett. 2009;102:258103. doi: 10.1103/PhysRevLett.102.258103. [DOI] [PMC free article] [PubMed] [Google Scholar]
- Volders PG, Kulcsar A, Vos MA, Sipido KR, Wellens HJ, Lazzara R, Szabo B. Similarities between early and delayed afterdepolarizations induced by isoproterenol in canine ventricular myocytes. Cardiovasc Res. 1997;34:348–359. doi: 10.1016/s0008-6363(96)00270-2. [DOI] [PubMed] [Google Scholar]
- Wagner S, Dybkova N, Rasenack EC, Jacobshagen C, Fabritz L, Kirchhof P, Maier SK, Zhang T, Hasenfuss G, Brown JH, Bers DM, Maier LS. Ca2+/calmodulin-dependent protein kinase II regulates cardiac Na+ channels. J Clin Invest. 2006;116:3127–3138. doi: 10.1172/JCI26620. [DOI] [PMC free article] [PubMed] [Google Scholar]
- Wagner S, Ruff HM, Weber SL, Bellmann S, Sowa T, Schulte T, Grandi E, Bers DM, Backs J, Belardinelli L, Maier LS. Reactive oxygen species-activated Ca/calmodulin kinase IIδ is required for late INa augmentation leading to cellular Na and Ca overload. Circ Res. 2011;108:555–565. doi: 10.1161/CIRCRESAHA.110.221911. [DOI] [PMC free article] [PubMed] [Google Scholar]
- Weiss JN, Garfinkel A, Karagueuzian HS, Chen PS, Qu Z. Early afterdepolarizations and cardiac arrhythmias. Heart Rhythm. 2010a;7:1891–1899. doi: 10.1016/j.hrthm.2010.09.017. [DOI] [PMC free article] [PubMed] [Google Scholar]
- Weiss JN, Garfinkel A, Karagueuzian HS, Chen PS, Qu Z. Early afterdepolarizations and cardiac arrhythmias. Heart Rhythm. 2010b;7:1891–1899. doi: 10.1016/j.hrthm.2010.09.017. [DOI] [PMC free article] [PubMed] [Google Scholar]
- Wilders R. Dynamic clamp: a powerful tool in cardiac electrophysiology. J Physiol. 2006;576:349–359. doi: 10.1113/jphysiol.2006.115840. [DOI] [PMC free article] [PubMed] [Google Scholar]
- Xie LH, Chen F, Karagueuzian HS, Weiss JN. Oxidative-stress-induced afterdepolarizations and calmodulin kinase II signaling. Circ Res. 2009;104:79–86. doi: 10.1161/CIRCRESAHA.108.183475. [DOI] [PMC free article] [PubMed] [Google Scholar]
Associated Data
This section collects any data citations, data availability statements, or supplementary materials included in this article.