

Abstract
Non-technical summary
Thermoregulatory responses during exercise are reduced following thermal dehydration. If individuals do not rehydrate adequately, it could lead to heat exhaustion or stroke with the worst case scenario being death. Plasma volume loss during dehydration has been suggested to suppress cutaneous vasodilatation in response to hyperthermia via a baroreflex-mediated reduction in active vasodilator activity rather than enhanced active vasoconstrictor activity. However, no changes in the electrical signals of the efferent neural pathway have ever been identified. In the present study, we found a component of efferent skin sympathetic nerve activity that was synchronized with the cardiac cycle in thermally stressed individuals. This nerve activity increased with an increase in oesophageal temperature and the increase was significantly suppressed by hypovolaemia. Thus, this component of skin sympathetic nerve activity might represent the active vasodilator signals that regulate skin blood flow during hyperthermia in humans.
Abstract
Although cutaneous vasodilatation in hyperthermia was suppressed during hypovolaemia, the efferent neural pathway mediating this suppression has not been identified. To determine the electrical nerve signals which account for the suppression of cutaneous vasodilatation during hypovolaemia, skin sympathetic nerve activity (SSNA; microneurography) from the peroneal nerve, laser-Doppler blood flow (LDF) on the ipsilateral dorsal foot, mean arterial pressure (MAP; sonometry) and oesophageal temperature (Toes) were measured before and during 45 min of passive warming in 20 healthy subjects during normovolaemia (n = 10) or hypovolaemia (n = 10) conditions. Hypovolaemia was achieved by diuretic administration. Cutaneous vascular conductance (CVC = LDF/MAP), SSNA burst frequency and total SSNA obtained from rectified and filtered SSNA signal increased as Toes increased by ∼0.5°C by the end of warming in both groups. The increase in CVC was significantly lower in hypovolaemia than normovolaemia (P < 0.0001), but with no significant difference in the increase in burst frequency and total SSNA between groups (P > 0.32). However, using an alternative analysis that constructed spike incidence histograms from the original signal using 0.05 s bins during the 5 s following a given R-wave, we found a SSNA component synchronized with the cardiac cycle with a 1.1–1.3 s latency. This component increased with an increase in Toes and the increase was significantly suppressed by hypovolaemia (P < 0.0001). In conclusion, hypovolaemic suppression of cutaneous vasodilatation during hyperthermia might be caused by a reduction in the SSNA component synchronized with cardiac cycle.
Introduction
Thermoregulatory responses during exercise are reduced following thermal dehydration. If individuals do not rehydrate adequately, it could lead to heat exhaustion or heat stroke with the worst case scenario being death (Rothstein & Towbin, 1947). A reduction in plasma volume (PV) loss has been suggested to suppress cutaneous vasodilatation in response to hyperthermia via baroreflex (Nadel et al. 1980; Ikegawa et al. 2011) -mediated changes in an efferent pathway that resulted in a reduction in active vasodilator drive rather than an increase in active vasoconstrictor activity (Edholm et al. 1957; Kellogg et al. 1990). However, neurophysiological data supporting this hypothesis are lacking.
Since both skin blood flow (SkBF) and sweat rate (SR) increase simultaneously with a rise in body temperature, it has been difficult to distinguish between the neural signals driving active vasodilatation and that of sweating.
We have recently reported that in exercising humans under warm environmental conditions, cutaneous vasodilatation was reduced in hypovolaemia whereas the sweating response was sustained (Kamijo et al. 2005b). Therefore, we surmised that the response of the neural pathway for active vasodilatation would differ from that for sweating under conditions of combined hypovolaemia and hyperthermia. Furthermore, the neural efferent signal riding in the skin sympathetic nerve activity (SSNA) is probably controlled by an afferent input to the cardiovascular centre via baroreceptors. As such, it would be enhanced/suppressed by loading/unloading of receptors in a beat-by-beat fashion with cardiac cycles as is known to occur in muscle sympathetic nerve activity (MSNA) (Vallbo et al. 1979).
Therefore, in the present study, we hypothesized that there is a component of the SSNA that is synchronized with the cardiac cycle that increases with an increase in thermal stress and cutaneous vasodilatation. In addition, the increase in this component of SSNA during thermal stress would be suppressed in hypovolaemia with reduced cutaneous vasodilatation. To examine these hypotheses, we analysed raw SSNA signals in relation to cardiac cycles continuously during 45 min of passive warming in normovolaemia and hypovolaemia conditions.
Methods
Subjects
The procedures in this study conformed to the guidelines of the Declaration of Helsinki and were approved by the Review Board on Human Experiments, Shinshu University School of Medicine. After the experimental protocols had been fully explained, 20 healthy and non-smoking young men gave their written informed consent before participating in this study. Subjects were divided into two groups, normovolaemia (n = 10) and hypovolaemia (n = 10), with no significant differences in any physical characteristics between the two groups: 23 ± 2 and 24 ± 5 years of age (mean ± SD), 171 ± 3 and 173 ± 7 cm tall, and 62.9 ± 5.9 and 64.9 ± 7.6 kg body weight, respectively, with no significant differences between groups (P > 0.304).
Experimental protocol
In the hypovolaemia trial, subjects reported to the laboratory at 06.30 and sat in a test room, at an ambient temperature (Ta) of ∼28°C and ∼50% relative humidity (RH). Subjects ate a light meal with 500 ml tap water 30 min before arrival. After the first blood sample was taken at 07.00 through an 18-G Teflon catheter placed in the left antecubital vein, subjects took 20 mg furosemide, and rested in the room for an additional 3.5 h voiding the bladder when necessary. During the waiting period, they were allowed to drink water ad libitum, but without any food, for the first 2.5 h to prevent plasma hyperosmolality but were restricted from drinking from this point until the end of the experiment. The fluid balance ( = total water intake − total urine volume) during this period was −1433 ± 92 ml in hypovolaemia, significantly higher than −217 ± 148 ml in normovolaemia (P < 0.0001). The protocol in normovolaemia was the same as that in hypovolaemia except for taking furosemide. After the resting period, they wore a tube-lined perfusion suit to cover the entire skin surface except for the face, hands, feet and a leg where SSNA was measured. Subjects in both groups then entered an experimental chamber at ∼28°C Ta and ∼20% RH and sat in a semi-recumbent position while all measurement devices were applied. All measurements were made continuously during the experimental trial. During the 10 min thermoneutral condition, 34°C water was perfused through the suit. During the 45 min passive warming period, 47°C water was perfused through the suit. We took the 2nd blood sample in the 5th minute of the thermoneutral condition and the 3rd in the last minute of warming. After each trial, we determined maximal SkBF by heating the skin site to ∼44°C for 30 min using an incandescent lamp.
Measurements
Microneurography
A tungsten microelectrode with an impedance of 4 MΩ at 1 kHz, <5 μm tip and 200 μm shaft diameter, was inserted percutaneously into cutaneous nerve fascicles in the peroneal nerve at the posterior aspect of the head of the fibula to record multiple-unit postganglionic SSNA. An Ag–AgCl electrode (Vitrode Bs; Nihon Kohden Corporation, Tokyo, Japan) was placed on the skin surface ∼5 cm from the active electrode as a reference. The nerve signal was pre-amplified 10,000-fold (DAM80; WPI Inc., Sarasota, FL, USA), transferred to a digital tape recorder, and sent in parallel to a loud speaker, passed through a band-pass filter of 700–2000 Hz as in previous studies, then rectified and filtered (τ = 0.1 s). We confirmed that the signals completely met the following criteria for SSNA: (1) subjects reported that they felt paraesthesia in the dorsal foot without any numbness, (2) a loud sound was evoked by a deep breath, sudden arousal or gentle touch within the innervated area, but (3) was not evoked by a Valsalva's manoeuver (Bini et al. 1980; Kamijo et al. 2005a).
SkBF and SR
SkBF was measured by laser-Doppler velocimetry (τ = 0.1 s; ALF21, ADVANCE, Tokyo) at the site of the ipsilateral dorsal foot, innervated by the peroneal nerve, but devoid of any superficial cutaneous veins. SR was measured by a capacitance hygrometer (Hygro Flex1, Rotronic Inst., Huntington, NY, USA). A small capsule was placed on the dorsal foot (0.79 cm2 area) beside the laser-Doppler probe to detect sweating. Dry air was ventilated through a small capsule placed on the foot at 60 ml min−1. Relative humidity and temperature in the sweat capsule were monitored and SR was calculated from them. SkBF and SR were shown as averaged values every minute. Cutaneous vascular conductance (CVC) was calculated as SkBF/mean arterial pressure (MAP) and is presented as a percentage of the maximal SkBF (% max).
Body temperatures and cardiovascular and respiratory variables
Oesophageal temperature (Toes) and skin temperature were monitored with thermocouples. Mean skin temperature (Tsk) was determined by Robert's equation (Roberts et al. 1977). Heart rate (HR) was calculated by averaged R-R intervals of the ECG every minute. Systolic (SBP) and diastolic (DBP) blood pressures were measured by automated brachial auscultation. Pulse pressure (PP = SBP − DBP) and MAP ( = PP/3 + DBP) were calculated. Respiratory rate (RR) was calculated from voluntary respiratory movement (see Supplemental material for more information).
Blood composition
A 1 ml aliquot of each 11 ml blood sample was used to determine the haematocrit (in %) and haemoglobin concentration (in g dl−1), which were used to calculate the per cent change (Δ) in PV (Greenleaf et al. 1979). Three milliliters of the aliquot were immediately centrifuged at room temperature and the aliquots of plasma were used to determine plasma osmolality (Posmol, in mosomol (kg H2O)−1). The remaining 7 ml of aliquots were placed in a chilled tube (EDTA2Na, 1.5 mg ml−1), which was centrifuged at 4°C to determine plasma adrenaline, noradrenaline, arginine vasopressin and angiotensin II concentrations ([Ad]p, [NA]p, [AVP]p and [AGII]p, respectively). These samples were stored at −85°C until hormone assays were performed (see Supplemental material for more information).
Data analyses
Bursts frequency (BF) and total SSNA (tSSNA) were determined by methods described previously and as shown in the Supplemental material (Kamijo et al. 2005a).
We also determined a component of the SSNA signal that was synchronized with the cardiac cycles. Spike incidence from the original signal was counted in 0.05-s bins from a given R-wave over the following 5 s (Fig. 1A and B) and was presented as a histogram as reported by Macefield & Wallin (1996). The same number of the 5 s incidence histograms as HR were averaged every minute from the 5th minute of the thermoneutral condition to the 45th minute of warming (Fig. 1C). Since we found more than three peaks in the averaged histogram, we determined peak-to-peak intervals for SSNA spike incidence (TS) and that for R-wave incidence (TR) where the maximal value of auto-correlation function was observed. Similarly, we determined the latency of SSNA firing after a given R-wave (TRS) by cross-correlation analysis. We confirmed that the maximal values of autocorrelation and cross-correlation functions were significant (P < 0.05). If maximal correlation coefficients were not significant in some periods, we interpolated the values from the values at the closest times; however, only ∼1% of the data fell into this category. In addition, we calculated the area above the valley of the periodic cycle of the averaged histogram for 5 s: upper area (UA), as a component synchronized with the cardiac cycle and that below the valley, lower area (LA), as a component non-synchronized with the cardiac cycle (Fig. 1D). We calculated UA and LA per minute (UAmin and LAmin, respectively) by multiplying UA and LA for 5 s by 60 s/5 s and also calculated UA and LA per one heart beat (UAbeat and LAbeat, respectively) by dividing the UA and LA for 5 s by 5 s/TS.
Figure 1. The procedure of SSNA analyses.
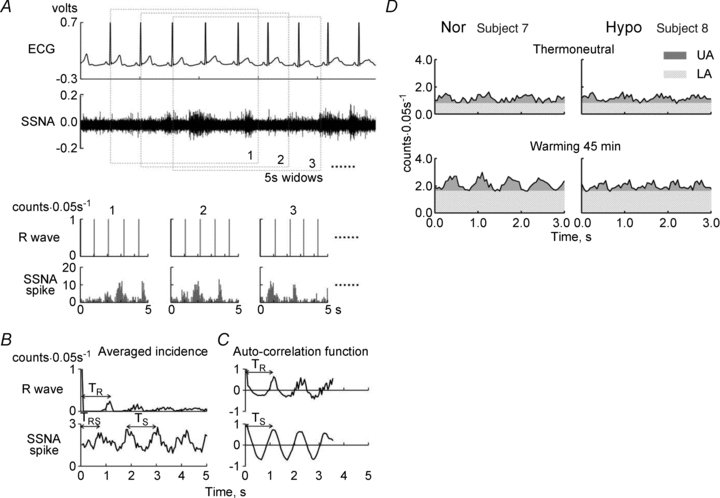
A, ECG (upper) and original recording of skin sympathetic nerve activity (SSNA; bottom). B, R-wave and spike incidence histograms from the time of a given R-wave of ECG in the 5-s window with 0.05 s bin. The number of 1, 2 and 3 …. on the histograms corresponds to the numbers of 5-s windows in A. C, the averaged histograms for every minute (left) and auto-correlation functions (right) of R-wave incidence (upper) and SSNA spike incidence (bottom), respectively. TR and TS, the peak-to-peak intervals of the R-wave and the SSNA spike incidences, respectively, determined from the averaged histograms of each minute in individual subjects by auto-correlation analysis; TRS, the time between a given peak of R-wave incidence and the following peak of SSNA spike incidence by cross-correlation analysis. D, the upper (UA) and the lower (LA) areas, which are the components synchronized and non-synchronized with the cardiac cycle, respectively, are shown in one of each subject in normovolaemia (Nor, left) and hypovolaemia (Hypo, right) at a minute of thermoneutral condition (upper) and 45th minute warming (bottom).
Statistics
Two-way ANOVA for repeated measures was used. The standard least-square method was used to determine regression equations between changes in UAmin (ΔUAmin) and CVC (ΔCVC) and between changes in LAmin (ΔLAmin) and SR (ΔSR) from their thermoneutral values during warming (Fig. 6). All values are means ± SEM. The null hypothesis was rejected at P < 0.05.
Figure 6. Relationships between changes in cutaneous vascular conductance (ΔCVC) from thermoneutral values and those in upper area per minute (ΔUAmin; A) and between changes in sweat rate (ΔSR) and those in lower area per minute (ΔLAmin; B) from thermoneutral values during warming in normovolaemia (open circles) and hypovolaemia (filled circles).
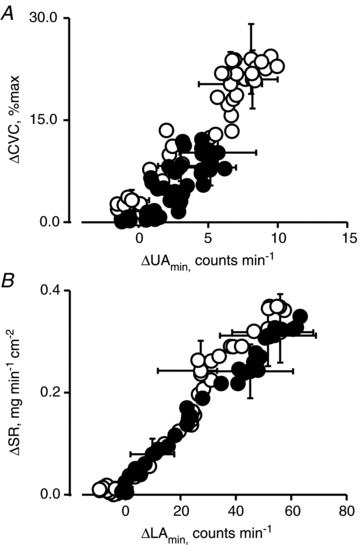
Values are means for 10 subjects determined every minute. SEM bars are shown at 0, 15th, 30th and 40th minute of warming.
Results
As shown in Table 1, PV was significantly lower in hypovolaemia than normovolaemia in the thermoneutral condition (P < 0.0001), but there was no significant differences in Posmol between groups (P > 0.62). The reduction in PV persisted throughout the passive warming portion of the experiment.
Table 1.
Changes in plasma volume and osmolaity in the two groups
| P values | |||||||
|---|---|---|---|---|---|---|---|
| Groups | BL | TN | W45 | Group | Time | G × T | |
| ΔPV (% baseline) | Nor | 0.0 ± 0.0 | −0.3 ± 1.0 | −5.9 ± 1.5 | |||
| Hypo | 0.0 ± 0.0 | −9.0 ± 0.9 | −14.5 ± 0.9 | < 0.0001 | < 0.0001 | < 0.0001 | |
| Posmol (mosmol (kgH2O)−1) | Nor | 292 ± 2 | 290 ± 1 | 293 ± 1 | |||
| Hypo | 291 ± 1 | 289 ± 1 | 292 ± 1 | 0.618 | 0.007 | 0.892 | |
Values are means ± SEM for 10 subjects in normovolaemia (Nor) and in hypovolaemia (Hypo). BL, baseline values before the start of measurement in Nor and before administration of a diuretic in Hypo; TN, thermoneutral condition; W45, at the 45th minute of passive warming; ΔPV, changes in plasma volume from BL; Posmol, plasma osmolality. P values from two-way [1 between (Group) × 1 within (Time)] ANOVA for repeated measures; Group (Nor vs. Hypo), Time (BL, TN and W45), G × T (an interactive effect of [Group × Time]).
Figure 2 shows thermoregulatory responses during the thermoneutral condition and passive warming. Tsk and Toes increased during warming in both groups but with no significant differences between groups (both P > 0.5) and also with no [Group × Time] interaction (both P > 0.3). Similarly, BF, tSSNA, CVC and SR increased with an increase in Toes with no significant differences between groups (both P > 0.15). There were no significant [Group × Time] interaction for BF, tSSNA and SR (all P > 0.6). However, we found the significant [Group × Time] interaction for CVC (P < 0.0001).
Figure 2. Thermoregulatory responses during thermoneutral condition and passive warming in both groups.
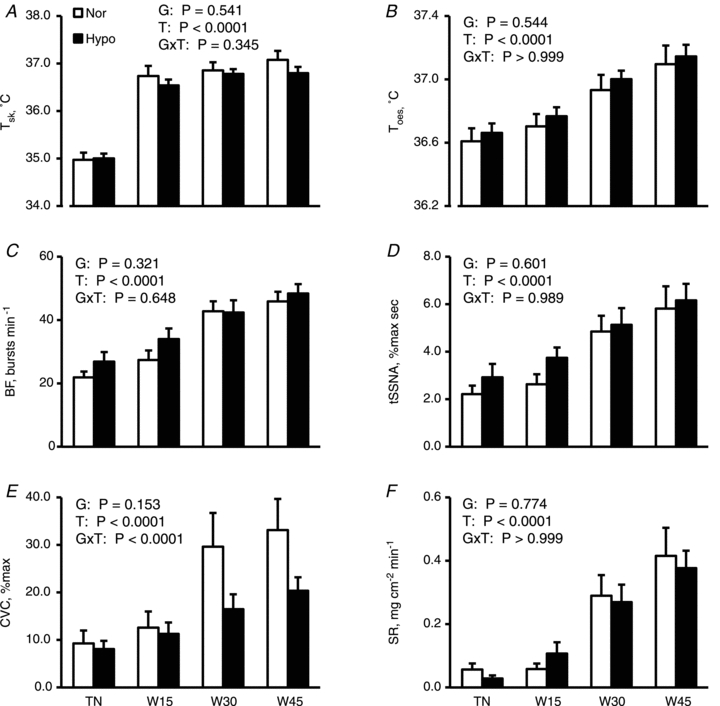
Mean skin (Tsk; A) and oesophageal temperatures (Toes; B), burst frequency of skin sympathetic nerve activity (BF; C), total skin sympathetic nerve activity (tSSNA; D), cutaneous vascular conductance CVC; E) and sweat rate (SR; F) are shown as means ± SEM for 10 subjects in normovolaemia (Nor) and hypovolaemia (Hypo). Although statistical analyses were performed on the values every minute, only values in the –5th minute (i.e. 5 min before warming began) under thermoneutral conditions (TN), and the 15th (W15), 30th (W30) and 45th minute of warming (W45) are presented to avoid confusion. P values by two-way [1 between (Group) × 1 within (Time)] ANOVA for repeated measures are described in the figures; G, Groups (Nor vs. Hypo); T, time (50 min); G×T, an interactive effect of [Group × Time].
There were no significant main effects or [Group × Time] interactions for cardiovascular and respiratory variables shown in Fig. 3.
Figure 3. Cardiovascular and respiratory responses.
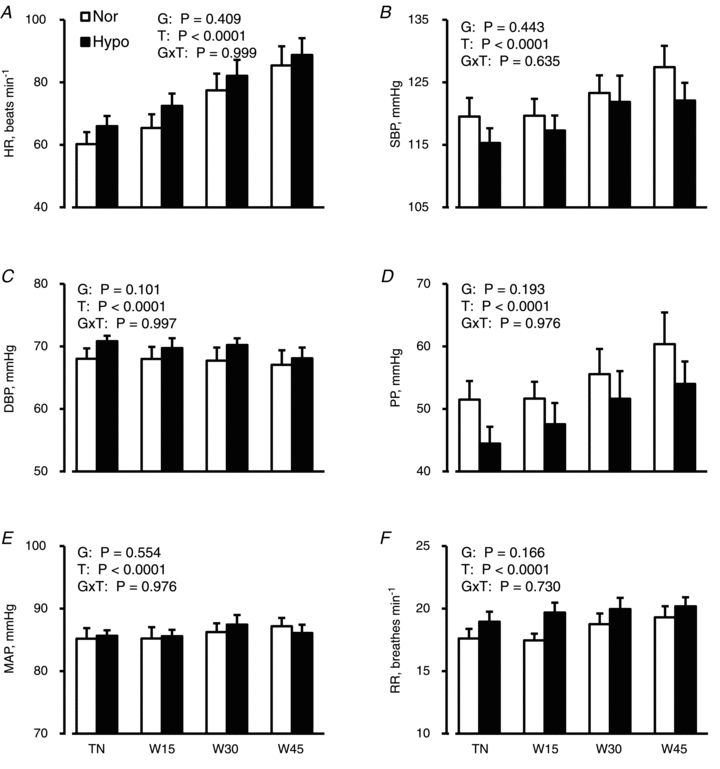
Heart rate (HR; A), systolic (SBP; B) and diastolic blood pressures (DBP; C), pulse pressure (PP; D), mean arterial pressure (MAP; E) and respiratory rate (RR; F) are shown as the means ± SEM for 10 subjects in normovolaemia (Nor) and hypovolaemia (Hypo). Although statistical analyses were performed on the values every minute, only values in the −5th minute under thermoneutral conditions (TN), and the 15th (W15), 30th (W30) and 45th minute of warming (W45) are presented to avoid confusion. P values by two-way ANOVA for repeated measures are described in the figures; G, groups (Nor vs. Hypo); T, time (50 min); G×T, an interactive effect of [Group × Time].
The maximal auto-correlation coefficient for TR during the thermoneutral and warming phases in each subject ranged from 0.292 to 0.982 and 0.398 to 0.970 in normovolaemia and hypovolaemia, respectively, with significances (all P < 0.008). Also, TS ranged from 0.233 to 0.960 in normovolaemia and 0.234 to 0.947 in hypovolaemia with significances (all P < 0.046). Further, the maximal cross-correlation coefficient for TRS every minute in each subject ranged from 0.219 to 0.705 in normovolaemia and 0.211 to 0.696 in hypovolaemia with significances (all P < 0.05). TR, TS and TRS in both groups significantly decreased with a rise in Toes (all P < 0.0001) but with no significant differences between groups (all P > 0.22) and also no interactive effect of [Group × Time] (all P > 0.27) (Fig. 4). TS (x) was highly correlated with TR (y) in normovolaemia (r = 0.966, P < 0.0001, y = 0.940x+ 0.055) and hypovolaemia (r = 0.958, P < 0.0001, y = 0.948x+ 0.031).
Figure 4. Number of spike, TR, TS and TRS during thermoneutral condition and passive warming.
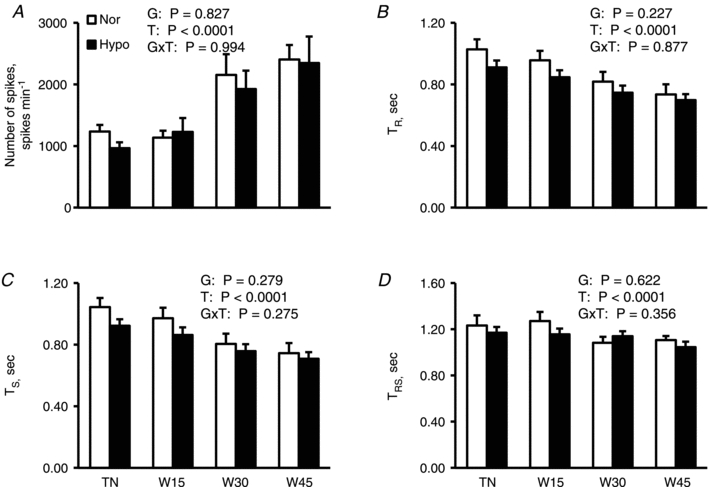
Number of spikes (A), an R-R interval of ECG (TR; B), a spike incidence interval of skin sympathetic nerve activity (SSNA) synchronized with the cardiac cycle (TS; C) and a latency of SSNA spike incidence synchronized with cardiac cycle after a given R-wave of ECG (TRS; D) are shown as means ± SEM for 10 subjects in normovolaemia (Nor) and hypovolaemia (Hypo). Although statistical analyses were performed on the values every minute, only values in the −5th minute under thermoneutral conditions (TN), and the 15th (W15), 30th (W30) and 45th minute of warming (W45) are presented to avoid confusion. P values by two-way ANOVA for repeated measures are described in the figures; G, groups (Nor vs. Hypo); T, time (50 min); G×T, an interactive effect of [Group × Time].
As shown in Fig. 5, although LAmin and UAmin increased with an increase in Toes in both groups (P < 0.0001), we found a significant interactive effect of [Group × Time] on UAmin (P < 0.0001), but no significant interactive effect on LAmin (P = 0.999). Similarly, although UAbeat increased during warming in both groups (P = 0.0006), we found a significantly interactive effect of [Group × Time] on UAbeat (P = 0.026) but with no significant difference in LAbeat (not shown) between groups (P = 0.327), and also no significant interactive effect on LAbeat (P = 0.993).
Figure 5.
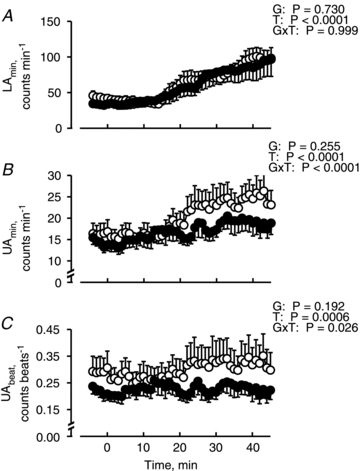
Lower (LAmin; A), upper (UAmin; B) areas per minute, and upper area per one heart beat (UAbeat; C) during thermoneutral (−5–0 min) and warming (0–45 min) periods in normovolaemia (open circles) and hypovolaemia (filled circles). UAmin and LAmin indicate the components of SSNA spike synchronized and not synchronized with the cardiac cycle, respectively. Values are means and SEM bars for 10 subjects. P values by two-way ANOVA for repeated measures are described in the figures; G, groups (Nor vs. Hypo); T, time (50 min); G×T, an interactive effect of [Group × Time].
As shown in Fig. 6, we found that ΔUAmin (x) was significantly correlated with ΔCVC (y) in normovolaemia (r = 0.961, P < 0.0001, y = 2.200x+ 4.048) and in hypovolaemia (r = 0.795, P < 0.0001, y = 1.519x+ 1.377). The correlation coefficient (P < 0.0001), slope (P = 0.00175) and intercept (P < 0.0001) was smaller in hypovolaemia than normovolaemia. Similarly, we found that ΔLAmin was significantly correlated with ΔSR in normovolaemia (r = 0.981, P < 0.0001, y = 0.006x+ 0.038) and in hypovolaemia (r = 0.993, P < 0.0001, y = 0.005x+ 0.021). The correlation coefficient (P < 0.0001), slope (P = 0.0036) and intercept (P < 0.0001) was again smaller in hypovolaemia than normovolaemia.
As shown in Fig. 7, [Ad]p, [NA]p, [AVP]p and [AGII]p in both groups increased at the end of warming (all P < 0.033), but with no significant differences between groups (P > 0.1). Also, there were no significant interactive effects of [Group × Time] (P > 0.5) except for [AVP]p (P = 0.007).
Figure 7. Circulatory vasoactive substances throughout experiment in the both groups.
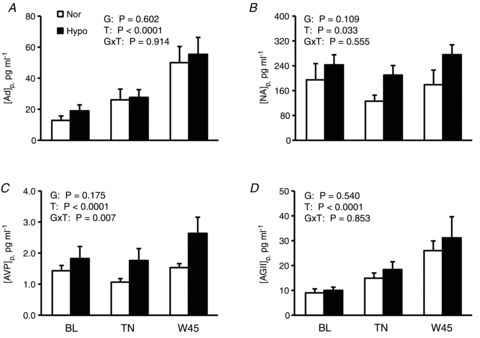
Plasma adrenaline ([Ad]p; A), noradrenaline ([NA]p; B), arginine vasopressin ([AVP]p; C) and angiotensin II concentrations ([AGII]p; D) are shown as means ± SEM for 6 subjects in normovolaemia (Nor) and 8 subjects hypovolaemia (Hypo). BL, baseline values before the start of measurement in Nor and before administration of a diuretic in Hypo; TN, thermoneutral condition; W45, at the 45th minute of passive warming. P values by two-way ANOVA for repeated measures are described in the figures; G, groups (Nor vs. Hypo); T, time (50 min); G×T, an interactive effect of [Group × Time].
Discussion
In the present study, we identified a component of SSNA that was synchronized with the cardiac cycle that increased with cutaneous vasodilatation during hyperthermia. More importantly, the increase in this component of SSNA during hyperthermia was suppressed in hypovolaemia and was associated with a reduction in cutaneous vasodilatation. We found no differences in circulating hormones that could potentially suppress cutaneous vasodilatation during hypovolaemia.
We found that the response of TS before and during warming was almost identical to TR in normovolaemia and hypovolaemia (Fig. 4). These data indicate that SSNA signals were synchronized with the cardiac cycle whereas earlier reports using rectified and filtered SSNA signals noted that SSNA bursts occurred randomly without synchronizing with the cardiac cycle (Hagbarth et al. 1972; Vallbo et al. 1979). However, Bini et al. (1981) suggested that SSNA recorded from the posterior cutaneous antebrachial nerve included a component synchronized with the cardiac cycle in passively warmed subjects although the burst incidence and the latency after R-wave time was not stable compared with those of MSNA. Macefield & Wallin (1996) suggested that the signals recorded from 3 of 8 single sudomotor fibres had some latency after a given R-wave time although the variance of latency was 2–fold greater than that in MSNA. However, they did not indicate if the synchronizing component was significantly associated with the thermoregulatory responses during warming. In the present study, we found that ∼20% of SSNA spikes synchronized with the cardiac cycle and that they were closely associated with cutaneous vasodilatation in hyperthermia.
TRS in the present analysis was 1.3 s under thermoneutral conditions, similar to that in MSNA (Sundlof & Wallin, 1978; Fagius & Wallin, 1980), and the suggested time required for electrical signal conduction through the baroreflex loop in normothermia. However, TRS decreased to ∼1.1 s by the end of warming. The decrease in TRS might be caused by the direct effect of increased body temperature on the signal conductance speed (Halar et al. 1981). The latency after a given R-wave and the effect of increased body temperature are unlikely to be different for SSNA and MSNA. However, the electrical signal conductance of SSNA is known to be ∼40% faster than that of MSNA (Fagius & Wallin, 1980). Therefore, considering that MSNA signals were triggered by the diastolic pressure wave immediately after the second R-wave of ECG before the burst (Sundlof & Wallin, 1978; Fagius & Wallin, 1980), we speculate that the synchronizing component for SSNA should be triggered by another pressure wave after the diastolic pressure wave.
One of the candidate pressure waves would be the systolic pressure wave ∼0.2 s after the diastolic pressure wave. However, Wilson et al. (2001) examined the responses of rectified and filtered SSNA to pharmacologically induced alteration of arterial pressure in passively heated subjects and suggested that the SSNA was not affected by altered arterial pressure. Crandall et al. (1996) examined the effects of unloading the carotid baroreceptor on CVC by applying 45 mmHg pulsatile neck pressure over the carotid sinus area 0.05 s after a given R-wave for a duration of 0.5 s for 3 min and suggested that CVC was not reduced despite elevated MAP and HR. Thus, since neither pharmacological nor pulsatile stimulation of arterial baroreceptors altered SSNA and CVC, the synchronizing component identified in the present study may not be triggered by a systolic pressure wave.
Another candidate would be the atrial pressure wave caused by atrial filling. There are two types of baroreceptors in the atria: one bursting at the timing of atrial constriction and the other bursting at the timing of atrial filling (Honig, 1981). As shown in Fig. 5, we found that UAmin, a product of HR and UAbeat, increased with a rise in Toes for both groups; however, in hypovolaemia, the increases in UAmin and UAbeat were significantly attenuated compared to normovolaemia. Since the decrease in TR, equal to 60 s/HR, during warming was not significantly different between the two groups (Fig. 4), the smaller increase in UAmin in hypovolaemia than normovolaemia was mainly caused by the smaller increase in UAbeat. Since atrial filling occurs at the time of a T-wave of ECG, ∼0.3 s after an R-wave, and since the electrical signal conductance of SSNA was ∼40% faster than that of MSNA, we speculate that the synchronizing component would be evoked by the stretching of atrial baroreceptors, which would be reduced by lowered atrial filling pressure in hypovolaemia.
There have been several studies supporting the idea that cardiopulmonary baroreflex contributes to the control of cutaneous vasodilatation more than arterial baroreflexes (Mack et al. 1988; Crandall et al. 1996; Nagashima et al. 1998). Ahmad et al. (1977) examined the effects of reduced right atrial pressure by applying graded lower body negative pressure to resting and hyperthermic subjects in the supine position and suggested that above −20 mmHg, forearm SkBF was reduced with reduced right atrial pressure while MAP and PP remained unchanged, and below this pressure, the decrease in forearm SkBF was blunted while PP started to decrease with a gradual increase in HR. Nagashima et al. (1998) showed in exercising subjects in a warm environment that cutaneous vasodilatation was enhanced by continuous negative-pressure breathing despite an ∼10 mmHg reduction of MAP, suggesting that the loading of cardiopulmonary baroreceptors increased SkBF more than the unloading of arterial baroreceptors reduced SkBF. These results support our idea that the synchronizing component was evoked by the stretching of atrial baroreceptors, rather than that of arterial baroreceptors. Furthermore, these data support the role of atrial baroreceptors in hypovolaemia-induced suppression of SkBF during hyperthermia.
The increase in UAbeat during warming in normovolaemia might be caused by an increase in the signals generated by the thermoregulatory centre in the hypothalamus as body temperature increased. Regarding the mechanisms for the synchronization of UAbeat with the cardiac cycle, the afferent signals from atrial baroreceptors may control a UAbeat outflow in the cardiovascular centre in the medulla like a gate: passing the efferent signals when baroreceptors are loaded while blocking them when they are unloaded, as suggested in the control of MSNA outflow so that it synchronizes with arterial pressure waves (Kienbaum et al. 2001). In hypovolaemia, since the stretching of atrial baroreceptors decreases due to a reduction in venous return to the heart, a UAbeat outflow may be blocked more than in normovolaemia, resulting in a smaller increase in UAbeat during warming even though the original UAbeat signals generated by the thermoregulatory centre increase as body temperature increases.
Although ΔUAmin was significantly correlated with ΔCVC, the slope and the intercept of regression equations were significantly smaller in hypovolaemia than normovolaemia (Fig. 6). The reasons for this remain unknown; however, ΔUAmin might include SSNA components other than just active vasodilator and active vasoconstrictor signals (Vissing, 1997; Kamijo et al. 2005a). However, the variations of ΔUAmin and ΔCVC in hypovolaemia were only ∼50% of those in normovolaemia, and may have affected the regression analyses. On the other hand, the regression equation between ΔLAmin and ΔSR in normovolaemia was almost identical to that in hypovolaemia; even the slope and the intercept of regression equations were both significantly smaller in hypovolaemia than normovolaemia, suggesting that the sweating response was largely explained by LAmin in both groups.
If the microneurography recording included MSNA spikes then UAmin and UAbeat could demonstrate synchronization with the cardiac cycle; however, this is not likely since the SSNA signal was confirmed by the three criteria stated in the Methods. In addition, we found that UAmin and UAbeat increased with a rise in Toes; moreover, the increases were attenuated in hypovolaemia compared to those in normovolaemia. Thus, the responses of UAmin and UAbeat to hyperthermia in hypovolaemia occurred in the opposite direction of the predicted responses by MSNA to hypovolaemia (Rowell & Seals, 1990; Kamiya et al. 2003; Kimmerly & Shoemaker, 2003; Convertino et al. 2004). Therefore, we are certain that UAmin and UAbeat were not contaminated with MSNA signals.
We failed to find any significant differences in BF and tSSNA calculated from rectified and filtered SSNA measurements as shown in the Supplemental material, which has been used by other previous studies (Cui et al. 2004; Kamijo et al. 2005a). However, BF in MSNA is reported to be highly reproducible from day to day (Kimmerly et al. 2004). The inter-individual differences in SSNA burst amplitude might be caused by the population of activated sympathetic fibres as well as by the location of the tip of the active electrode at the sympathetic nervous fascicles (Macefield et al. 2002; Young et al. 2009). Therefore, we calculated tSSNA from the BF and burst area, which was expressed as per cent of the maximal value during thermoneutral conditions in each subject. Furthermore, we focused our attention on changes in BF and/or tSSNA in response to an increase in Toes, but not on the SSNA level between the groups (Young et al. 2009). One possible reason for failing to find any significant differences in the variables between groups despite such careful SSNA measurements was that the signals of active vasodilator fibres were too sparse and small to be detected compared with those of sudomotor fibres by using the previous method. Indeed, in the present study, we successfully identified the signal and found that it was only ∼20% of total SSNA signal.
Sugenoya et al. (1995) measured SkBF and SR continuously on the dorsal foot by laser-Doppler flowmetery and hygrometry, respectively, in passively heated humans and found that a transient increase of SkBF was accompanied by a high probability of sweat expulsion, suggesting that active vasodilator activity was closely related to sudomotor activity. However, they measured these two parameters during a small increase (∼0.1°C) of tympanic temperature and tracked only small transient increases in SkBF and a sweat pulsation while controlling SkBF and SR very close to the pre-warming baselines. In the present study, SkBF increased by 3–fold and SR by 7–fold from the pre-warning levels with an increase of Toes of ∼0.5°C. These results suggest that a suppression of SkBF response to hyperthermia occurs in the situation where arterial pressure regulation would be threatened, such as when a large amount of blood flow is demanded by the skin vasculature due to hyperthermia, and we thought that the suppression would be enhanced by hypovolaemia. In the present study, we confirmed that a reduction of SkBF in hypovolaemia was not accompanied by a reduction in SR and have successfully identified the possible efferent signal of SSNA for this regulation.
In conclusion, we found a component of the SSNA spike synchronized with the cardiac cycle that increased with a rise in Toes during passive warming, and was suppressed in hypovolaemia compared with normovolaemia. This component might be an active vasodilator signal for skin vessels and the efferent path for active cutaneous vasodilatation modulated by baroreflex.
Acknowledgments
We thank Mr Hironobu Satoh for his technical assistance. We also thank Drs Hirokazu Genno and Shizue Masuki of Department of Sports Medical Sciences, Shinshu University Graduate School of Medicine, for their helpful comments/suggestions to improve the manuscript. Further, we thank Dr Gary W. Mack of Department of Exercise Science, Brigham Young University for editing of the English in this manuscript. This work was supported by grants from the Ministry of Education, Culture, Sports, Science, and Technology of Japan (Grant-in-Aid for Young Scientists (B) to Y.-i.K., 16790143, Grant-in-Aid for Scientific Research (A) to H.N., 17209007). The authors have no interests to disclose.
Glossary
Abbreviations
- [Ad]p
plasma adrenaline concentration
- [AGII]p
plasma angiotensin II concentration
- [AVP]p
plasma arginine vasopressin concentration
- BF
bursts frequency
- CVC
cutaneous vascular conductance
- DBP
diastolic blood pressure
- HR
heart rate
- LA
lower area below the valley of the averaged spike incidence histogram for 5 s as a component non-synchronized with the cardiac cycle
- LAbeat
lower area per a heartbeat
- LAmin
lower area per minute
- MAP
mean arterial pressure
- MSNA
muscle sympathetic nerve activity
- [NA]p
plasma noradrenaline concentration
- Posmol
plasma osmolality
- PP
pulse pressure
- PV
plasma volume
- RH
relative humidity
- RR
respiratory rate
- SBP
systolic blood pressure
- SkBF
skin blood flow
- SR
sweat rate
- SSNA
skin sympathetic nerve activity
- Ta
ambient temperature
- Toes
oesophageal temperature
- tSSNA
total skin sympathetic nerve activity
- TR
an interval for R-wave incidence
- TRS
a firing timing of SSNA spike after R-wave
- TS
an interval for SSNA spike incidence
- Tsk
mean skin temperature
- UA
upper area above the valley of the averaged spike incidence histogram for 5 s as a component synchronized with the cardiac cycle
- UAbeat
upper area per a heartbeat
- UAmin
upper area per minute
Author contributions
Y.-i.K. and H.N. designed the study; Y.-i.K., Y.O., S.I., K.O. and M.G. performed the experiments; Y.-.K., H.N., Y.O. and S.I. analysed the data; Y.-i.K. and H.N. wrote the manuscript. All authors approved the final version.
Supplementary material
Supplemental Material
As a service to our authors and readers, this journal provides supporting information supplied by the authors. Such materials are peer-reviewed and may be re-organized for online delivery, but are not copy-edited or typeset. Technical support issues arising from supporting information (other than missing files) should be addressed to the authors
References
- Ahmad M, Blomqvist CG, Mullins CB, Willerson JT. Left ventricular function during lower body negative pressure. Aviat Space Environ Med. 1977;48:512–515. [PubMed] [Google Scholar]
- Bini G, Hagbarth KE, Hynninen P, Wallin BG. Thermoregulatory and rhythm-generating mechanisms governing the sudomotor and vasoconstrictor outflow in human cutaneous nerves. J Physiol. 1980;306:537–552. doi: 10.1113/jphysiol.1980.sp013413. [DOI] [PMC free article] [PubMed] [Google Scholar]
- Bini G, Hagbarth KE, Wallin BG. Cardiac rhythmicity of skin sympathetic activity recorded from peripheral nerves in man. J Auton Nerv Syst. 1981;4:17–24. doi: 10.1016/0165-1838(81)90003-5. [DOI] [PubMed] [Google Scholar]
- Convertino VA, Ludwig DA, Cooke WH. Stroke volume and sympathetic responses to lower-body negative pressure reveal new insight into circulatory shock in humans. Auton Neurosci. 2004;111:127–134. doi: 10.1016/j.autneu.2004.02.007. [DOI] [PubMed] [Google Scholar]
- Crandall CG, Johnson JM, Kosiba WA, Kellogg DL., Jr Baroreceptor control of the cutaneous active vasodilator system. J Appl Physiol. 1996;81:2192–2198. doi: 10.1152/jappl.1996.81.5.2192. [DOI] [PubMed] [Google Scholar]
- Cui J, Wilson TE, Crandall CG. Orthostatic challenge does not alter skin sympathetic nerve activity in heat-stressed humans. Auton Neurosci. 2004;116:54–61. doi: 10.1016/j.autneu.2004.08.009. [DOI] [PubMed] [Google Scholar]
- Edholm OG, Fox RH, Macpherson RK. Vasomotor control of the cutaneous blood vessels in the human forearm. J Physiol. 1957;139:455–465. doi: 10.1113/jphysiol.1957.sp005904. [DOI] [PMC free article] [PubMed] [Google Scholar]
- Fagius J, Wallin BG. Sympathetic reflex latencies and conduction velocities in normal man. J Neurol Sci. 1980;47:433–448. doi: 10.1016/0022-510x(80)90098-2. [DOI] [PubMed] [Google Scholar]
- Greenleaf JE, Convertino VA, Mangseth GR. Plasma volume during stress in man: osmolality and red cell volume. J Appl Physiol. 1979;47:1031–1038. doi: 10.1152/jappl.1979.47.5.1031. [DOI] [PubMed] [Google Scholar]
- Hagbarth KE, Hallin RG, Hongell A, Torebjork HE, Wallin BG. General characteristics of sympathetic activity in human skin nerves. Acta Physiol Scand. 1972;84:164–176. doi: 10.1111/j.1748-1716.1972.tb05167.x. [DOI] [PubMed] [Google Scholar]
- Halar EM, DeLisa JA, Brozovich FV. Peroneal nerve conduction velocity: the importance of temperature correction. Arch Phys Med Rehabil. 1981;62:439–443. [PubMed] [Google Scholar]
- Honig CR. Modern Cardiovascular Physiology. Boston: Little, Brown and Company; 1981. [Google Scholar]
- Ikegawa S, Kamijo Y, Okazaki K, Masuki S, Okada Y, Nose H. Effects of hypohydration on thermoregulation during exercise before and after 5-day aerobic training in a warm environment in young men. J Appl Physiol. 2011;110:972–980. doi: 10.1152/japplphysiol.01193.2010. [DOI] [PubMed] [Google Scholar]
- Kamijo Y, Lee K, Mack GW. Active cutaneous vasodilation in resting humans during mild heat stress. J Appl Physiol. 2005a;98:829–837. doi: 10.1152/japplphysiol.00235.2004. [DOI] [PubMed] [Google Scholar]
- Kamijo Y, Okumoto T, Takeno Y, Okazaki K, Inaki M, Masuki S, Nose H. Transient cutaneous vasodilatation and hypotension after drinking in dehydrated and exercising men. J Physiol. 2005b;568:689–698. doi: 10.1113/jphysiol.2005.090530. [DOI] [PMC free article] [PubMed] [Google Scholar]
- Kamiya A, Michikami D, Hayano J, Sunagawa K. Heat stress modifies human baroreflex function independently of heat-induced hypovolemia. Jpn J Physiol. 2003;53:215–222. doi: 10.2170/jjphysiol.53.215. [DOI] [PubMed] [Google Scholar]
- Kellogg DL, Jr, Johnson JM, Kosiba WA. Baroreflex control of the cutaneous active vasodilator system in humans. Circ Res. 1990;66:1420–1426. doi: 10.1161/01.res.66.5.1420. [DOI] [PubMed] [Google Scholar]
- Kienbaum P, Karlssonn T, Sverrisdottir YB, Elam M, Wallin BG. Two sites for modulation of human sympathetic activity by arterial baroreceptors? J Physiol. 2001;531:861–869. doi: 10.1111/j.1469-7793.2001.0861h.x. [DOI] [PMC free article] [PubMed] [Google Scholar]
- Kimmerly DS, O'Leary DD, Shoemaker JK. Test-retest repeatability of muscle sympathetic nerve activity: influence of data analysis and head-up tilt. Auton Neurosci. 2004;114:61–71. doi: 10.1016/j.autneu.2004.06.005. [DOI] [PubMed] [Google Scholar]
- Kimmerly DS, Shoemaker JK. Hypovolemia and MSNA discharge patterns: assessing and interpreting sympathetic responses. Am J Physiol Heart Circ Physiol. 2003;284:H1198–H1204. doi: 10.1152/ajpheart.00229.2002. [DOI] [PubMed] [Google Scholar]
- Macefield VG, Elam M, Wallin BG. Firing properties of single postganglionic sympathetic neurones recorded in awake human subjects. Auton Neurosci. 2002;95:146–159. doi: 10.1016/s1566-0702(01)00389-7. [DOI] [PubMed] [Google Scholar]
- Macefield VG, Wallin BG. The discharge behaviour of single sympathetic neurones supplying human sweat glands. J Auton Nerv Syst. 1996;61:277–286. doi: 10.1016/s0165-1838(96)00095-1. [DOI] [PubMed] [Google Scholar]
- Mack G, Nose H, Nadel ER. Role of cardiopulmonary baroreflexes during dynamic exercise. J Appl Physiol. 1988;65:1827–1832. doi: 10.1152/jappl.1988.65.4.1827. [DOI] [PubMed] [Google Scholar]
- Nadel ER, Fortney SM, Wenger CB. Effect of hydration state of circulatory and thermal regulations. J Appl Physiol. 1980;49:715–721. doi: 10.1152/jappl.1980.49.4.715. [DOI] [PubMed] [Google Scholar]
- Nagashima K, Nose H, Takamata A, Morimoto T. Effect of continuous negative-pressure breathing on skin blood flow during exercise in a hot environment. J Appl Physiol. 1998;84:1845–1851. doi: 10.1152/jappl.1998.84.6.1845. [DOI] [PubMed] [Google Scholar]
- Roberts MF, Wenger CB, Stolwijk JA, Nadel ER. Skin blood flow and sweating changes following exercise training and heat acclimation. J Appl Physiol. 1977;43:133–137. doi: 10.1152/jappl.1977.43.1.133. [DOI] [PubMed] [Google Scholar]
- Rothstein A, Towbin EJ. Blood circulation and temperature of men dehydrating in the heat. In: Adolpf EF, editor. Physiology of Man in the Desert. New York: Interscience; 1947. pp. 172–196. [Google Scholar]
- Rowell LB, Seals DR. Sympathetic activity during graded central hypovolemia in hypoxemic humans. Am J Physiol Heart Circ Physiol. 1990;259:H1197–H1206. doi: 10.1152/ajpheart.1990.259.4.H1197. [DOI] [PubMed] [Google Scholar]
- Sugenoya J, Ogawa T, Jmai K, Ohnishi N, Natsume K. Cutaneous vasodilatation responses synchronize with sweat expulsions. Eur J Appl Physiol Occup Physiol. 1995;71:33–40. doi: 10.1007/BF00511230. [DOI] [PubMed] [Google Scholar]
- Sundlof G, Wallin BG. Human muscle nerve sympathetic activity at rest. Relationship to blood pressure and age. J Physiol. 1978;274:621–637. doi: 10.1113/jphysiol.1978.sp012170. [DOI] [PMC free article] [PubMed] [Google Scholar]
- Vallbo AB, Hagbarth KE, Torebjork HE, Wallin BG. Somatosensory, proprioceptive, and sympathetic activity in human peripheral nerves. Physiol Rev. 1979;59:919–957. doi: 10.1152/physrev.1979.59.4.919. [DOI] [PubMed] [Google Scholar]
- Vissing SF. Differential activation of sympathetic discharge to skin and skeletal muscle in humans. Acta Physiol Scand Suppl. 1997;639:1–32. [PubMed] [Google Scholar]
- Wilson TE, Cui J, Crandall CG. Absence of arterial baroreflex modulation of skin sympathetic activity and sweat rate during whole-body heating in humans. J Physiol. 2001;536:615–623. doi: 10.1111/j.1469-7793.2001.0615c.xd. [DOI] [PMC free article] [PubMed] [Google Scholar]
- Young CN, Keller DM, Crandall CG, Fadel PJ. Comparing resting skin sympathetic nerve activity between groups: caution needed. J Appl Physiol. 2009;106:1751–1752. doi: 10.1152/japplphysiol.91538.2008. author reply 1753. [DOI] [PubMed] [Google Scholar]
Associated Data
This section collects any data citations, data availability statements, or supplementary materials included in this article.