Abstract
The transition from ductal carcinoma in situ to invasive ductal carcinoma is a key event in breast cancer progression that is still not well understood. To discover the microRNAs regulating this critical transition, we used 80 biopsies from invasive ductal carcinoma, 8 from ductal carcinoma in situ, and 6 from normal breast. We selected them from a recently published deep-sequencing dataset [Farazi TA, et al. (2011) Cancer Res 71:4443–4453]. The microRNA profile established for the normal breast to ductal carcinoma in situ transition was largely maintained in the in situ to invasive ductal carcinoma transition. Nevertheless, a nine-microRNA signature was identified that differentiated invasive from in situ carcinoma. Specifically, let-7d, miR-210, and -221 were down-regulated in the in situ and up-regulated in the invasive transition, thus featuring an expression reversal along the cancer progression path. Additionally, we identified microRNAs for overall survival and time to metastasis. Five noncoding genes were associated with both prognostic signatures—miR-210, -21, -106b*, -197, and let-7i, with miR-210 the only one also involved in the invasive transition. To pinpoint critical cellular functions affected in the invasive transition, we identified the protein coding genes with inversely related profiles to miR-210: BRCA1, FANCD, FANCF, PARP1, E-cadherin, and Rb1 were all activated in the in situ and down-regulated in the invasive carcinoma. Additionally, we detected differential splicing isoforms with special features, including a truncated EGFR lacking the kinase domain and overexpressed only in ductal carcinoma in situ.
Keywords: invasion, triple negative, tumor suppression, next-generation sequencing
Breast cancer (BC) is a complex disease, characterized by heterogeneity of genetic alterations and influenced by several environmental factors. Individual molecular markers were introduced in BC diagnosis years ago, as a consequence of gene expression profiling (1). Gene expression studies have shown that estrogen receptor (ER)-positive and ER-negative BCs are distinct diseases in molecular terms. Two key molecular signatures, PR and HER2, were fundamental in delineation of classification and treatments. “Triple-negative” BCs (TNBCs)—lacking ER, progesterone receptor (PR), and HER2 expression—are aggressive malignancies not responsive to current targeted therapies. Ductal carcinoma in situ (DCIS) is a heterogeneous group of lesions reflecting the proliferation of malignant cells within the breast ducts without invasion through the basement membrane (2). The currently accepted stepwise model of breast tumorigenesis assumes a gradual transition from epithelial hyperproliferation to DCIS and then to invasive ductal carcinoma (IDC). This progression model is strongly supported by clinical and epidemiological data and by molecular clonality studies. Until 1980, DCIS was diagnosed rarely and represented <1% of BCs. With the increased use of mammography, DCIS became the most rapidly increasing subset of BC, accounting for 15–25% of newly diagnosed BC cases in the United States. Several genome-wide mRNA expression studies failed to identify progression stage-specific genes. A dramatic change occurs during the normal to DCIS transition, but surprisingly, in situ and invasive breast carcinomas of the same histological subtype essentially share the same genetic and epigenetic alterations and expression patterns (3). In contrast, the mRNA profiles of breast tumors of distinct subtypes (luminal, HER2+, and basal-like) are dramatically different. The expression and mutation status of numerous tumor suppressors and oncogenes have been analyzed in DCIS and IDC—including TP53, PTEN, PIK3CA, ERBB2, and MYC—and differences have been found according to the tumor subtype but not histological stage. For example, mutations in TP53 are more frequent in basal-like and HER2+ subtypes compared with luminal tumors; in basal-like cases, PIK3CA is rarely mutated, but PTEN is frequently lost; and amplification of ERBB2 is specific for the HER2+ subtype.
The expression of several candidate genes selected based on their biological function has also been analyzed in DCIS (4). Two recent studies identified a set of promising markers that may correlate with the risk of recurrence of DCIS (5, 6). The first study demonstrated that high expression of COX-2 and Ki67 in DCIS correlates with higher risk of local recurrence and also implicated abnormalities in the Rb pathway as potential contributors to invasive progression. The second study identified functional cooperation between ERBB2 and 14-3-3z that may increase the risk of invasive progression through promotion of epithelial to mesenchymal transition. A major limitation of both investigations was the use of small patient cohorts, thus increasing the probability of detecting associations that may not hold up in later studies. Better understanding of DCIS lesions may provide strategies for arresting invasion at the premalignant stage (7).
MicroRNA (miRNA) is a class of conserved noncoding RNAs with regulatory functions (8) that exert important roles in cancer (9). In 2005, our group, using microarrays, identified differentially expressed miRNAs in BC in relation to different clinical subgroups (10). Other groups later reported clinical studies on prognostic roles for miRNAs in large patient cohorts, using miRNA microarrays (11–13). These studies independently linked miR-210 to BC and showed that its expression levels correlated with tumor aggressiveness and poor prognosis. Microarray analysis of miRNAs has been generating much new knowledge in recent years. Methods based on next-generation sequencing can now provide a more detailed view of the noncoding transcriptome and thus should yield greater accuracy in characterization of clinical subtypes and identification of novel prognostic markers. Farazi et al. (14) recently used this technology in studies of BC and determined miR-423 as an independent predictor of outcome. They could not confirm the impact of miR-210 in their patient cohort and did not establish significant miRNAs in the DCIS to IDC transition. The only candidate, miR-142, was not expressed in BC cell lines, and thus the investigators concluded that its presence was due to infiltration of hemopoietic cells within the tumors.
Results
miRNAs Define the in Situ to IDC Transition.
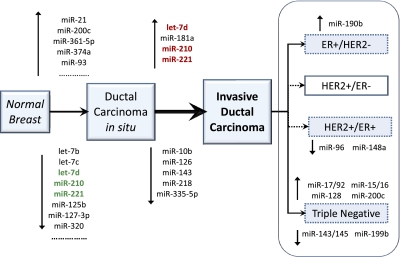
We generated miRNA profiles for IDC, DCIS, and normal breast. Using an unbiased approach to the complexity selection of sequencing runs, we obtained robust and highly informative miRNA profiles for BC. To this purpose, we used the sequencing data recently generated by Farazi et al. (14). We developed a unique procedure to determine the minimum number of reads necessary to yield miRNA profiles representative of the human repertoire (Fig. S1). For this BC dataset, the minimal required complexity was 98,000 reads. Applying this threshold, 78 low-complexity BC runs were excluded (43%), and 107 (57%) were retained for further statistical analysis. Using this trimmed dataset, we generated an expression matrix representative of high-, medium-, and low-abundance miRNA species. Sixty-six miRNAs were differentially regulated in DCIS in comparison with normal breast (Table S1 and Fig. S2). To identify the miRNAs specifically altered in tumor invasion, we compared DCIS and IDC samples. Nine miRNAs were differentially modulated in the DCIS to IDC transition (Table S2). We defined these nine miRNAs as the invasiveness microsignature: miR-210, let-7d, miR-181a, and -221 were activated, whereas miR-10b, -126, -218, -335-5p, and -143 were repressed (Fig. 1). Among these nine miRNAs, let-7d, miR-210, and -221 were those with the most extreme changes in expression, being first down-regulated in DCIS, relative to normal, and then up-regulated in IDC. None of the miRNAs involved in the DCIS/IDC transition was involved, with a similar trend, in the early normal/DCIS transition, and no miRNA correlated with tumor grade.
Fig. 1.
The key miRNA changes along the cancer progression from normal breast to DCIS and then to IDC. The three miRNAs with bold typeface were those with expression reversal, as indicated by the colors (red, up-regulation; green, down-regulation). Sixty-six miRNAs were deregulated in the first transition, normal breast to DCIS (only the most significant miRNAs are listed). Nine miRNAs were deregulated in the invasion transition, DCIS to IDC, and they are all listed. We defined this second signature as the invasiveness microsignature. None of the miRNAs involved in the invasion transition was differentially regulated, with the same trend in the first carcinoma transition.
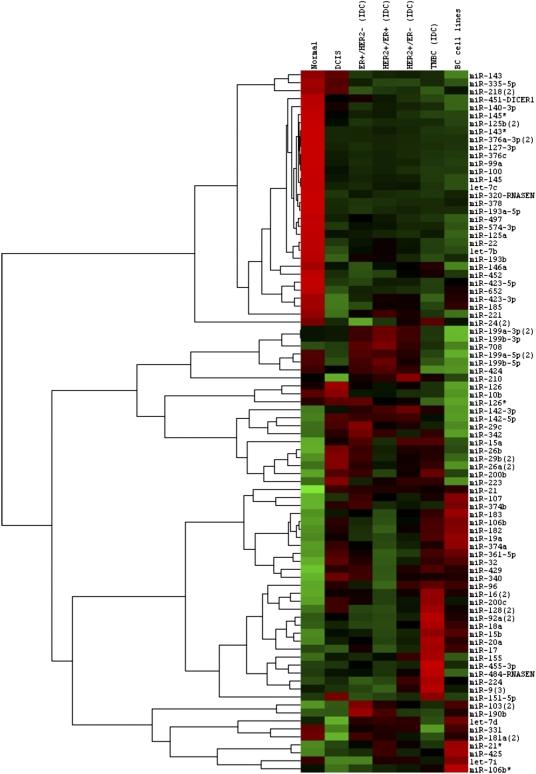
We identified differentially expressed miRNA in the IDC subtypes. Examples are as follows: miR-190 was overexpressed in ER+/HER2− IDC (P < 0.001; fold changes = 1.96); triple-negative IDC (TNBC) was characterized by activation of the Myc-regulated miR17/92 oncomir cluster, miR-200c, and -128 (P < 0.001; fold changes > 2); and miR-145, -143*, -331, and -199b-5p were the most repressed miRNAs in TNBC (P < 0.001; fold changes < 0.5). Conversely, miR-200c was among the most repressed miRNAs in ER+/HER2+ double-positive BCs, together with miR-148a and -96 (P < 0.001). The deregulated miRNAs in four IDC clinical subgroups (ER+/HER2−, HER2+/ER−, ER+/HER2+, and triple negative) are shown in Fig. 2, along with those prominent in DCIS and normal breast. BC cell lines were included in the analysis. We also examined the miRNA profiles of the BC molecular subtypes, described according to Farazi et al. (14). Luminal B and basal were the subtypes best characterized by miRNAs. miR-190 and -425 overexpression was associated with Luminal B (P ≤ 0.001). miR-452, -224, -155, and -9 and the miR-17/92 cluster were associated with the basal. Finally, the miRNAs present in the tumors, but not in normal breast and not in the BC cell lines, were likely the results of contaminating cell types; miR-142 and -223 were two such miRNAs (Fig. 2). In fact, miR-142 and -223 are both highly specific for the hemopoietic system (15), like miR-342, another miRNA in the same expression cluster (Fig. 2). Other hemopoietic miRNAs in this nonbreast gene cluster included miR-29 and -26.
Fig. 2.
The miRNAs deregulated in four IDC clinical subgroups (ER+/HER2−, HER2+/ER−, ER+/HER2+, and triple negative) and in DCIS and normal breast. BC cell lines were included in the analysis (BT474, HCC38, MCF7, MDA-MB134, and ZR-751). Average expression is shown for each miRNA in each class. Expression was mean centered for each miRNA.
Prognostic miRNA Signatures for Time to Metastasis and Overall Survival in Breast Carcinoma.
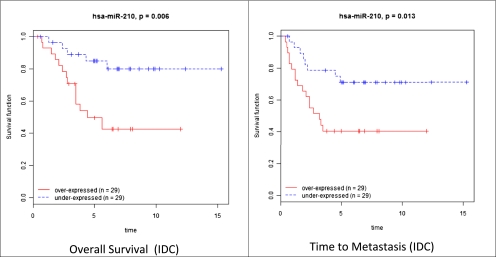
We studied the association between miRNAs and prognosis using two clinical parameters: time to metastasis and overall survival. The differentially expressed miRNAs in the normal/DCIS, DCIS/IDC transitions, and the different IDC subtypes described above (Fig. 2) were investigated; miR-127-3p, miR-210, -185, -143*, and let-7b were among the miRNAs significantly associated with time to metastasis, as determined by univariate and multivariate analysis (Table S3). miR-210, -21, -221, and -652 were among those correlated with overall survival (Table S4), with miR-210, -21, -106b*, -197, and let-7i common to both prognostic signatures. Among these five common miRNAs, miR-210 was the only one present in the invasiveness microsignature. The Kaplan–Meier curves for miR-210 in time to metastasis and overall survival of IDC patients are shown in Fig. 3.
Fig. 3.
The Kaplan–Meier curves for miR-210 in time to metastasis and overall survival of patients with IDC. miR-210 was the only miRNA associated to prognosis and present in the invasiveness microsignature.
miR-210 and HIF1A Coupling in BC Progression.
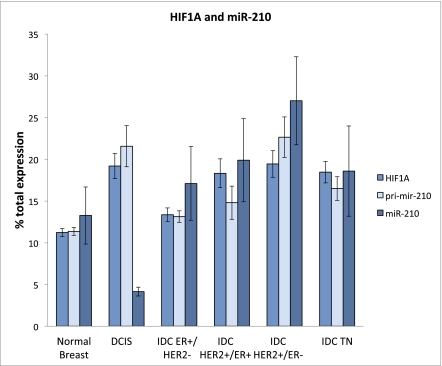
miR-210 has been shown to be inducible by hypoxia and to regulate genes involved in tumor initiation (16). Thus, we studied HIF1A and the primary RNA for miR-210 (pri-mir-210) in BC progression, using Affymetrix microarray data (Table S5). As expected, there was very good correlation between HIF1A and pri-mir-210 RNA (P < 0.001); we then compared each BC subtype for the relative amounts of mature miR-210, pri-mir-210, and HIF1A (Fig. 4). The mature miR-210 expression is shown alongside that of pri-mir-210 and HIF1A RNA for each BC subtype and for normal breast. The RNA measures are indicated as percent of the total for each RNA within the groups. The levels of HIF1A, pri-mir-210, and mature miR-210 were always maximal in the HER2+/ER− tumors, whereas the lowest levels of HIF1A and pri-mir-210 were in normal breast. Levels of HIF1A are thought to indicate hypoxia (16), and the low level of HIF1A in normal breast tissue was in agreement with normoxia. HIF1A mRNA was strongly induced in DCIS, where hypoxia is thus likely to occur. As expected, pri-mir-210 transcription, which is driven by a hypoxia-sensitive promoter, was accordingly activated in DCIS. The HIF1A/pri-mir-210 ratio was maintained across the diverse IDC subgroups. There was a single exception to coupling of mature miR-210 and pri-mir-210 RNA in DCIS. DCIS expressed high levels of HIF1A and pri-mir-210, suggesting hypoxia, but by far the lowest level of mature miR-210 in the series, indicating strong pressure for strict down-regulation.
Fig. 4.
The expression of mature miR-210, its primary RNA (pri-mir-210), and HIF1A for each BC subtype and for normal breast. The average was computed within each group and reported as percentage of the total for that RNA among the different groups.
Restricted Set of BC Genes Defines the in Situ and Invasive Transitions.
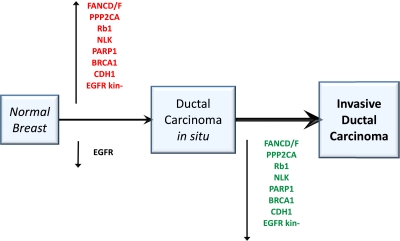
Because of the unique role of miR-210 in invasion and prognosis, we investigated the proteins and functions controlled by its expression in BC. Thus, we examined the whole transcriptomes from Affymetrix profiles of 42 normal breast, 17 DCIS, and 118 IDC samples (51 ER+/HER2−, 17 HER2+/ER−, 17 HER2+/ER+, and 33 TNBC). We searched for genes compatible with being direct or indirect targets of miR-210—i.e., those with antagonist behavior to that of miR-210, up-regulated in DCIS, and down-regulated in IDC. DCIS cases had 4,524 up-regulated probe sets (out of 8,930; false detection rate < 0.05); among them, 1,761 probe sets (corresponding to 1,353 genes) were down-regulated in IDC, thus representing potential miR-210 targets or its downstream effects. BC was the only disease significantly associated with these genes (25 genes; Enrichment P < 0.001). BC genes regulated in an antagonistic fashion to miR-210, along the DCIS/IDC progression axis, included RB1, BRCA1, FANCD, FANCF, PP2CA, PARP1, NLK, E-cadherin (CDH1), and EHMT1 (Fig. 5 and Fig. S3). Pathways regulated by genes inversely related to miR-210 in BC were as follows: caspase cascade in apoptosis, HER2 receptor recycling, TNFR1 signaling, FAS signaling (CD95), and BRCA1, BRCA2, and ATR in cancer susceptibility. Some of these genes were also differentially regulated according to their splicing isoforms. EGFR classical isoforms were expressed in normal breast and down-regulated in DCIS. Intriguingly, a truncated EGFR variant (uc003tqi.2), lacking the whole tyrosine kinase domain, was not expressed in normal breast or in IDC, but was specifically overexpressed in DCIS. Splicing variants of other genes exhibiting differential tumor subgroup expression were nibrin and ErbB3.
Fig. 5.
Key BC genes were inversely related to miR-210 and displayed expression reversal along the BC progression path. BC was the only significant disease identified (25 genes; Enrichment P < 0.001). BC genes regulated in an antagonistic fashion to miR-210, along the DCIS/IDC progression axis, included RB1, BRCA1, FANCD, FANCF, PP2CA, PARP1, NLK, CDH1, and EHMT1. Pathways inversely related to miR-210 in BC were caspase cascade in apoptosis, HER2 receptor recycling, TNFR1 signaling, FAS signaling (CD95), and BRCA1, BRCA2, and ATR in cancer susceptibility. Some of the genes in the pathways had differential regulation of their splicing isoforms. For example, EGFR classical isoforms were expressed in normal breast and down-regulated in DCIS. A shorter EGFR variant (uc003tqi.2), lacking the tyrosine kinase domain, was specifically overexpressed in DCIS.
Discussion
We processed miRNA data from deep sequencing (14) to obtain highly informative miRNA profiles for BC, which included normal breast, in situ, and IDCs. The comparison between normal breast and IDC confirmed the miRNA deregulation reported in other studies (10). Our work extends substantially the knowledge of the miRNA role in BC progression, with the identification of miR-210 and other key miRNAs involved in the normal breast/DCIS and DCIS/IDC transitions. miR-210 was originally identified in our study on solid cancer signatures, because it was up-regulated both in breast and lung cancer (17). Additionally, we defined here differentially regulated miRNAs in some histological and molecular BC types. Furthermore and foremost, our work has clinical relevance because it determined miRNA associated with time to metastasis and overall survival. All noncoding genes that we identified in the prognostic signatures were associated with poor outcome, with the exception of miR-21 (17, 18). This behavior fit very well with miRNA expression along the DCIS–IDC axis. In fact, the expression of miR-21, highly increased in DCIS, was maintained or even lowered in IDC. Most of the other prognostic miRNAs had decreases of expression in DCIS and increases in IDC. Farazi et al. (14) identified miR423-3p as associated with prognosis. Foekens et al. (11) linked miR-210 to ER+ BC aggressiveness and to metastatic capability in ER− and TNBC. Camps et al. (12) independently linked miR-210 to prognosis in BC. In our trimmed dataset, miR-423-3p was still significant, by multivariate Cox regression and univariate analysis, in overall survival. However, we were able to extend the number of miRNAs associated with prognosis and to confirm miR-210. miR-221, another up-regulated gene in the invasion transition, was previously identified as a basal-like subtype-specific miRNA that decreases expression of epithelial-specific genes and increases expression of mesenchymal genes (19). In our study, miR-126 and -335 were among the five miRNAs down-regulated in the DCIS/IDC transition, a finding in complete agreement with reports that metastatic growth is initiated by suppression of miR-126 and -335 in BC (20, 21). Nevertheless, they were not associated with time to metastasis or overall survival in our analysis. Another miRNA down-regulated in the DCIS/IDC transition was miR-10b, and, in agreement with other reports, we did not find association of miR-10b to metastasis (22). mir-218, also down-regulated in the invasiveness miRNA-signature, was recently shown to play a critical role in nasopharyngeal carcinoma (23) and gastric cancer (24) progression. Lastly, two miRNAs with an inverse association to risk were miR-142-5p and miR-142-3p. They were probably not from BC cells, because they were not expressed in BC cell lines and are abundant in white blood cells. Their expression was inversely associated with time to metastasis, as expected from components of the immune system.
Very few laboratories have reported detailed molecular analysis of the normal/DCIS and DCIS/IDC transitions in BC progression. Schuetz et al. (25) described a matched-pair analysis of DCIS and IDC tissues from nine patients and identified 546 significantly differentially expressed probe sets. Examples of genes already known to be associated with BC invasion are BPAG1, LRRC15, MMP11, and PLAU. We took advantage of the invasive miRNA signature that we determined here to identify genes and functions associated with BC progression. Among the nine miRNAs in the invasiveness signature, miR-210 was the only one associated to prognosis and showing expression reversal. Thus, we focused on protein-coding genes that behaved antagonistically to miR-210 during BC progression. For these genes, we identified the deregulated pathways, which in turn corresponded to a small group of key BC genes. These genes, activated in DCIS and down-regulated in IDC, included BRCA1, RB1, FANCD, FANCF, PP2CA, EGFR, PARP1, NLK, CDH1, and EHMT1. CDH1, which is down-regulated and often deleted in BC, is also one of the markers for epithelial to mesenchymal transition (26).
In conclusion, we studied the global changes of the miRNA repertoire along the transitions defining BC progression. We identified a nine-miRNA microsignature specific for invasiveness and five miRNAs associated with time to metastasis and overall survival in IDC patients. miR-210, which we showed here to be regulated during BC progression, was also a component of the two prognostic signatures. Finally, a set of highly prominent BC genes was expressed in a miR-210 antagonistic fashion.
Materials and Methods
The raw data for short RNA sequences were obtained from Farazi et al. (14). The GEO database accession number for this dataset was GSE29173. We calculated the minimal run complexity of 98,000 reads for optimal representation of breast miRNA profiles with Complexity50. We computed Complexity50 as the median complexity of the nearest neighbors centered on Representation50 (Fig. S1). Thus, we included in our study only those runs that had complexity larger than Complexity50—(i.e., 107 samples were retained out of 185) (Table S6). The normalization of the different runs was performed by using a modification of RPKM (27). Because the lengths of the different miRNA species are almost constant, we did not include the miRNA length in the normalization, which thus was simply computed as reads per million (RPM). We thresholded the expression data at 200 RPM and excluded miRNAs for which <20% of expression values had <1.5 fold change in either direction from the miRNA median value. The final expression matrix contained measures for 159 miRNAs in 107 samples. The two-sample t test was used for two-class comparisons (i.e., IDC vs. DCIS). A multivariate permutations test was computed based on 1,000 random permutations. The false detection rate was used to assess the multiple testing errors. The confidence level of false discovery rate assessment was 80%, and the maximum allowed proportion of false positive genes was of 5%.
We identified miRNA whose expression was significantly related to time to metastasis and overall survival using Cox proportional hazards models (28). We then performed permutation tests in which the times and censoring indicators were randomly permuted among samples. Permutation P values for significant genes were computed based on 10,000 random permutations. Hazard ratios were computed for a twofold change in the miRNA expression level. For each significant miRNA based upon the Cox regression, we plotted Kaplan–Meier survival curves, in which the patients were split into two groups at the median expression and the difference between the curves was assessed with the log-rank test. Whole-transcriptome profiles for human normal breast, DCIS, and IDC were derived from Affymetrix human genome U133 Plus 2.0 arrays (Table S5). Forty-two normal breast, 17 DCIS, 51 ER+/HER2− IDC, 17 HER2+/ER− IDC, 17 HER2+/ER+ IDC, and 33 triple-negative IDC samples were studied (25, 29). CEL files or RMA data were obtained from the GEO database (GSE3893, GSE2109, GSE21422, and GSE21444). RMA was used alongside quantiles normalization. DAVID EASE was used for Gene Ontology, disease association, and Biocarta pathways analysis (30).
Supplementary Material
Acknowledgments
Microarray analyses were performed by using BRB-ArrayTools developed by Dr. Richard Simon and the BRB-ArrayTools Development Team, BioConductor and R. C.M.C. is supported by National Institutes of Health Grant U01 CA152758 and EDRN; K.H. is funded by National Institutes of Health Grant U01 CA154200; and S.V. is supported by Associazione Italiana per la Ricerca sul Cancro Grant IG 8588 and Italian Progetti di Ricerca di Interesse Nazionale Ministero dell'Istruzione dell'Università e della Ricerca 2008.
Footnotes
The authors declare no conflict of interest.
This article contains supporting information online at www.pnas.org/lookup/suppl/doi:10.1073/pnas.1200010109/-/DCSupplemental.
References
- 1.Perou CM, et al. Molecular portraits of human breast tumours. Nature. 2000;406:747–752. doi: 10.1038/35021093. [DOI] [PubMed] [Google Scholar]
- 2.Polyak K. Molecular markers for the diagnosis and management of ductal carcinoma in situ. J Natl Cancer Inst Monogr. 2010;2010:210–213. doi: 10.1093/jncimonographs/lgq019. [DOI] [PMC free article] [PubMed] [Google Scholar]
- 3.Espina V, Liotta LA. What is the malignant nature of human ductal carcinoma in situ? Nat Rev Cancer. 2011;11:68–75. doi: 10.1038/nrc2950. [DOI] [PMC free article] [PubMed] [Google Scholar]
- 4.Kuerer HM, et al. Ductal carcinoma in situ: State of the science and roadmap to advance the field. J Clin Oncol. 2009;27:279–288. doi: 10.1200/JCO.2008.18.3103. [DOI] [PubMed] [Google Scholar]
- 5.Gauthier ML, et al. Abrogated response to cellular stress identifies DCIS associated with subsequent tumor events and defines basal-like breast tumors. Cancer Cell. 2007;12:479–491. doi: 10.1016/j.ccr.2007.10.017. [DOI] [PMC free article] [PubMed] [Google Scholar]
- 6.Lu J, et al. 14-3-3zeta Cooperates with ErbB2 to promote ductal carcinoma in situ progression to invasive breast cancer by inducing epithelial-mesenchymal transition. Cancer Cell. 2009;16:195–207. doi: 10.1016/j.ccr.2009.08.010. [DOI] [PMC free article] [PubMed] [Google Scholar]
- 7.Burstein HJ, Polyak K, Wong JS, Lester SC, Kaelin CM. Ductal carcinoma in situ of the breast. N Engl J Med. 2004;350:1430–1441. doi: 10.1056/NEJMra031301. [DOI] [PubMed] [Google Scholar]
- 8.Bartel DP. MicroRNAs: Target recognition and regulatory functions. Cell. 2009;136:215–233. doi: 10.1016/j.cell.2009.01.002. [DOI] [PMC free article] [PubMed] [Google Scholar]
- 9.Croce CM. Oncogenes and cancer. N Engl J Med. 2008;358:502–511. doi: 10.1056/NEJMra072367. [DOI] [PubMed] [Google Scholar]
- 10.Iorio MV, et al. MicroRNA gene expression deregulation in human breast cancer. Cancer Res. 2005;65:7065–7070. doi: 10.1158/0008-5472.CAN-05-1783. [DOI] [PubMed] [Google Scholar]
- 11.Foekens JA, et al. Four miRNAs associated with aggressiveness of lymph node-negative, estrogen receptor-positive human breast cancer. Proc Natl Acad Sci USA. 2008;105:13021–13026. doi: 10.1073/pnas.0803304105. [DOI] [PMC free article] [PubMed] [Google Scholar]
- 12.Camps C, et al. hsa-miR-210 Is induced by hypoxia and is an independent prognostic factor in breast cancer. Clin Cancer Res. 2008;14:1340–1348. doi: 10.1158/1078-0432.CCR-07-1755. [DOI] [PubMed] [Google Scholar]
- 13.Rothé F, et al. Global microRNA expression profiling identifies MiR-210 associated with tumor proliferation, invasion and poor clinical outcome in breast cancer. PLoS ONE. 2011;6:e20980. doi: 10.1371/journal.pone.0020980. [DOI] [PMC free article] [PubMed] [Google Scholar]
- 14.Farazi TA, et al. MicroRNA sequence and expression analysis in breast tumors by deep sequencing. Cancer Res. 2011;71:4443–4453. doi: 10.1158/0008-5472.CAN-11-0608. [DOI] [PMC free article] [PubMed] [Google Scholar]
- 15.Landgraf P, et al. A mammalian microRNA expression atlas based on small RNA library sequencing. Cell. 2007;129:1401–1414. doi: 10.1016/j.cell.2007.04.040. [DOI] [PMC free article] [PubMed] [Google Scholar]
- 16.Huang X, et al. Hypoxia-inducible mir-210 regulates normoxic gene expression involved in tumor initiation. Mol Cell. 2009;35:856–867. doi: 10.1016/j.molcel.2009.09.006. [DOI] [PMC free article] [PubMed] [Google Scholar]
- 17.Volinia S, et al. A microRNA expression signature of human solid tumors defines cancer gene targets. Proc Natl Acad Sci USA. 2006;103:2257–2261. doi: 10.1073/pnas.0510565103. [DOI] [PMC free article] [PubMed] [Google Scholar]
- 18.Medina PP, Nolde M, Slack FJ. OncomiR addiction in an in vivo model of microRNA-21-induced pre-B-cell lymphoma. Nature. 2010;467:86–90. doi: 10.1038/nature09284. [DOI] [PubMed] [Google Scholar]
- 19.Stinson S, et al. TRPS1 targeting by miR-221/222 promotes the epithelial-to-mesenchymal transition in breast cancer. Sci Signal. 2011;4:ra41. doi: 10.1126/scisignal.2001538. [DOI] [PubMed] [Google Scholar]
- 20.Tavazoie SF, et al. Endogenous human microRNAs that suppress breast cancer metastasis. Nature. 2008;451:147–152. doi: 10.1038/nature06487. [DOI] [PMC free article] [PubMed] [Google Scholar]
- 21.Png KJ, et al. MicroRNA-335 inhibits tumor reinitiation and is silenced through genetic and epigenetic mechanisms in human breast cancer. Genes Dev. 2011;25:226–231. doi: 10.1101/gad.1974211. [DOI] [PMC free article] [PubMed] [Google Scholar]
- 22.Gee HE, et al. MicroRNA-10b and breast cancer metastasis. Nature. 2008;455:E8–E9. doi: 10.1038/nature07362. [DOI] [PubMed] [Google Scholar]
- 23.Alajez NM, et al. MiR-218 suppresses nasopharyngeal cancer progression through downregulation of survivin and the SLIT2-ROBO1 pathway. Cancer Res. 2011;71:2381–2391. doi: 10.1158/0008-5472.CAN-10-2754. [DOI] [PubMed] [Google Scholar]
- 24.Tie J, et al. MiR-218 inhibits invasion and metastasis of gastric cancer by targeting the Robo1 receptor. PLoS Genet. 2010;6:e1000879. doi: 10.1371/journal.pgen.1000879. [DOI] [PMC free article] [PubMed] [Google Scholar]
- 25.Schuetz CS, et al. Progression-specific genes identified by expression profiling of matched ductal carcinomas in situ and invasive breast tumors, combining laser capture microdissection and oligonucleotide microarray analysis. Cancer Res. 2006;66:5278–5286. doi: 10.1158/0008-5472.CAN-05-4610. [DOI] [PubMed] [Google Scholar]
- 26.Kang Y, Massagué J. Epithelial-mesenchymal transitions: Twist in development and metastasis. Cell. 2004;118:277–279. doi: 10.1016/j.cell.2004.07.011. [DOI] [PubMed] [Google Scholar]
- 27.Mortazavi A, Williams BA, McCue K, Schaeffer L, Wold B. Mapping and quantifying mammalian transcriptomes by RNA-Seq. Nat Methods. 2008;5:621–628. doi: 10.1038/nmeth.1226. [DOI] [PubMed] [Google Scholar]
- 28.Cox DR. Regression models and life-tables. J R Stat Soc, B. 1972;34:187. [Google Scholar]
- 29.Kretschmer C, et al. Identification of early molecular markers for breast cancer. Mol Cancer. 2011;10:15. doi: 10.1186/1476-4598-10-15. [DOI] [PMC free article] [PubMed] [Google Scholar]
- 30.Huang W, Sherman BT, Lempicki RA. Systematic and integrative analysis of large gene lists using DAVID bioinformatics resources. Nat Protoc. 2009;4:44–57. doi: 10.1038/nprot.2008.211. [DOI] [PubMed] [Google Scholar]
Associated Data
This section collects any data citations, data availability statements, or supplementary materials included in this article.


