

Abstract
Airborne particles play critical roles in air quality, health effects, visibility, and climate. Secondary organic aerosols (SOA) formed from oxidation of organic gases such as α-pinene account for a significant portion of total airborne particle mass. Current atmospheric models typically incorporate the assumption that SOA mass is a liquid into which semivolatile organic compounds undergo instantaneous equilibrium partitioning to grow the particles into the size range important for light scattering and cloud condensation nuclei activity. We report studies of particles from the oxidation of α-pinene by ozone and NO3 radicals at room temperature. SOA is primarily formed from low-volatility ozonolysis products, with a small contribution from higher volatility organic nitrates from the NO3 reaction. Contrary to expectations, the particulate nitrate concentration is not consistent with equilibrium partitioning between the gas phase and a liquid particle. Rather the fraction of organic nitrates in the particles is only explained by irreversible, kinetically determined uptake of the nitrates on existing particles, with an uptake coefficient that is 1.6% of that for the ozonolysis products. If the nonequilibrium particle formation and growth observed in this atmospherically important system is a general phenomenon in the atmosphere, aerosol models may need to be reformulated. The reformulation of aerosol models could impact the predicted evolution of SOA in the atmosphere both outdoors and indoors, its role in heterogeneous chemistry, its projected impacts on air quality, visibility, and climate, and hence the development of reliable control strategies.
Keywords: atmospheric aerosol, nitrate radical, kinetic growth mechanism, condensation mechanism
Airborne particles are well-known to negatively affect human health (1) and to contribute to “haze” associated with urban and regional pollution, leading to a reduction in visibility (2). On a global scale, airborne particles scatter solar radiation and can act as cloud condensation (CCN) and ice nuclei (IN), influencing the radiative balance of the atmosphere (3, 4). Currently these effects represent the largest uncertainty in calculations of climate change (5). A major component of atmospheric particles is secondary organic aerosol (SOA) formed via the oxidation of gaseous anthropogenic and biogenic precursor compounds. The SOA material is formed from low-volatility oxidation products (3, 4). However, the processes and species leading to SOA formation and growth are not fully understood, which precludes reliable quantitative predictions of their impacts on climate, visibility, and human health.
Regional and global chemical models have generally underpredicted SOA concentrations compared to those from field measurements (6–9). Inclusion of a number of additional factors such as new SOA precursors, condensed phase chemistry, updated gas-phase chemistry and SOA yields, new primary semivolatile and intermediate volatility species, and improved emissions inventories of both gases and primary organic aerosols have lessened the magnitude of the disagreement (10–18). However, there is still significant uncertainty in predicting ambient SOA levels, and model-measurement discrepancies of a factor of two or more remain common.
One possible source of this uncertainty is that current models typically assume instantaneous equilibrium partitioning of semivolatile organic compounds (SVOCs) between existing liquid airborne particles and the gas phase using the theory of absorptive, activity coefficient-corrected, gas/liquid partitioning described in detail by Pankow (19, 20). Equilibrium partitioning is justified for particles with viscosities in the range of 0.01–100 Pa·s and diffusion coefficients ranging from 10-5 to 10-9 cm2 s-1 (21). A volatility basis set approach has recently been developed for representing the partitioning of SVOCs, which also depends on saturation mass concentration of liquid particles (22).
In this paper, we present laboratory studies of particles formed in the simultaneous oxidation of α-pinene by ozone and NO3 radicals using an aerosol flow system (23). Quantification of the organic nitrate contributions to the SOA provides unique insight into the mechanisms by which particles form and grow, which has important implications for model formulations of SOA, both outdoors and indoors, and the associated impacts predicted based on the model outputs.
Results and Discussion
Oxidants (O3 and NO2) are well mixed in the upstream end of an aerosol flow tube (8.5 m in length, 0.5 m in diameter) described in detail elsewhere (23). The reaction of NO2 with O3 forms NO3 radicals which are mainly “stored” as N2O5 (see SI Text): NO2 + NO3⇌N2O5. After approximately 4 min reaction time, α-pinene is injected. Experiments are performed at relative humidity (RH) < 3% without preexisting seed particles. Reactants, gas-phase products, and SOA then flow into the sampling section of the flow tube, which is equipped with five equally spaced ports (port 1 to port 5). Port 1 corresponds to a reaction time between α-pinene and the NO2/O3/N2O5 mixture of approximately 13 min, whereas port 5 corresponds to a reaction time of approximately 52 min. Most of the experimental data presented hereafter are taken at port 5; no major differences are observed in the SOA measurements between port 1 and port 5, establishing that the chemistry is essentially complete by port 1 and the particles travel along the length of the flow tube to port 5 without further significant modification or “aging.” Integration of the rate equations for a simplified mechanism for this system (see SI Text) shows that the NO3 chemistry is the dominant oxidation process for α-pinene under all experimental conditions, and is sufficiently rapid ( ; ref. 24) so that the reaction is > 90% complete in terms of α-pinene loss by port 1 (Table S1). This loss is confirmed by experimental measurements of α-pinene by GC-MS. The validity of the kinetics model is also verified by using the model-predicted concentrations of NO3 and N2O5 (Fig. S1) to predict how much organic nitrate should be formed and by comparing these concentrations to those measured using FTIR (Fig. S2).
The size distributions of SOA formed by the oxidation of α-pinene are shown in Fig. 1 (and Fig. S3) when NO2 is varied from 6.3 to 0 ppm at constant O3. At the highest NO2 concentration, few particles are formed, which is expected because multifunctional organic nitrates, formed in the NO3 reaction with α-pinene, have sufficiently high vapor pressures that they do not readily nucleate to form new particles (25–27). For example, the products 3-oxopinane-2-nitrate, 2-hydroxypinane-3-nitrate, and pinonaldehyde peroxyacetyl nitrate, which have been measured in the gas phase (27–30) with an average total yield of 16.5%, have vapor pressures between 4 × 10⁻⁶ and 1 × 10⁻⁷ atm at 295 K (26, 31). However, ozonolysis products typically have lower vapor pressures (e.g., ca. 1 × 10⁻⁷ and 6 × 10⁻¹⁰ atm for pinonic and pinic acids, respectively; ref. 31) and more readily undergo homogeneous nucleation to form new particles. As the NO2 concentration decreases and the contribution of O3 to the α-pinene loss increases, the particle number and mass concentration due to ozonolysis increase (Fig. 1 and Fig. S4) as expected.
Fig. 1.

Combined scanning mobility particle sizer (SMPS)–aerodynamic particle sizer size distributions of particles as a function of NO2 concentration from 6.3 to 0.2 ppm, with a constant 1.4 ppm concentration of O3. The gray trace is that for reaction with 1.6 ppm O3 alone. All traces correspond to the Weibull fit; Fig. S3 presents the experimental data and this fit. Measurements were made at port 5 of the flow tube (ca. 52 min reaction time between α-pinene and the NO2/O3/N2O5 mixture) except for the blue trace (NO2 = 1.1 ppm) where only SMPS data from port 1 were available (ca. 13 min reaction time between α-pinene and the NO2/O3/N2O5 mixture). However, when simultaneous measurements were made at port 1 and port 5 for the NO2 + O3 system, the measured distributions were similar.
Organic nitrate products from the NO3 chemistry comprise a fraction of the SOA. For example, Fig. 2 shows FTIR spectra from particles collected at the end of the flow tube as a function of initial NO2 concentration. In addition to the aliphatic -C–H stretches in the 2,800–3,000 cm-1 region, three infrared bands corresponding to the -ONO2 asymmetric stretch (1,630 cm-1), the -ONO2 symmetric stretch (1,280 cm-1), and RO–NO2 stretch (860 cm-1) characteristic of organic nitrates are seen (27, 29, 32–34). As described in the SI Text, these spectra show that the relative number of -ONO2 groups to -C–H groups, n(-ONO2)/n(-CH), increases with the NO2 concentration (Table S2).
Fig. 2.

FTIR spectra from particles collected on ZnSe discs (50% cut point at 0.5 μm for 9 L min-1 flow rate through the impactor; spectra for a 1.0-μm cutoff disc are similar) as a function of the NO2 concentration from 6.3 to 0.2 ppm (A–E) with an initial O3 concentration of 1.4 ppm. F is from the ozonolysis experiment using 1.6 ppm O3. Because no attempt was made to collect the same mass of SOA for each sample, it is the relative peak heights for the -ONO2 groups compared to the -C–H bands that indicate the trends in organic nitrate products with the initial NO2 concentration, rather than the absolute peak heights.
Similarly, mass spectra acquired using real-time high-resolution time-of-flight mass spectrometry (HR-TOF-AMS) and single particle mass spectrometry (SPLAT-II) show that the SOA contains organic nitrates (Fig. S5). The spectra when NO2 is present (Fig. S5 A–C and E–G ) are very similar to those for the ozonolysis reaction (Fig. S5 D and H), except that peaks at m/z 30 and 46 also appear, primarily from NO+ and  (SPLAT-II spectra show primarily m/z 30). The
 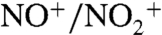 ratio from the high-resolution AMS mass spectra ranges from 4.9 to 7.6, consistent with a contribution from organic nitrate products (35–38) from the NO3 reaction with α-pinene (26, 27, 35).
The similarity of the spectra in the presence and absence of NO2 suggests that the overall bulk composition of the aerosol (excluding the organic nitrate component) remains relatively constant. For example, the O∶C ratios calculated from the AMS data (Fig. S6) average 0.34 ± 0.10 over the range of experimental conditions. This average value is similar to previous measurements of SOA from α-pinene ozonolysis (39–41) and with pinonic and pinic acid (with O∶C ratios of 0.3 and 0.4, respectively), which are known to be major products of the ozone reaction (42, 43). Although there may be a slight trend in the O∶C ratio with the NO2 concentration, it is not significant within uncertainty of the measurements.
Extracts of particles collected on quartz-fiber filters are analyzed by liquid chromatography with UV detection (LC-UV). Chromatograms (Fig. S7) show a group of overlapping peaks with UV spectra attributable to organic nitrates (44) in all NO2 experiments. The mass concentrations of total organic nitrates in the particles derived from the LC-UV data (Fi, μg per m3 of air) (see Eq. S5) are shown in Table 1 as a function of the initial NO2 concentration. Using the size distributions and the densities measured by SPLAT-II, the total mass concentration of particles and the mass fraction of organic nitrates (fAPONO2) are also calculated. Organic nitrates comprise between 0.1–8.2% of the total SOA mass and follow the trend in NO2. This trend is also shown in the HR-TOF-AMS and FTIR analysis (Table S2).
Table 1.
Total and particulate organic nitrate concentrations and total mass concentrations of SOA
| Initial [NO2]0, 1014 molecules cm-3or [ppm] | Mass concentration of total organic nitrates [APONO2],* μg per m3 of air | Mass concentration of aerosol organic nitrates Fi,† μg per m3 of air | Total mass concentration of SOA M,‡ μg per m3 of air | fAPONO2, % |
| NO3 experiments, with [O3]o = 1.4 ppm | ||||
| 1.6 [6.3] | 394 | 2.3 | 28 | 8.2 |
| 0.59 [2.4] | 319 | 7.6 | 392 | 1.9 |
| 0.42 [1.7] | 270 | 8.0 | 436 | 1.8 |
| 0.27 [1.1] | 195 | 5.0 | 907 | 0.6 |
| 0.05 [0.2] | 42 | 1.1 | 1,791 | 0.06 |
| O3 experiments, with [O3]o = 1.6 ppm | ||||
| 0.00 | 0 | 1,948 | 0 | |
Measured at a reaction time of 52 min corresponding to the fifth and last port of the flow tube (see SI Text).
*From the box model. The output of the model corrected for N2O5 wall loss, [APONO2], in molecules cm-3, is converted into a mass concentration using MWAPONO2 = 220 g mol-1 (26).
†From LC-UV data (see SI Text).
‡From scanning mobility particle sizer–aerodynamic particle sizer composite size distributions and densities measured by SPLAT-II (see SI Text).
In short, measurement of the SOA composition by three different techniques shows that the organic nitrate contribution to the SOA decreases as the NO2 concentration (and thus the available NO3 radicals to react with α-pinene) decreases. Simultaneously, the amount of SOA formed increases due to the increasing contribution of the O3 reaction. Fig. 3 summarizes qualitatively the chemistry occurring in this system: Although ozonolysis is primarily responsible for SOA formation, ozonolysis products (hereafter defined as “Prod1”) and organic nitrates (hereafter defined as “APONO2”) are both incorporated into the SOA, contributing to its growth.
Fig. 3.

Representation of SOA formation and growth based on the experimental observations. See text for details.
To probe the chemistry quantitatively, a simplified 96-step mechanism for the NO2 + O3 + α-pinene system is developed, and the rate equations are integrated using Acuchem (45). Two reaction channels are assumed for the NO3 reaction and two for the O3 reaction:
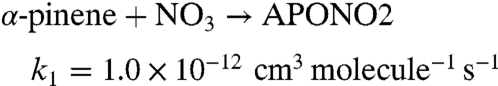 |
[1] |
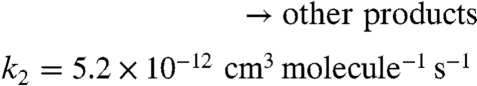 |
[2] |
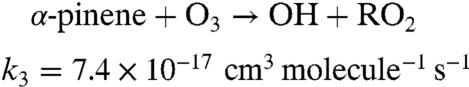 |
[3] |
 |
[4] |
The rate constants for these reactions are based on known rate constants for the overall reactions (24) and branching ratios for the formation of organic nitrates (APONO2) and OH radicals. Thus, the yield of organic nitrates in the NO3 reaction is taken to be 16.5% (46) and the OH yield in the ozone reaction is taken to be 82% (46). Prod1 is a marker for the O3 chemistry that represents, in part, low-volatility products that lead to particle formation and growth. The use of a first-generation product (Prod1) as a proxy for SOA is supported by the work of Ng et al. (47) who showed that the particles from α-pinene ozonolysis are due to first-generation low-volatility products. Fig. S2 compares the box model-predicted total (gas plus particle phase) concentrations of APONO2 as a function of the initial NO2 (gray dashed line) to the gas-phase organic nitrate concentrations measured using long-path FTIR (black circles). This comparison should be reasonable because most of the organic nitrates are in the gas phase (Table 1). As described in the SI Text, the model well represents the time evolution of the total concentration of organic nitrates as a function of the initial NO2 concentration.
Growth of SOA has often been described via adsorption of SVOCs, such as organic nitrates, onto the particle surface or absorption into the bulk. In most atmospheric models of SOA, the latter process (19, 20) is taken to be responsible for uptake of SVOCs into existing liquid particles. It is assumed that once a seed particle is formed (e.g., by homogeneous nucleation), SVOCs will partition into the bulk liquid phase of the particles, causing it to grow.
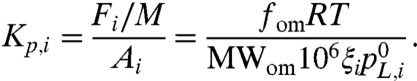
An equilibrium partitioning coefficient (Kp,i) for compound i is defined as the ratio of the concentrations of compound i in the gas and particle phases, assuming a reversible gas-particle partitioning based on Raoult’s law with activity corrections (19, 20):
 |
[5] |
In Eq. 5, Fi and Ai are the mass concentrations (μg per m3 of air) of compound i in the aerosol and gas phase, respectively, and M (μg per m3 of air) is the mass concentration of particulate material, so Kp,i has units of m3 per μg. On the right-hand side of Eq. 5, fom is the mass fraction of the presumably largely organic material portion of the particulate matter into which the partitioning is occurring (because of the absence of preexisting seed particles, fom is unity for our experiments), R is the ideal gas constant (m3 atm K-1 mol-1), T is the temperature (K), MWom (g mol-1) is the average molecular weight of the particulate matter phase into which the partitioning is occurring, ζi is the activity coefficient of compound i, and  is the vapor pressure of compound i (atm).
Values of Fi/M and Ai for the sum of all organic nitrates are calculated using Fi and M from Table 1, and the corrected gas-phase concentrations (Ai; see SI Text) from the box model with Ai = [APONO2] - Fi. Eq. 5 predicts that a plot of Fi/M versus Ai will be a straight line with slope Kp, which is seen in Fig. 4 (black circles) not to be the case for the NO2/O3/α-pinene system.
Fig. 4.

Dependence of Fi/M on Ai (see text for definitions) for organic nitrates in SOA from the oxidation of α-pinene by O3/NO2 for the flow tube experiments (black circles), and in the PEG seed particle experiments (gray triangles). (The total mass concentration of PEG particles is approximately 5,000 μg m-3).
There are four possible sources of this unexpected variation that are associated with the physical description of Kp (right-hand side of Eq. 5): (i) The activity coefficients (ζi) vary systematically as the NO2 concentration changes; (ii) the gas-phase box model does not predict accurately Ai as a function of NO2 concentration; (iii) the composition of the SOA into which the organic nitrates partition changes dramatically with NO2 concentration; or (iv) the conditions for which Eq. 5 is developed do not apply in this system. As shown in Fig. S5 and discussed in the SI Text, a systematic variation in the bulk SOA composition (excluding the organic nitrates) and hence in ζi is unlikely. With respect to (ii), experimental measurements of gas-phase organic nitrates show that the box model does predict accurately their trend with NO2 (Fig. S2). The third possibility is ruled out by the data presented in Figs. S5 and S6, which show that the SOA composition does not change significantly, except for the contribution of organic nitrates (see discussion above). This process of elimination leaves the fourth possibility—i.e., that the equilibrium described by Eq. 5 does not apply in this system.
To test that organic nitrates do partition into particles that are known to be liquid and where equilibrium should be rapidly achieved, uptake into liquid poly(ethylene glycol) (PEG) particles (see SI Text) is studied. Organic nitrates are generated in a separate set of experiments by reacting α-pinene with NO3, generated from the thermal decomposition of varying concentrations of N2O5. The mixture of products and remaining reactants are then exposed to PEG particles. After approximately 10 min, particles are collected and analyzed using the same technique as for the NO2/O3/α-pinene experiments. Fig. 4 (gray triangles) shows that Fi/M depends linearly on Ai, consistent with equilibrium partitioning into liquid particles as described by Eq. 5. This outcome is not surprising; for a liquid of the viscosity of the PEG (ca. 0.1 Pa·s), the diffusion coefficient is approximately 5 × 10⁻⁶ cm2 s-1 and the time to diffuse from the surface to the center of a 260-nm diameter particle (average geometric mean diameter of the PEG particle distributions) is only about 35 μs (21).
In short, although the organic nitrates partition in equilibrium fashion as expected into liquid PEG particles, the same is not the case for the incorporation of organic nitrates into the SOA formed in the ozonolysis of α-pinene, at least on the timescale (ca. 10–60 min) of the experiments.
An alternative hypothesis to equilibrium partitioning is that the particles grow and incorporate organic nitrates via a nonequilibrium, kinetically limited mechanism, similar to what has been described historically as a “condensation” mechanism (3, 4). Gas molecules impinge on the surface of an existing particle, with some probability that they will be taken up. This probability, and the time they remain adsorbed on the surface, are determined by the nature of the attractive forces operating between the gas and the surface of the particle. In addition, reactions at the surface that convert the adsorbate to lower volatility compounds (for example, oligomer formation) may contribute (48–51). If the residence time on the surface is sufficiently long, the adsorbed species can become “buried” and hence incorporated into the bulk by semivolatile gaseous compounds that subsequently condense. Based on gas kinetic theory, the time between collisions of a gas molecule with a molecular weight of 220 g mol-1 with an adsorbed surface molecule is about 100 ms, assuming a 10 ppb gas-phase SVOC concentration and surface area per molecule of 1 nm2. If a molecule at the surface has a longer residence time than 100 ms, the probability of it becoming buried by an incoming product molecule becomes significant. An estimate of reasonable residence times on the surface can be obtained from the rate constant for desorption (52), kdes = Ae-Ea/RT where EA ∼ ΔHsub (or ΔHvap, depending on the process). Heats of sublimation for acids and diacids are typically about 150 kJ mol-1 (53, 54) and heats of vaporization and sublimation for simple alcohols are typically in the range of 80–120 kJ mol-1 (55). Using A ∼ 1013 s-1, lifetimes on the surface will range from 10 to 1013 s, more than sufficient to be buried by incoming SVOCs.
To assess if this growth mechanism is consistent with the experimental data, the uptake of APONO2 and Prod1 are treated as irreversible and occurring with uptake probabilities of γAPONO2 and γProd1. A value of the relative uptake coefficients, γAPONO2/γProd1 = 0.016, is found to provide an excellent fit to the experimentally measured mass fraction of organic nitrates in the SOA (fAPONO2, Table 1) for all NO2 concentrations (Fig. S8). These results show that a nonequilibrium kinetically determined mechanism determines the formation and growth of SOA in this atmospherically important system.
A kinetics mechanism implies that reevaporation of the organic nitrates back to the gas phase is negligible, at least on the timescale of these experiments. Given the earlier discussion of diffusion times under typical liquid viscosities (21), the lack of reevaporation shows that the SOA material must be very viscous; once the organic nitrate is buried, it does not readily diffuse back to the particle surface and into the gas phase. The characteristic times for diffusion in a 400-nm diameter particle for a liquid are 10 μs to 10 ms for diffusion coefficients in the range of 10-5 to 10-9 cm2 s-1 (21). For the approximately 1 h residence time in our flow system, equilibrium should be reached if the diffusion coefficient was ≥10-14 cm2 s-1. The fact that our data show equilibrium is not reached is compatible with the SOA being solid or semisolid, where D < 10-14 cm2 s-1 (21). Clearly, the phase of a particle is important as it impacts the interaction of gas-phase products with the seed particles, and thus their growth rate, optical properties, and CCN activity (56).
Many studies have examined the timescales for the various steps associated with the formation and growth of SOA (21, 57–60); the conclusion is that the time for gas-phase SVOCs to come to equilibrium with liquid particles under typical atmospheric conditions is sufficiently short that the assumption of instantaneous equilibrium partitioning in atmospheric models is justified. However, a variety of recent results from other laboratories indicate that SOA in both ambient air and laboratory systems from reactions such as O3 with α-pinene does not always behave like a liquid. Vaden et al. (61) show that SOA mixed with a hydrophobic liquid organic forms layered particles with SOA at the core coated with the hydrophobic organic, or a hydrophobic core coated with SOA, both of which were stable for many hours. Vaden et al. (62) also demonstrate that evaporation of ambient SOA particles from Sacramento, California as well as laboratory-generated SOA, is quite slow, and the size dependence of the evaporation is not consistent with that expected for liquid particles. Earlier studies of the desorption of organics from particles collected in a highway tunnel showed that the diffusion coefficients were orders of magnitude smaller than expected for liquids (63). Virtanen et al. (64, 65) report that particles collected in Hyytiälä, Finland and those generated in the laboratory by ozonolysis of α-pinene, bounce off impactor plates as if they are solids. Pierce et al. (66) show that freshly nucleated particles from Hyytiälä, Finland and Egbert, ON, Canada have very low volatility. Cappa and Wilson (67) demonstrate that the composition of SOA from the ozonolysis of α-pinene does not change with heating as expected if the evaporation is determined by equilibrium partitioning between a liquid particle and the gas phase. Thermodenuder measurements from field studies (11, 68) and laboratory-generated SOA from ozonolysis of monoterpenes (69, 70) show that thermal evaporation of the SOA (specifically at low RH) is much smaller than predicted by models of liquid particles, indicating that a significant fraction of the SOA is essentially nonvolatile.
Laboratory studies of the interaction of water vapor with some species relevant to atmospheric particles have also suggested that atmospheric particles may form highly viscous amorphous material under the appropriate conditions (71–73). More recently, Koop et al. (74) have shown that pinic acid and pinonic acid, which are major products of the α-pinene ozonolysis (42, 43), have glass transition temperatures between 265 and 268 K and thus can form a “glass” at lower temperatures found under some conditions in the troposphere; even above the glass transition temperature, the viscosity may be quite high.
In short, the results from our studies suggest that the assumption of instantaneous equilibrium commonly applied to SOA formation and evolution in most atmospheric models may need to be revisited. A kinetically limited/condensation growth mechanism actually can provide a better fit to field data. For example, measurements of the evolution of the number concentrations and size distributions of aerosols in the Mexico City area are shown to be consistent with a condensation mechanism for particle growth (75). Similarly, the growth of ultrafine aerosols from Egbert, ON, Canada and Hyytiälä, Finland are best modeled if > 50% of the ultrafine particle growth was because of condensation (76). Very recent modeling efforts (77–79) also suggest the importance of this growth mechanism. As discussed in detail in the SI Text, the SOA measured in Riverside, California is consistent with a kinetically limited growth mechanism with no reevaporation if the overall average uptake coefficient for the SVOCs that lead to particle growth is of the order of 0.5–0.6.
The issue of thermodynamic equilibrium has also been discussed in detail with respect to modeling inorganic atmospheric aerosols. The first generation of aerosol models assumed thermodynamic equilibrium for the volatile compounds between the gas and aerosol phase (80–83). However, measurements by Tanner (84), Allen et al. (85), and Wexler and Seinfeld (86) showed that equilibrium is not always achieved, especially within the time step used by models. Consequently, gas-to-particle conversion for inorganic species is now generally represented in aerosol modules by a dynamic mass transfer between the gas and aerosol phases (e.g., Meng et al., ref. 87).
In short, the combination of experiments reported here suggests that uptake of SVOCs into ambient SOA is consistent with a kinetically limited/condensation growth mechanism. Adsorbed SVOCs become incorporated into the bulk by being buried by incoming gas molecules and do not reevaporate, at least on the timescale of the experiments. If this process proves to be a general phenomenon, then the current formation and growth of SOA is not appropriately represented in most atmospheric models that rely on instantaneous thermodynamic equilibrium of SVOCs into liquid particles. Thus, current treatments of SOA formation and growth in models for both indoor and outdoor environments and the predicted impacts based on these models may need to be revisited.
Materials and Methods
A brief description of the experimental procedure is provided below and details can be found in the SI Text. α-Pinene was reacted with mixtures of O3 and NO2 in an aerosol flow tube (23). The size distributions, densities, and composition of the particles formed were measured using a scanning mobility particle sizer, an aerodynamic particle sizer, two particle mass spectrometers (SPLAT-II-MS and HR-TOF-AMS), LC-UV, and FTIR. Gas-phase concentrations were measured using a chemiluminescence NOx analyzer, a photometric O3 analyzer, GC-MS, and long-path FTIR. For comparison, experiments were performed in Teflon reaction chambers using liquid PEG seed particles and the use of N2O5 as the source of NO3 radicals.
Supplementary Material
Acknowledgments.
E.A.B. thanks the National Science Foundation for a Graduate Research Fellowship. We are also grateful to Paul Ziemann for discussions regarding organic nitrate analysis, and Sergey Nizkorodov, James N. Pitts, Jr., Margaret Tolbert, and Paul Shepson for comments on the manuscript. This work was funded by the US Department of Energy (DOE) (Grant DE-FG02-05ER64000) and the National Science Foundation (Grant CHE-0909227). This research was in part in collaboration with the Environmental Molecular Sciences Laboratory, a national scientific user facility sponsored by the US DOE’s Office of Biological and Environmental Research at Pacific Northwest National Laboratory (PNNL) and supported by the US DOE’s Office of Basic Energy Sciences, Chemical Sciences Division. PNNL is operated by Battelle Memorial Institute under Contract DE-AC06-76RL0 1830.
Footnotes
The authors declare no conflict of interest.
This article contains supporting information online at www.pnas.org/lookup/suppl/doi:10.1073/pnas.1119909109/-/DCSupplemental.
References
- 1.Pope CA, et al. Lung cancer, cardiopulmonary mortality, and long-term exposure to fine particulate air pollution. J Am Med Assoc. 2002;287:1132–1141. doi: 10.1001/jama.287.9.1132. [DOI] [PMC free article] [PubMed] [Google Scholar]
- 2.Hinds WC. Aerosols Technology: Properties, Behavior and Measurement of Airborne Particles. New York: Wiley Interscience; 1999. pp. 364–370. [Google Scholar]
- 3.Finlayson-Pitts BJ, Pitts JN., Jr . Chemistry of the Upper and Lower Atmosphere—Theory, Experiments, and Applications. San Diego: Academic; 2000. pp. 349–435.pp. 788–814. [Google Scholar]
- 4.Seinfeld JH, Pandis SN. Atmospheric Chemistry and Physics: From Air Pollution to Climate Change. New York: Wiley Interscience; 1998. pp. 700–751.pp. 1113–1184. [Google Scholar]
- 5.Intergovernmental Panel on Climate Chang. IPCC, Climate Change 2007—The Physical Science Basis: Contribution of Working Group I to the Fourth Assessment Report of the IPPC; Cambridge, UK: Cambridge Univ Press; 2007. [Google Scholar]
- 6.Volkamer R, et al. Secondary organic aerosol formation from anthropogenic air pollution: Rapid and higher than expected. Geophys Res Lett. 2006;33:L17811. [Google Scholar]
- 7.Hodzic A, et al. Modeling organic aerosols during MILAGRO: Importance of biogenic secondary organic aerosols. Atmos Chem Phys. 2009;9:6949–6982. [Google Scholar]
- 8.O’Donnell D, Tsigaridis K, Feichter J. Estimating the direct and indirect effects of secondary organic aerosols using ECHAM5-HAM. Atmos Chem Phys. 2011;11:8635–8659. [Google Scholar]
- 9.Heald CL, et al. A large organic aerosol source in the free troposphere missing from current models. Geophys Res Lett. 2005;32:L18809. [Google Scholar]
- 10.Carlton AG, et al. Model representation of secondary organic aerosol in CMAQv4. Environ Sci Technol. 2010;44:8553–8560. doi: 10.1021/es100636q. [DOI] [PubMed] [Google Scholar]
- 11.Dzepina K, et al. Evaluation of recently-proposed secondary organic aerosol models for a case study in Mexico City. Atmos Chem Phys. 2009;9:5681–5709. [Google Scholar]
- 12.Foley KM, et al. Incremental testing of the Community Multiscale Air Quality (CMAQ) modeling system version 4. Geosci Model Dev. 2010;3:205–226. doi: 10.5194/gmd-10-1703-2017. [DOI] [PMC free article] [PubMed] [Google Scholar]
- 13.Hodzic A, et al. Modeling organic aerosols in a megacity: Potential contribution of semi-volatile and intermediate volatility primary organic compounds to secondary organic aerosol formation. Atmos Chem Phys. 2010;10:5491–5514. [Google Scholar]
- 14.Robinson AL, et al. Rethinking organic aerosols: Semivolatile emissions and photochemical aging. Science. 2007;315:1259–1262. doi: 10.1126/science.1133061. [DOI] [PubMed] [Google Scholar]
- 15.Yu S, Bhave PV, Dennis RL, Mathur R. Seasonal and regional variations of primary and secondary organic aerosols over the continental United States: Semi-empirical estimates and model evaluation. Environ Sci Technol. 2007;41:4690–4697. doi: 10.1021/es061535g. [DOI] [PubMed] [Google Scholar]
- 16.Fast J, et al. Evaluating simulated primary anthropogenic and biomass burning organic aerosols during MILAGRO: Implications for assessing treatments of secondary organic aerosols. Atmos Chem Phys. 2009;9:6191–6215. [Google Scholar]
- 17.Shrivastava M, et al. Modeling organic aerosols in a megacity: Comparison of simple and complex representations of the volatility basis set approach. Atmos Chem Phys. 2011;11:6639–6662. [Google Scholar]
- 18.Heald CL, et al. Exploring the vertical profile of atmospheric organic aerosol: Comparing 17 aircraft field campaigns with a global model. Atmos Chem Phys. 2011;11:12673–12696. [Google Scholar]
- 19.Pankow JF. An absorption-model of gas-particle partitioning of organic-compounds in the atmosphere. Atmos Environ. 1994;28:185–188. [Google Scholar]
- 20.Pankow JF. An absorption-model of the gas aerosol partitioning involved in the formation of secondary organic aerosol. Atmos Environ. 1994;28:189–193. [Google Scholar]
- 21.Shiraiwa M, Ammann M, Koop T, Poschl U. Gas uptake and chemical aging of semisolid organic aerosol particles. Proc Natl Acad Sci USA. 2011;108:11003–11008. doi: 10.1073/pnas.1103045108. [DOI] [PMC free article] [PubMed] [Google Scholar]
- 22.Lane TE, Donahue NM, Pandis SN. Simulating secondary organic aerosol formation using the volatility basis-set approach in a chemical transport model. Atmos Environ. 2008;42:7439–7451. [Google Scholar]
- 23.Ezell MJ, et al. A new aerosol flow system for photochemical and thermal studies of tropospheric aerosols. Aerosol Sci Technol. 2010;44:329–338. [Google Scholar]
- 24.Atkinson R, et al. Evaluated kinetic and photochemical data for atmospheric chemistry: Volume II—gas phase reactions of organic species. Atmos Chem Phys. 2006;6:3625–4055. [Google Scholar]
- 25.Bonn B, Moortgat GK. New particle formation during α- and β-pinene oxidation by O3, OH and NO3, and the influence of water vapour: Particle size distribution studies. Atmos Chem Phys. 2002;2:183–196. [Google Scholar]
- 26.Perraud V, et al. Identification of organic nitrates in the NO3 radical initiated oxidation of α-pinene by atmospheric pressure chemical ionization mass spectrometry. Environ Sci Technol. 2010;44:5887–5893. doi: 10.1021/es1005658. [DOI] [PubMed] [Google Scholar]
- 27.Wangberg I, Barnes I, Becker KH. Product and mechanistic study of the reaction of NO3 radicals with α-pinene. Environ Sci Technol. 1997;31:2130–2135. [Google Scholar]
- 28.Berndt T, Böge O. Products and mechanism of the gas-phase reaction of NO3 radicals with α-pinene. J Chem Soc Faraday Trans. 1997;93:3021–3027. [Google Scholar]
- 29.Hallquist M, Wangberg I, Ljungstrom E, Barnes I, Becker KH. Aerosol and product yields from NO3 radical-initiated oxidation of selected monoterpenes. Environ Sci Technol. 1999;33:553–559. [Google Scholar]
- 30.Spittler M, et al. Reactions of NO3 radicals with limonene and α-pinene: Product and SOA formation. Atmos Environ. 2006;40:S116–S127. [Google Scholar]
- 31.Pankow JF, Asher WE. SIMPOL.1: A simple group contribution method for predicting vapor pressures and enthalpies of vaporization of multifunctional organic compounds. Atmos Chem Phys. 2008;8:2773–2796. [Google Scholar]
- 32.Barnes I, Bastian V, Becker KH, Tong Z. Kinetics and products of the reactions of NO3 with monoalkenes, dialkenes, and monoterpenes. J Phys Chem. 1990;94:2413–2419. [Google Scholar]
- 33.Socrates G. Infrared and Raman Characteristic Group Frequencies—Tables and Charts. 3rd Ed. New York: Wiley; 2001. [Google Scholar]
- 34.Garnes LA, Allen DT. Size distributions of organonitrates in ambient aerosol collected in Houston, Texas. Aerosol Sci Technol. 2002;36:983–992. [Google Scholar]
- 35.Bruns EA, et al. Comparison of FTIR and particle mass spectrometry for the measurement of particulate organic nitrates. Environ Sci Technol. 2010;44:1056–1061. doi: 10.1021/es9029864. [DOI] [PubMed] [Google Scholar]
- 36.Farmer DK, et al. Response of the aerosol mass spectrometer to organonitrates and organosulfates and implications for atmospheric chemistry. Proc Natl Acad Sci USA. 2010;107:6670–6675. doi: 10.1073/pnas.0912340107. [DOI] [PMC free article] [PubMed] [Google Scholar]
- 37.Fry JL, et al. Organic nitrate and secondary organic aerosol yield from NO3 oxidation of β-pinene evaluated using a gas-phase kinetics/aerosol partitioning model. Atmos Chem Phys. 2009;9:1431–1449. [Google Scholar]
- 38.Rollins AW, et al. Elemental analysis of aerosol organic nitrates with electron ionization high-resolution mass spectrometry. Atmos Meas Tech. 2010;3:301–310. [Google Scholar]
- 39.Chhabra PS, Flagan RC, Seinfeld JH. Elemental analysis of chamber organic aerosol using an Aerodyne high-resolution aerosol mass spectrometer. Atmos Chem Phys. 2010;10:4111–4131. [Google Scholar]
- 40.Shilling JE, et al. Loading-dependent elemental composition of α-pinene SOA particles. Atmos Chem Phys. 2009;9:771–782. [Google Scholar]
- 41.Tolocka MP, et al. Chemistry of particle inception and growth during α-pinene ozonolysis. Environ Sci Technol. 2006;40:1843–1848. doi: 10.1021/es051926f. [DOI] [PubMed] [Google Scholar]
- 42.Jang M, Kamens RM. Newly characterized products and composition of secondary aerosols from the reaction of α-pinene with ozone. Atmos Environ. 1999;33:459–474. [Google Scholar]
- 43.Yu JZ, Cocker DR, Griffin RJ, Flagan RC, Seinfeld JH. Gas-phase ozone oxidation of monoterpenes: Gaseous and particulate products. J Atmos Chem. 1999;34:207–258. [Google Scholar]
- 44.Matsunaga A, Ziemann PJ. Yields of β-hydroxynitrates and dihydroxynitrates in aerosol formed from OH radical-initiated reactions of linear alkenes in the presence of NOx. J Phys Chem A. 2009;113:599–606. doi: 10.1021/jp807764d. [DOI] [PubMed] [Google Scholar]
- 45.Braun W, Herron JT, Kahaner DK. ACUCHEM: A computer program for modeling complex chemical reaction systems. Int J Chem Kinet. 1988;20:51–62. [Google Scholar]
- 46.Atkinson R, Arey J. Gas-phase tropospheric chemistry of biogenic volatile organic compounds: A review. Atmos Environ. 2003;37:S197–S219. [Google Scholar]
- 47.Ng NL, et al. Contribution of first- versus second-generation products to secondary organic aerosols formed in the oxidation of biogenic hydrocarbons. Environ Sci Technol. 2006;40:2283–2297. doi: 10.1021/es052269u. [DOI] [PubMed] [Google Scholar]
- 48.Chan AWH, Kroll JH, Ng NL, Seinfeld JH. Kinetic modeling of secondary organic aerosol formation: Effects of particle- and gas-phase reactions of semivolatile products. Atmos Chem Phys. 2007;7:4135–4147. [Google Scholar]
- 49.Hall WA, Johnston MV. Oligomer content of α-pinene secondary organic aerosol. Aerosol Sci Technol. 2011;45:37–45. [Google Scholar]
- 50.Tolocka MP, et al. Formation of oligomers in secondary organic aerosol. Environ Sci Technol. 2004;38:1428–1434. doi: 10.1021/es035030r. [DOI] [PubMed] [Google Scholar]
- 51.Ceulemans K, Compernolle S, Peeters J, Muller JF. Evaluation of a detailed model of secondary organic aerosol formation from α-pinene against dark ozonolysis experiments. Atmos Environ. 2010;44:5434–5442. [Google Scholar]
- 52.Adamson AW, Gast AP. Physical Chemistry of Surfaces. 6th Ed. New York: Wiley; 1997. p. 696. [Google Scholar]
- 53.Chattopadhyay S, Ziemann PJ. Vapor pressures of substituted and unsubstituted monocarboxylic and dicarboxylic acids measured using an improved thermal desorption particle beam mass spectrometry method. Aerosol Sci Technol. 2005;39:1085–1100. [Google Scholar]
- 54.Yatavelli RLN, Thornton JA. Particulate organic matter detection using a micro-orifice volatilization impactor coupled to a chemical ionization mass spectrometer (MOVI-CIMS) Aerosol Sci Technol. 2010;44:61–74. [Google Scholar]
- 55.Linstrom PJ, Mallard WG, editors. NIST Chemistry WebBook, NIST Standard Reference Database Number 69. Gaithersburg MD: National Institute of Standards and Technology; 2011. http://webbook.nist.gov. [Google Scholar]
- 56.Ziemann PJ. Atmospheric chemistry: Phase matters for aerosols. Nature. 2010;467:797–798. doi: 10.1038/467797a. [DOI] [PubMed] [Google Scholar]
- 57.Bowman FM, Odum JR, Seinfeld JH. Mathematical model for gas-particle partitioning of secondary organic aerosols. Atmos Environ. 1997;31:3921–3931. [Google Scholar]
- 58.Kamens R, Jang M, Chien CJ, Leach K. Aerosol formation from the reaction of α-pinene and ozone using a gas-phase kinetics aerosol partitioning model. Environ Sci Technol. 1999;33:1430–1438. [Google Scholar]
- 59.Odum JR, Jianzhen Y, Kamens RM. Modeling the mass transfer of semivolatile organics in combustion aerosols. Environ Sci Technol. 1994;28:2278–2285. doi: 10.1021/es00062a011. [DOI] [PubMed] [Google Scholar]
- 60.Rounds SA, Pankow JF. Application of a radial diffusion model to describe gas/particle sorption kinetics. Environ Sci Technol. 1990;24:1378–1386. [Google Scholar]
- 61.Vaden TD, Song C, Zaveri RA, Imre D, Zelenyuk A. Morphology of mixed primary and secondary organic particles and the adsorption of spectator organic gases during aerosol formation. Proc Natl Acad Sci USA. 2010;107:6658–6663. doi: 10.1073/pnas.0911206107. [DOI] [PMC free article] [PubMed] [Google Scholar]
- 62.Vaden TD, Imre D, Beranek J, Shrivastava M, Zelenyuk A. Evaporation kinetics and phase of laboratory and ambient secondary organic aerosol. Proc Natl Acad Sci USA. 2011;108:2190–2195. doi: 10.1073/pnas.1013391108. [DOI] [PMC free article] [PubMed] [Google Scholar]
- 63.Rounds SA, Tiffany BA, Pankow JF. Description of gas particle sorption kinetics with an intraparticle diffusion-model—desorption experiments. Environ Sci Technol. 1993;27:366–377. [Google Scholar]
- 64.Virtanen A, et al. An amorphous solid state of biogenic secondary organic aerosol particles. Nature. 2010;467:824–827. doi: 10.1038/nature09455. [DOI] [PubMed] [Google Scholar]
- 65.Virtanen A, et al. Bounce behavior of freshly nucleated biogenic secondary organic aerosol particles. Atmos Chem Phys. 2011;11:8759–8766. [Google Scholar]
- 66.Pierce JR, et al. Quantification of the volatility of secondary organic compounds in ultrafine particles during nucleation events. Atmos Chem Phys. 2011;11:9019–9036. [Google Scholar]
- 67.Cappa C, Wilson KR. Evolution of organic aerosol mass spectra upon heating: Implications for OA phase and partitioning behavior. Atmos Chem Phys. 2011;11:1895–1911. [Google Scholar]
- 68.Cappa CD, Jimenez JL. Quantitative estimates of the volatility of ambient organic aerosol. Atmos Chem Phys. 2010;10:5409–5424. [Google Scholar]
- 69.Lee BH, Pierce JR, Engelhart GJ, Pandis SN. Volatility of secondary organic aerosol from the ozonolysis of monoterpenes. Atmos Environ. 2011;45:2443–2452. [Google Scholar]
- 70.Stanier CO, Pathak RK, Pandis SN. Measurements of the volatility of aerosols from α-pinene ozonolysis. Environ Sci Technol. 2007;41:2756–2763. doi: 10.1021/es0519280. [DOI] [PubMed] [Google Scholar]
- 71.Zobrist B, Marcolli C, Pedernera DA, Koop T. Do atmospheric aerosols form glasses? Atmos Chem Phys. 2008;8:5221–5244. [Google Scholar]
- 72.Mikhailov E, Vlasenko S, Martin ST, Koop T, Poschl U. Amorphous and crystalline aerosol particles interacting with water vapor: Conceptual framework and experimental evidence for restructuring, phase transitions and kinetic limitations. Atmos Chem Phys. 2009;9:9491–9522. [Google Scholar]
- 73.Tong H-J, Reid JP, Bones DL, Luo BP, Krieger UK. Measurements of the timescales for the mass transfer of water in glassy aerosol at low relative humidity and ambient temperature. Atmos Chem Phys. 2011;11:4739–4754. [Google Scholar]
- 74.Koop T, Bookhold J, Shiraiwa M, Poschl U. Glass transition and phase state of organic compounds: Dependency on molecular properties and implications for secondary organic aerosols in the atmosphere. Phys Chem Chem Phys. 2011;13:19238–19255. doi: 10.1039/c1cp22617g. [DOI] [PubMed] [Google Scholar]
- 75.Kleinman LI, et al. The time evolution of aerosol size distribution over the Mexico City plateau. Atmos Chem Phys. 2009;9:4261–4278. [Google Scholar]
- 76.Riipinen I, et al. Organic condensation: A vital link connecting aerosol formation to cloud condensation nuclei (CCN) concentrations. Atmos Chem Phys. 2011;11:3865–3878. [Google Scholar]
- 77.Yu F. A secondary organic aerosol formation model considering successive oxidation aging and kinetic condensation of organic compounds: Global scale implications. Atmos Chem Phys. 2011;11:1083–1099. [Google Scholar]
- 78.Nieminen T, Lehtinen KEJ, Kulmala M. Sub-10 nm particle growth by vapor condensation—Effects of vapor molecule size and particle thermal speed. Atmos Chem Phys. 2010;10:9773–9779. [Google Scholar]
- 79.Donahue NM, Trump ER, Pierce JR, Riipinen I. Theoretical constraints on pure vapor-pressure driven condensation of organics to ultrafine particles. Geophys Res Lett. 2011;38:L16801. [Google Scholar]
- 80.Bassett ME, Cassmassi JC, Durkee KR, Hogo H. El Monte, CA: South Coast Air Management District; 1991. Final air quality and management plan, 1991. Episodic PM-10 model development and application for the South Coast Air Basin. Final Technical Report V-E South Coast Air Quality Management District. [Google Scholar]
- 81.Pilinis C, Seinfeld JH. Development and evaluation of an eulerian photochemical gas aerosol model. Atmos Environ. 1988;22:1985–2001. [Google Scholar]
- 82.Russell LM, Cass GR. Verification of a mathematical model for aerosol nitrate and nitric acid formation, and its use for control measure evaluation. Atmos Environ. 1986;20:2011–2025. [Google Scholar]
- 83.Hogo H, Seignur C, Yocke MA. El Monte, CA: South Coast Air Management District; 1985. Draft SCAQMD STAR project working paper No.1: Technical description of a photochemical air quality model with extension to calculate aerosol dynamics and visibility. [Google Scholar]
-
84.Tanner RL. An ambient experimental study of phase-equilibrium in the atmospheric system: Aerosol H+,
 ,
, ,
,  , HNO3(g) Atmos Environ. 1982;16:2935–2942. [Google Scholar]
 - 85.Allen AG, Harrison RM, Erisman JW. Field-measurements of the dissociation of ammonium-nitrate and ammonium-chloride aerosols. Atmos Environ. 1989;23:1591–1599. [Google Scholar]
- 86.Wexler AS, Seinfeld JH. The distribution of ammonium-salts among a size and composition dispersed aerosol. Atmos Environ. 1990;24:1231–1246. [Google Scholar]
- 87.Meng ZY, Dabdub D, Seinfeld JH. Size-resolved and chemically resolved model of atmospheric aerosol dynamics. J Geophys Res. 1998;103:3419–3435. [Google Scholar]
Associated Data
This section collects any data citations, data availability statements, or supplementary materials included in this article.