

Abstract
Galectins have a highly conserved carbohydrate-binding domain to which a variety of galactose-containing saccharides, both β- and α-galactosides, can interact with varying degrees of affinity. Recently, we demonstrated that the relatively large α(1 → 6)-d-galacto-β(1 → 4)-d-mannan (Davanat) binds galectin-1 (gal-1) primarily at an alternative carbohydrate-binding domain. Here, we used a series of α-galactomannans (GMs) that vary in their mannose-to-galactose ratios for insight into an optimal structural signature for GM binding to gal-1. Heteronuclear single-quantum coherence nuclear magnetic resonance spectroscopy with 15N-labeled gal-1 and statistical modeling suggest that the optimal signature consists of α-d-galactopyranosyl doublets surrounded by regions of about four or more “naked” mannose residues. These relatively large and complex GMs all appear to interact with varying degrees at essentially the same binding surface on gal-1 that includes the Davanat alternative binding site and elements of the canonical β-galactoside-binding region. The use of two small, well-defined GMs [61-α(1 → 6)-d-galactosyl-β-d-mannotriaose and 63,64-di-α(1 → 6)-d-galactosyl-β-d-mannopentaose] helped characterize how GMs, in general, interact in part with the canonical site. Overall, our findings contribute to better understanding interactions of gal-1 with larger, complex polysaccharides and to the development of GM-based therapeutics for clinical use.
Keywords: galactose, glycan, lectin, NMR, protein
Introduction
Galectins, which are generally known to bind to β-galactosides at a canonical site in the carbohydrate recognition domain (Barondes et al. 1994), exhibit various extracellular activities to mediate cell–cell and cell–matrix adhesion and migration by interacting with various glycan groups of cell surface glycoconjugates (Liu and Rabinovich 2005). Galectin-1 (gal-1), for example, interacts with various glycoconjugates of the extracellular matrix (e.g. laminin, fibronectin, β1 subunit of integrins, ganglioside GM1 and lysosomal membrane-associated proteins lamp 1 and 2), as well as those on endothelial cells (Neri and Bicknell 2005; e.g. integrins αvβ3 and αvβ5, ROBO4, CD36 and CD13) and on T lymphocytes (e.g. CD7, CD43 and CD45) where it is known to induce apoptosis (Perillo et al. 1995, 1997). Their binding to cell surface glycoproteins can also trigger intracellular activity, e.g. elements of the Ras-MEK-ERK pathway (Fischer et al. 2005).
The β(1 → 4)-galactoside lactose (Gal-β(1 → 4)-Glc) is one of the simplest carbohydrates with which galectins interact in vitro (Barondes et al. 1994), and structural knowledge of saccharide–galectin interactions has generally been limited to studies with such simple saccharides (Nesmelova, Dings, et al. 2008). However, glycans in situ are larger, heterogeneous in size and composition and densely packed, and it is likely that gal-1 in vivo interacts to some extent with various other saccharide units. Although β-d-galactose units comprise 23% of all terminal monosaccharides in mammalian cell surface glycans, α-d-galactose and d-mannose (in various anomeric states) comprise ∼2.3 and 18.9% of them, respectively (Werz et al. 2007). We recently reported that an α-galactomannan (GM), Davanat, derived from Cyamopsis tetragonoloba (guar gum) indeed interacts with gal-1 and over a relatively large surface area that is located primarily on that face of the protein opposite to its canonical lactose-binding site (Miller, Klyosov, Mayo, et al. 2009).
Davanat is currently being used against metastatic colorectal cancer in phase II clinical trials (http://clinicaltrials.gov/ct2/show/NCT00110721) and has been proposed as an antagonist of gal-1 which is known to play a crucial role in the adhesion and migration of highly proliferative endothelial cells in tumors (Rabinovich 2005; Thijssen et al. 2006). The observation that gal-1 apparently is not involved in normal bodily processes, like wound healing (Cao et al. 2002), suggests that the increased expression of gal-1 found in tumors (Thijssen et al. 2006) renders the protein an excellent target for therapeutic purposes. A better understanding of the structural features of GMs, like Davanat, that promote interactions with galectins would be quite useful to the development of other GM-based anticancer agents.
GMs are commonly described by their chemical name 1,4-β-d-galactomannan, or more specifically as (1 → 6)-α-d-galacto-(1 → 4)-β-d-mannan. In general, they are composed of a linear (1 → 4)-β-d-mannopyranosyl polymeric backbone to which single α-d-galactopyranosyl residues are attached in a more or less random fashion. From the literature, however, it remains unclear whether the distribution of galactose residues along the mannopyranose chain is, for example, random or “block-wise”. Nevertheless, the present study strongly suggests that the pattern of binding of GMs to gal-1 is relatively well described by a random distribution of galactose residues in all of the GMs studied. GMs from various plant sources are reported to have a ratio of Man/Gal between, for example, 1.1 (in Galega orientalis and Medicago falcata, goat's rue and yellow lucerne, respectively) and 4.0 (in Ceratonia siliqua, locust bean) or even 5.0–5.5 (Styphnolobium japonicum, Japanese pagoda tree, the tree legumes) [Mestechkina and Shcherbukhin 1991, and references therein; Shcherbukhin 1992; Daas et al. 2000; Ilyina et al. 2006]. Davanat has a Man/Gal ratio of 1.7. The chemical structures of GMs of the plant origin have been studied in detail, particularly using 1H and 13C nuclear magnetic resonance (NMR) spectroscopy (Platt et al. 2006). Unlike GMs of the microbial origin, those of the plant origin are composed only of α-d-galactopyranosyl and β-d-mannopyranosyl residues with a relatively well-defined structure of (1 → 6)-α-d-galacto-(1 → 4)-β-d-mannan.
In the present study, we used NMR spectroscopy to investigate binding of gal-1 to a series of GMs having a range of Man/Gal ratios from 1.1 to 4, with the goal of defining an optimal structural signature that may better promote interactions of a GM with gal-1 and perhaps with other galectins. Results indicate that gal-1 binds GMs preferentially at α-d-galactopyranosyl doublets that are surrounded by regions of “naked” Man residues. This work expands our view of how galectins, in general, interact with more complex glycans and aids in the development of GMs as potential anti-inflammatory and anticancer therapeutic agents for use in the clinic.
Results
Binding of gal-1 to GMs
Using a fixed concentration (1 mg/mL) of uniformly 15N-enriched gal-1 (15N-gal-1), we acquired 1H–15N heteronuclear single-quantum coherence (HSQC) spectra as a function of concentration of each of the eight GMs listed under Methods and materials, as well as two polymannan controls [one α-mannan from yeast and one β(1 → 4)-mannan from the ivory nut plant]. Because these GMs have different Man/Gal ratios, i.e. 1.1, 1.7, 1.8, 2, 2.2, 2.4, 3 and 4, we refer to them by this ratio for ease of discussion. HSQC spectra are exemplified for 15N-gal-1 in the absence (cross-peaks in black) and the presence (cross-peaks in red) of GM 2 (Figure 1A), GM 4 (Figure 1B) and the β(1 → 4)-mannan (no galactose, Figure 1C). 15N-gal-1 cross-peaks are labeled in Figure 1A, as assigned previously (Nesmelova, Pang, et al. 2008). For a more complete comparison of effects on gal-1 from all glycans investigated, Supplementary material, Figure S1 plots the same HSQC spectral region for each of the 10 GMs and mannans at the same concentration (mg/mL). Upon the addition of each GM (or mannan) to solution, gal-1 resonances are differentially decreased in intensity (broadened), as exemplified with HSQC spectral expansions of 15N-gal-1 in the presence of these GMs. At the contour level shown, some cross-peaks have apparently disappeared completely, some are partially reduced in intensity and others are essentially unchanged. We conclude from these data that gal-1 interacts with all of these GMs, albeit to varying degrees, and minimally with either mannan. In regards the mannans, this is interesting because while the β-mannan is linear with β(1 → 4)-linked mannose residues (as in all these GMs), this α-mannan is thought to be highly branched and likely composed of an α(1 → 6)-mannan backbone and variously linked α(1 → 2) and α(1 → 3) mannose residues. Nevertheless, both mannans interact to essentially the same degree, albeit minimally, with gal-1.
Fig. 1.
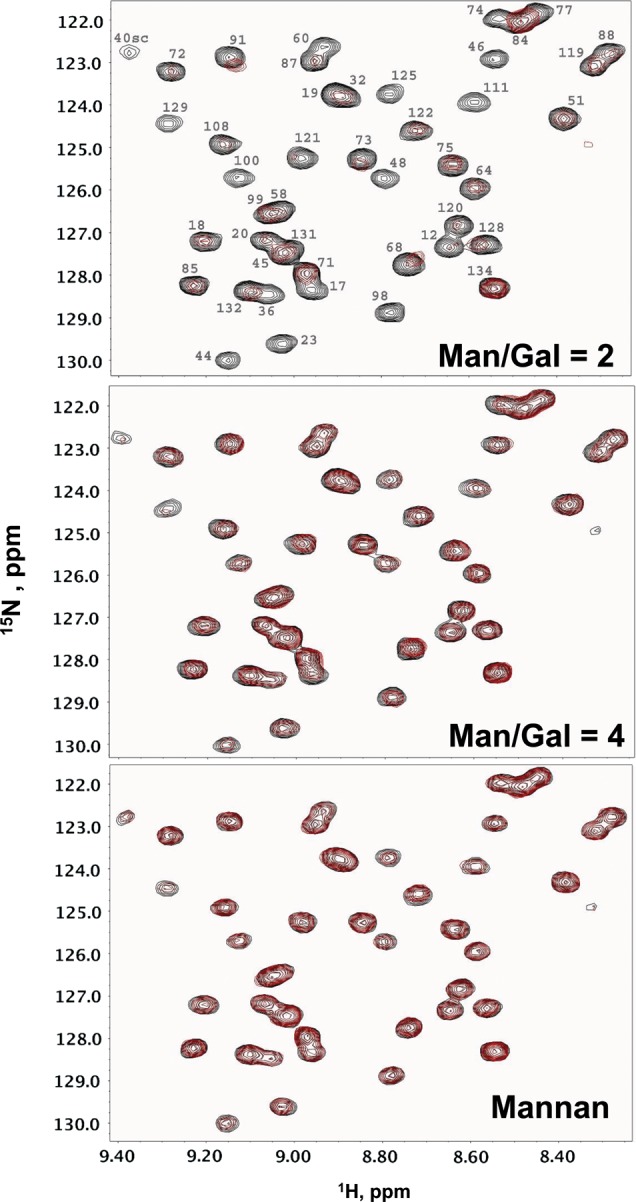
1H–15N HSQC spectral expansions are shown for 15N-gal-1 (1 mg/mL) alone (cross peaks in black in A–C) and in the presence of 3 mg/mL of GM 2 (A), GM 4 (B) and β(1 → 4)-mannan (C). Resonances are labeled in (A) with assignments reported previously by Nesmelova, Pang, et al. (2008).
In all cases, the differential change in gal-1 resonance intensity is primarily due to exchange between/among gal-1 and binding sites on these GMs that occurs on the intermediate chemical shift time-scale (Keeler 2005). HSQC data also indicate that the overall folded structure of gal-1 is not significantly perturbed by GM or mannan binding, because chemical shifts of resonances remaining during the titration are mostly unchanged. Because GM-gal-1-binding events fall in the intermediate exchange regime, Figure 2 shows examples of two HSQC resonance broadening maps (Miller, Klyosov, Mayo, et al. 2009) for GM 1.8 and GM 2. Here, we show differential broadening at a molar ratio of each of these GMs where most resonances are still observed, but are at lower intensities due to apparent broadening. The interpretation of HSQC broadening maps is essentially the same as with HSQC chemical shift mapping (Rajagopal et al. 1997), i.e. those resonances that are broadened the most are associated with that site(s) of glycan interaction on gal-1. Fractional changes are calculated by subtracting from 1 the intensity of a given HSQC cross-peak divided by that in pure gal-1 at the same protein concentration. A value of 1 indicates that a resonance is no longer apparent, and a value of zero indicates no change in resonance intensity.
Fig. 2.

HSQC resonance broadening maps are shown for GM binding to gal-1. Fractional changes in gal-1 resonance intensities observed for gal-1 in the presence of GMs are exemplified with resonance broadening maps for GM 1.8 (3 mg/mL, A) and GM 2 (1.8 mg/mL, B) vs the amino acid sequence of gal-1. Data are shown under conditions where most gal-1 resonances are still apparent. A value of 1 indicates that the resonance associated with that particular residue is no longer apparent, and a value of zero indicates no change in resonance intensity.
Since resonances in the intermediate exchange regime are initially chemically shifted as they are broadened (some more than others), we also show HSQC chemical shift maps (Rajagopal et al. 1997) for some of these GMs in Figure 3. Resonances that are highly broadened prior to significant shift changes, of course, are absent from these plots, and for some others that may not be readily apparent in HSQC data shown, cross-peaks could be followed in by going more into the spectral floor of the contour plots. Correlation plots of the chemical shift difference, Δδ, for one GM vs another all give correlation coefficients in the range 0.6–0.72, suggesting similar modes of interaction with gal-1.
Fig. 3.

HSQC chemical shift mapping is shown for GM binding to gal-1. 15N- and 1H-weighted chemical shift changes, Δδ, between 15N-gal-1 (the absence of ligands) and 15N-gal-1 in the presence of near saturating concentrations of GM 2 (A), GM 2.4 (B) and GM 3 (C) are plotted vs the amino acid sequence of gal-1.
Both broadening and chemical shift mapping (Figures 2 and 3) provide a fairly consistent picture as to where these GMs interact on gal-1. Although there could be multiple modes of interaction, it appears that the GMs interact primarily with the same region on gal-1, as illustrated in Figure 4. Gal-1 has a β-sandwich structure that is comprised of 11 β-strands, with the lactose-binding site primarily comprising β-strands 4, 5, 6 and 9, and the dimer interface is made up of strands 1 and 11. The proposed primary site for interaction is at the edge of the β-sandwich from the top of the canonical β-galactoside-binding site down to the dimer interface and includes loops 10–14, 62–76, 91–96 and 111–112, as indicated. Residues at and around the canonical β-galactoside-binding site are also affected (not highlighted in Figure 4), but usually to a lesser extent. However, residues 29–31 and others from 44 to 57, which do lie primarily on the canonical β-galactoside-binding face of gal-1, are as well significantly perturbed. This observation suggests that either a single GM-binding epitope interacts concertedly with both regions on gal-1 and/or two or more GM-binding epitopes interact independently with these two regions, such that we observe their net interactions in 15N-gal-1 HSQC spectra.
Fig. 4.
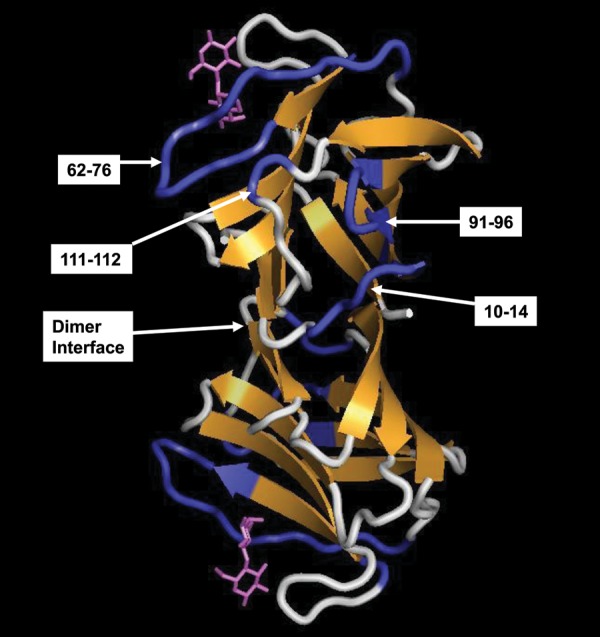
The proposed GM-binding domain on gal-1 is shown. Segments containing residues that are most affected by binding to these GMs in general are indicated and are highlighted in blue on the structure of the gal-1 dimer, as discussed in the text. The X-ray structure of lactose-bound human gal-1 was used in this figure (pdb access code: 1gzw, Lopez-Lucendo et al. 2004), and bound lactose molecules are shown in purple.
Because GM 2 induces the greatest broadening of gal-1 resonances, we conclude that gal-1 has the strongest interactions with GM 2 and less so with GMs having either smaller or larger Man/Gal ratios. Figure 5 plots the change in broadening averaged over all gal-1 residues vs the glycan concentration for each GM. Although it is appealing to interpret the mid-points in these plots as estimates of apparent equilibrium dissociation constants, Kd, this is misleading, primarily because gal-1-binding stoichiometry with each GM is unknown. It is more appropriate to think of these mid-points as an indication of net binding or overall binding avidity. Nevertheless, the trend is apparent and allows us to conclude that gal-1 interacts the strongest with GM 2.
Fig. 5.

The average fraction of resonance broadening from 15N-gal-1 HSQC resonance intensity changes vs the concentration (mg/mL) of GMs and mannans are shown. Solid lines are used as visual aids and simply connect data points in each curve.
We should also emphasize that differences in overall avidities for gal-1 are not correlated with differences in weight average molecular weights of these GMs. The trend shown in Figure 5 holds regardless of differences in size. For example, GM 2 (690 kDa), GM 2.4 (790 kDa) and GM 3 (685 kDa) are of similar size, and yet GM 2 shows the greatest avidity for gal-1. In addition, GM 1.7 (60 kDa), which is smaller than GM 1.1 (83 kDa), displays greater avidity for gal-1. Therefore, the trend in overall avidity (Figure 5) is explained primarily by differences in the Man/Gal ratio.
Statistical modeling
GM 2 with an average Man/Gal ratio of 2 does not mean that the polymer is homogeneous, with one Gal residue exactly positioned every two Man residues throughout the entire polysaccharide. For any of these GMs, there will be a distribution, for example, with regions where each Man will have a linked Gal, as well as regions where backbone Man residues will have no linked Gals (i.e. “naked” mannan sequences). Based on principles of combinatorial mathematics, this distribution can be statistically modeled and compared with our experimental data. Although there could be an infinite number of combinations and permutations of GM structures with different affinities for gal-1, our goal here was to identify a simple model (based on random distributions of galactose residues in the context of a mannan backbone) which could explain why the GM with a Man/Gal ratio of 2.0 binds best to gal-1.
For a random distribution, the statistical probability of having (Gal/Man)n clusters along the mannan backbone is given by:
| (1) |
and the probability of having clusters of “naked” (Man)n residues is given by:
| (2) |
where q is the fraction of “naked” Man residues in the GM; (1 − q) the fraction of Gal/Man clusters and n the number of sequential Gal/Man residues surrounded by “naked” Man residues.
For example, a Man/Gal ratio of 1.0 indicates that there would be no isolated “clusters” of (Gal/Man)n or (Man)n, and therefore P = 0 in either case. Alternatively, for a Man/Gal of 2.0, P = 0.52 × 0.5n. This formula also gives the probability of having doublets, triplets, quadruplets etc. of “naked” Man residues. If we take the “naked” Man residues to be 1.0 and Man/Gal = 2, P(1 − q) = 0.52 × 0.51 = 0.125 or 12.5%. For Man/Gal = 1.1, the average ratio of Gal/Man residues and “naked” Man residues would be 0.909:0.091, and the probability of having isolated Gal/Man singlets (n = 1), doublets (n = 2) etc. is given as 0.0912 × 0.909n. These probabilities would be the same for sequential (Man)n residues in the GM backbone.
We can achieve essentially the same result by randomly generating a probability distribution simply by “tossing a coin”, e.g. 300 times, with tails for having (Man) and heads for having (Gal/Man) residues along the GM backbone. For n = 1 to n = 6, we can calculate percentages from these probabilities as 13.3 ± 2.1, 6.3 ± 1.4, 3.0 ± 1.0, 1.6 ± 0.7, 0.7 ± 0.5 and 0.3 ± 0.3%, respectively. This indicates that for Man/Gal = 2, the above formulae adequately describe the distribution of (Gal/Man) and (Man) residues along the GM backbone.
Figure 6A plots P(n) vs the Man/Gal ratio for n = 1 to n = 6. Three observations can be made: (i) the P(n) maximum shifts from a Man/Gal ratio of ∼3 at n = 1 to ∼1.3 at n = 6; (ii) at lower Man/Gal ratios, the increase in P(n) to its maximum becomes greater as the n value is decreased and (iii) at higher Man/Gal ratios, the decrease in P(n) from its maximum becomes greater as the n value is increased. To compare these trends with experiment, Figure 6B plots changes in gal-1 HSQC resonance broadening averaged over all residues vs the Man/Gal ratio for data acquired at GM concentrations from 0.2 to 3 mg/mL. Increased broadening is proportional to increased avidity of gal-1 for these GMs. At any GM concentration, broadening is greatest for GM 2 (a Man/Gal ratio of 2) and decreases on either side of this Man/Gal ratio. The probability distribution for n = 2 (Figure 6A) is most consistent with these experimental data in that P(n) max occurs at about a Man/Gal ratio of 2. For n = 1, P(n) max is around 3, and for n = 3, P(n) max is around 1.6 or 1.7. Furthermore, for n = 2, P(n) falls ∼35% from its maximum by the Man/Gal ratio of 4, and this is about the same percentage decrease observed experimentally (Figure 6B). Over the same range, P(n) falls at most by 10% for n = 1 and by ∼70% for n = 3, and greater as the n value is increased further.
Fig. 6.

(A) Probabilities (relative distributions) P(n) of isolated sequences (Gal/Man)n for n between 1 and 6 along the galactomannan backbone. “Isolated” in this context means surrounded by “naked” (unsubstituted) single or multiple (Man) residues. Only one Gal residue can be attached to one Man residue, forming a (Gal/Man) pair. A random distribution of Gal residues along the galactomannan backbone, hence, a random distribution of (Gal/Man)n combinations (n = 1–6) is assumed for these calculations. This random distribution is described by formula P = q2 × (1 − q)n, where q is a fraction of “naked” Man residues in the galactomannan, and (1 − q) is a fraction of Gal/Man pairs in the galactomannan. (B) The effect of 1,4-β-d-galactomannans (GMs) with different degrees of attachment of (1 → 6)-α-d-Gal residues to (1 → 4)-β-d-Man residues in the GM backbone, described as the (Man/Gal) ratio, on the binding avidity of these GMs to gal-1. Binding avidity here is defined as the average broadening of 15N-gal-1 HSQC spectral peaks upon the interaction with these GMs.
This simple model, which is consistent with our experimental data, strongly suggests that the structural signature for binding of gal-1 to GMs is the presence of α-d-galactopyranosyl doublets, randomly distributed over the GM backbone and interspersed with regions of “naked” mannose.
Binding of gal-1 to a mannotriaose and mannopentaose
We next investigated whether, and if so how, gal-1 binds the α-d-galactopyranosyl doublet signature in the context of a simple mannopentaose [63,64-di-α(1 → 6)-d-galactosyl-β-d-mannopentaose], with a mannotriaose [61-α(1 → 6)-d-galactosyl-β-d-mannotriaose] and lactose as controls. For this, we performed the same 15N-gal-1 HSQC titrations using these simple saccharides. Figure 7A and B shows HSQC expansions and spectral overlays through these titrations, and Figure 7C shows the same with lactose for comparison. From these data, it is apparent that both GM mannotriaose and mannopentaose, like lactose, interact with gal-1. Moreover, because gal-1 resonances are primarily chemically shifted (like lactose; Miller, Nesmelova, et al. 2009) and are not highly broadened, intrinsic-binding affinity is relatively weak vis-à-vis binding avidity of gal-1 to the larger and more complex GMs. Inserts in Figure 7A–C plot the average chemical shift changes for the top 30 shifting residues vs the saccharide concentration, respectively. From the mid-points of these curves, we can estimate apparent Kd values of ∼21 × 10−3 and ∼6 × 10⁻³ M for the GM mannotriaose and GM mannopentaose, respectively, compared with that of ∼0.3 × 10⁻³ M for lactose. As expected, both GM mannotriaose and mannopentaose bind gal-1 with much lower affinities than does lactose.
Fig. 7.
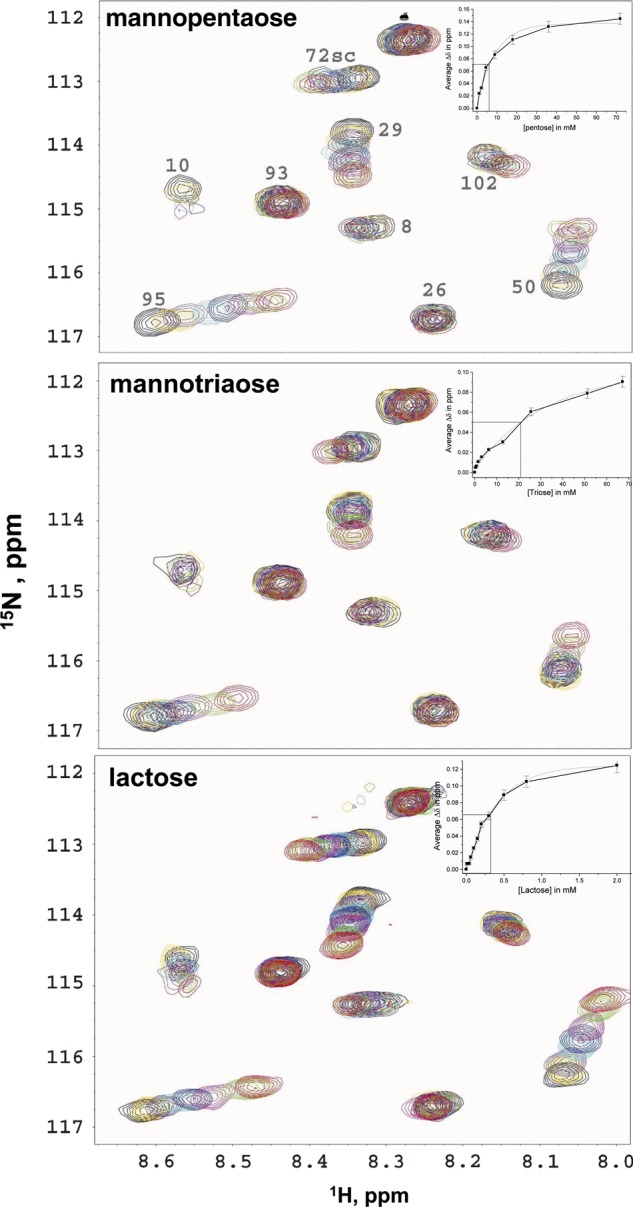
15N-gal-1 HSQC spectral expansions are shown, with eight overlays each, one for gal-1 (0.3 mM) alone (black cross-peaks) and the others for 15N-gal-1 in the presence of 1.1–72 mM (red) of GM mannopentaose 63,64-di-α(1 → 6)-d-galactosyl-β-d-mannopentaose (mannopentaose, A); 0.4–67 mM (red) 61-α(1 → 6)-d-galactosyl-β-d-mannotriaose (mannotriaose, B) and 0.04–10 mM (red) lactose (C). Inserts to each panel plots the average chemical shift changes over the top 30 shifting residues vs the saccharide concentration, respectively. The mid-points on these curves allow estimation of equilibrium dissociation constants, Kd, for the binding of each saccharide to gal-1, as discussed in the text.
The mannopentaose used here [63,64-di-α(1 → 6)-d-galactosyl-β-d-mannopentaose; Supplementary material, Figure S2] has essentially the same basic structural unit as suggested by our statistical analysis for optimal binding of GMs to gal-1 in terms of having the α-d-galactopyranosyl doublet signature and indeed binds gal-1 4-fold better than does the mannotriaose [61-α(1 → 6)-d-galactosyl-β-d-mannotriaose] with only one galactose residue. Moreover, this mannopentaose binds gal-1 with about the same affinity as galactose itself, suggesting that the mannoses do not contribute to any great extent to affinity in this case. This supports our conclusion from the statistical analysis that the α-d-galactopyranosyl doublet confers better binding to gal-1.
To assess where on gal-1 these saccharides interact, Figure 8A, C and E shows chemical shift maps for GM mannopentaose, GM mannotriaose and lactose, respectively. All three maps appear similar, and correlation coefficients derived from plots of Δδ values for lactose vs those for GM mannotriaose or GM mannopentaose are 0.68 and 0.74, respectively. Therefore, we conclude that both GM mannotriaose and GM mannopentaose interact at the canonical lactose-binding site on gal-1. However, there are differences in their modes of interaction at this site, as is apparent in Figure 8, which shows Δδ difference maps for mannopentaose minus lactose (Figure 8B) and for mannotriaose minus lactose (Figure 8D). The more positive differences in Δδ suggest that the GM mannopentaose or mannotriaose exerts greater effects at these positions, whereas the more negative Δδ differences suggest that lactose has the greater influence.
Fig. 8.

HSQC chemical shift maps are shown for GM mannotriaose and GM mannopentaose binding to gal-1. 15N- and 1H-weighted chemical shift changes (ppm), Δδ, between gal-1 (absence of ligands) and gal-1 (0.3 mM) in the presence of 35 mM mannopentaose (A), 10 mM lactose (C) and 70 mM mannotriaose (E) are plotted vs the amino acid sequence of gal-1. The other two panels show difference maps for Δδ mannopentaose minus Δδ lactose (B) and Δδ mannotriaose minus Δδ lactose (D), as discussed in the text.
In both cases, gal-1 sequences that show the greatest differences include residues 29–32, 48–76, 90–92 and 100/104. Residues within the 48–76 sequence (β-strands 4 and 5, along with turn 51–54 and loop 65–76) essentially form the canonical lactose-binding site. For example, R48, N61 and E71 form hydrogen bonds with groups from lactose and W68 interacts directly with the galactose ring of lactose via CH–π stacking interactions (Nesmelova et al. 2010). Differences in residues 29–32 in the loop going into β-strand 3 are essentially explained by proximity to R48–F49. There are also significant differences with residues 87/90–92 and 100 which lie on the opposite side of the β-sandwich. Internal β-sandwich residue L100, for example, interacts directly with I58, which likely explains this difference. However, it is unclear why residues 90–92 are so affected, because they are relatively distant from the lactose-binding domain, other than to say that they are highly perturbed by saccharide binding. Overall, the GM mannopentaose has greater effects at R48/L32, I58, T70, E71, E74 and V76. This is interesting because GM mannopentaose binding to gal-1 is much weaker than with lactose, and the larger mannopentaose appears to exhibit greater interactions particularly at the 70–76 loop which lies at the top of the lactose-binding domain. This region then flows to the side of the β-sandwich with which the larger GMs interact, as discussed in the previous sections.
Discussion
Using a series of GMs with different Man/Gal ratios, we report here on the structural signature for optimal binding of GMs to gal-1. One feature of this signature is the presence of α-d-galactopyranosyl doublets, randomly distributed over the GM backbone. This is based on the experimental observations of HSQC resonance broadening, which indicates that gal-1 has the strongest interactions with a GM having a Man/Gal ratio of 2, and much less so with GMs having either smaller or larger Man/Gal ratios. This conclusion is supported by statistical analyses using a simple model that is parameterized for the fraction of Gal/Man clusters, the fraction of “naked” Man residues and the number of sequential Gal/Man residues surrounded by “naked” Man residues. The most acceptable probability distribution is for a Man/Gal ratio of 2, consistent with experimental observations. At Man/Gal ratios higher than 2, Gal residues would be more scattered along the mannopyranosyl polymer chain, with lower probability of having isolated clusters of Galn residues. At lower Man/Gal ratios approaching 1.0 (i.e. all Man residues would have attached Gal residues), the probability of having isolated Gal clusters, surrounded with “naked” Man residues, would also be low.
This investigation also suggested another facet to the optimal signature, namely that α-d-galactopyranosyl doublets should be flanked by regions of “naked” mannan. Doing this would provide less sterical hindrance for the α-d-galactopyranosyl doublet to interact with gal-1. This suggestion is supported by our experimental observation of relatively greater binding of gal-1 to GMs with Man/Gal ratios of 3 or 4 vis-à-vis GM with a Man/Gal ratio of 1.1, which has essentially no stretches of “naked” mannan. Binding still occurs, but to a lesser extent. Previous studies also demonstrated that gal-1 can bind to a polymannan, albeit more weakly than to a GM (Miller, Klyosov, Mayo, et al. 2009). Moreover, HSQC broadening mapping indicates that any of these GMs with different Man/Gal ratios interacts at least partly at an alternative site adjacent to the canonical lactose-binding domain and on the backside β-sheet of the gal-1 β-sandwich. This observation is also consistent with that reported earlier for polymannan interaction with gal-1 (Miller, Klyosov, Mayo, et al. 2009).
β-d-Mannanase hydrolysis studies of GMs with different Man/Gal ratios (like the GMs investigated here) do indicate that GMs with random distributions of Gal residues will contain significant segments of backbone mannose residues devoid of galactose moieties. Even though different β-d-mannanases exhibit different modes of GM hydrolysis (McCleary and Matheson 1983; McCleary et al. 1983, 1984), it is generally the case that GMs with Man/Gal ratios of ∼2 and above will have segments of four or more “naked” mannans. For example, the Aspergillus niger β-d-mannanase digestion of several GMs with different Man/Gal ratios shows that the degree of hydrolysis is greatest when four or more “naked” mannans are present, presumably because of steric hindrance from galactose moieties in other regions (see Table 3 in McCleary and Matheson 1983). In another study, hydrolysis of three GMs (Man/Gal ratios of 1.7, 3.0 and 4.0) using two endo-β-mannanases (from Chrysosporium lucknowense and Trichoderma reesei) results in relative degrees of conversion of 1.0:3.3:4.4 and 1.0:3.3:3.3, respectively. Assuming that β-mannanase-catalyzed hydrolysis can occur at “naked” sequences of Man from n = 1 to n = 6, then the limited degrees of conversion for these Man/Gal ratios would be 0.6:0.8:1.0 which is quite different from what is observed experimentally, i.e. 3.3/4.4:3.3:1.0. Calculated probabilities for n = 1 to n = 6 indicate that these β-mannanases preferentially digest GMs at sites with four (or more) “naked” Man residues in the polymer backbone (personal communication from Prof. A.P. Synitsyn et al., Department of Chemistry, Moscow State University, unpublished results).
Our NMR gal-1-binding studies with 61-α(1 → 6)-d-galactosyl-β-d-mannotriaose and 63,64-di-α(1 → 6)-d-galactosyl-β-d-mannopentaose indicate that α-d-galactopyranosyl doublets of these two small GMs interact at the canonical lactose-binding region. Nevertheless, their interactions at that site are expectedly different from those of the β-galactoside, as are the induced indirect conformational effects resulting from binding. Compared with lactose, GM mannopentaose in particular shows greater effects on residues within the 70–76 loop which lies at the top of the lactose-binding domain. It is intriguing to propose that this is due to direct interactions of the GM mannopentaose with this loop, which is part of the site with which the larger GMs primarily have also been proposed to interact. Consequently, one possible structural model for how larger GMs interact with gal-1 is to have a segment with galactose moieties interact at the canonical lactose-binding site, while, for example, a segment of “naked” mannan folds over and interacts with the side of the β-sandwich, as illustrated in Figure 4.
Knowledge of this structural signature for GM binding to gal-1 is not only important to better understand galectin–glycan interactions, but also for designing better gal-1 (and perhaps other galectins) antagonists for use in the clinic. Presently, Davanat (a Guar-derived GM with a Man/Gal ratio of 1.7) is being developed as a therapeutic intervention against cancer (http://clinicaltrials.gov/ct2/show/NCT00110721). Davanat interacts with gal-1 which is known to be crucial to tumor growth via the promotion of tumor endothelial cell adhesion and migration (Thijssen et al. 2006). Davanat's mechanism of action may be explained by sequestering gal-1 to perturb normal gal-1 mass action, by inducing changes in the microenvironment around gal-1 and cell surface glycans or by affecting gal-1-glycoconjugate supramolecular structure. Any of these could influence gal-1 function in terms of cell adhesion/migration, glycan cross-linking and/or glycoconjugate receptor signaling. The present results may now be used to derive a GM with a more optimal Man/Gal ratio of 2.
In summary, these results indicate that gal-1 binds GMs preferentially at α-d-galactopyranosyl doublets, randomly distributed over the GM backbone, and surrounded by regions of “naked” Man residues. These studies expand our view of how galectins in general interact with more complex glycans and will be helpful to the development of GM-based galectin blockers as drug candidates against a number of pathological diseases.
Materials and methods
Gal-1 preparation
Uniformly 15N-labeled human gal-1 was expressed in BL21(DE3) competent cells (Novagen), grown in minimal media, purified over a β-lactose affinity column and further fractionated on a gel filtration column, as described previously by Nesmelova, Pang et al. (2008). Typically, 44 mg of the purified protein was obtained from 1 L of cell culture. The purity of the final sample was quantified by using the Biorad protein assay and was checked for purity by using sodium dodecyl sulfate–polyacrylamide gel electrophoresis. Functional activity of the purified protein was assessed by using a T-cell death assay.
Glycan preparation
1,4-β-d-Galactomannan from C. tetragonoloba (guar gum; Man/Gal = 1.7) of weight averaged molecular weight 59 kDa (Miller, Klyosov, Platt, et al. 2009) was produced by Galectin Therapeutics Inc. (Newton, MA) under the commercial name Davanat® and described in US Patent Numbers 6642205 and 7893252 and as published in Platt et al. (2006) and Miller, Klyosov, Platt et al. (2009). 1,4-β-d-Galactomannan from C. siliqua (locust bean; >1000 kDa; Man/Gal = 4.0) was obtained from Sigma Chemical (St Louis, MO), catalog No. G-0753, Lot 109H0899. Other 1,4-β-d-galactomannans used here were kindly provided by Dr Vladimir D Shcherbukhin, Institute of Biochemistry, Russian Academy of Sciences, Moscow, Russia, and described in Ilyina et al. (2006), Shcherbukhin (1992) and Mestechkina and Shcherbukhin (1991). These include the following, with weight averaged molecular weights and Man/Gal ratios given in parentheses:
GM from M. falcata (yellow lucerne) (83 kDa; Man/Gal 1.1)
GM from C. tetragonoloba (guar gum) (100 kDa; Man/Gal 1.8)
GM from Lagonychium farctum (mimosa) (690 kDa; Man/Gal 2)
GM from Gleditsia triacanthos (honey locust) (215 kDa; Man/Gal 2.2)
GM from G. triacanthos (honey locust) (790 kDa; Man/Gal 2.4)
GM from Gleditsia capsa (locust tree) (685 kDa; Man/Gal 3)
Lactose and α-mannan from Saccharomyces cerevisiae (weight-averaged molecular weight of 50 kDa) were purchased from Sigma Chemical and were used without further purification. This α-mannan from S. cerevisiae (yeast) is thought to be highly branched and likely composed of an α(1 → 6)-mannan backbone and variously linked α(1 → 2) and α(1 → 3) mannose residues. 61-α(1 → 6)-d-Galactosyl-β-d-mannotriaose (GM mannotriaose), 63,64-di-α(1 → 6)-d-galactosyl-β-d-mannopentaose (GM mannopentaose) and β(1 → 4)-mannan from the Ivory nut plant (weight-averaged molecular weight ∼5 kDa) were purchased from Megazyme International Ireland (Wicklow, Ireland).
Heteronuclear NMR spectroscopy
Uniformly 15N-labeled gal-1 was dissolved at a concentration of 1 mg/mL in 20 mM potassium phosphate buffer at pH 7.0, made up using a 95% H2O/5% D2O mixture. 1H–15N HSQC NMR experiments were used to investigate binding of a series of GM-based polysaccharides to gal-1. 1H and 15N resonance assignments for recombinant gal-1 were reported previously (Nesmelova and Pang et al., 2008).
All NMR experiments were carried out at 30°C on a Varian Unity Inova 600-MHz spectrometer equipped with an H/C/N triple-resonance probe and x/y/z triple-axis pulse field gradient unit. A gradient sensitivity-enhanced version of two-dimensional 1H–15N HSQC was applied with 256 (t1) × 2048 (t2) complex data points in nitrogen and proton dimensions, respectively. Raw data were converted and processed by using NMRPipe (Delaglio et al. 1995) and were analyzed by using NMRview (Johnson and Blevins 1994).
Supplementary data
Supplementary data for this article is available online at http://glycob.oxfordjournals.org/.
Funding
This work has been supported by a research grant from the National Cancer Institute (NIH R01 CA096090) to KHM. MCM was supported by the Cancer Biology Training Grant to the University of Minnesota from the National Institutes of Health (NIH T32 CA009138). NMR instrumentation was provided with funds from the National Science Foundation (BIR-961477), the University of Minnesota Medical School and the Minnesota Medical Foundation.
Conflict of interest
None declared.
Abbreviations
gal-1, galectin-1; GM, α-galactomannan; HSQC, heteronuclear single quantum coherence; 15N-gal-1, 15N-enriched gal-1; NMR, nuclear magnetic resonance.
Supplementary Material
Acknowledgements
We are most grateful and indebted to Prof. Linda Baum and Mabel Pang of the Department of Pathology and Laboratory Medicine, UCLA for providing us with their expression system (vector/plasmid) for human gal-1.
References
- Barondes SH, Castronovo V, Cooper DN, Cummings RD, Drickamer K, Feizi T, Gitt MA, Hirabayashi J, Hughes C, Kasai K, et al. Galectins: A family of animal β-galactoside-binding lectins. Cell. 1994;76:597–598. doi: 10.1016/0092-8674(94)90498-7. doi:10.1016/0092-8674(94)90498-7. [DOI] [PubMed] [Google Scholar]
- Cao Z, Said N, Amin S, Wu HK, Bruce A, Garate M, Hsu DK, Kuwabara I, Liu FT, Panjwani N. Galectins-3 and -7, but not galectin-1, play a role in re-epithelialization of wounds. J Biol Chem. 2002;277:42299–42305. doi: 10.1074/jbc.M200981200. doi:10.1074/jbc.M200981200. [DOI] [PubMed] [Google Scholar]
- Daas PJH, Schols HA, de Jongh HHJ. On the galactosyl distribution of commercial galactomannans. Carbohydr Res. 2000;329:609–619. doi: 10.1016/s0008-6215(00)00209-3. doi:10.1016/S0008-6215(00)00209-3. [DOI] [PubMed] [Google Scholar]
- Delaglio F, Grzesiek S, Vuister GW, Zhu G, Pfeifer J, Bax A. J Biomol NMR. 1995;6:277–293. doi: 10.1007/BF00197809. [DOI] [PubMed] [Google Scholar]
- Fischer C, Sanchez-Ruderisch H, Welzel M. Galectin-1 interacts with the α5β1 fibronectin receptor to restrict carcinoma cell growth via induction of p21 and p27. J Biol Chem. 2005;280:37266–37277. doi: 10.1074/jbc.M411580200. doi:10.1074/jbc.M411580200. [DOI] [PubMed] [Google Scholar]
- Ilyina AV, Mestechkina NM, Shcherbukhin VD, Varlamov VP. Depolymerization of legume seed galactomannan by Celloviridin G20x. Prikladnaya Biokhimiya I Mikrobiologiya. 2006;42:580–586. [PubMed] [Google Scholar]
- Johnson BA, Blevins RA. J Biomol NMR. 1994;4:603–614. doi: 10.1007/BF00404272. doi:10.1007/BF00404272. [DOI] [PubMed] [Google Scholar]
- Keeler J. Understanding NMR Spectroscopy. New York: Wiley and Sons; 2005. [Google Scholar]
- Liu FT, Rabinovich GA. Galectins as modulators of tumour progression. Nat Rev Cancer. 2005;5:29–41. doi: 10.1038/nrc1527. doi:10.1038/nrc1527. [DOI] [PubMed] [Google Scholar]
- Lopez-Lucendo MF, Solıs D, Andre S, Hirabayashi J, Kasai K, Kaltner H, Gabius H-J, Romero A. Growth-regulatory human galectin-1: Crystallographic characterisation of the structural changes induced by single-site mutations and their impact on the thermodynamics of ligand binding. J Mol Biol. 2004;343:957–970. doi: 10.1016/j.jmb.2004.08.078. doi:10.1016/j.jmb.2004.08.078. [DOI] [PubMed] [Google Scholar]
- McCleary BV, Dea ICM, Windust J, Cooke D. Interaction properties of D-galactose-depleted Guar galactomannan samples. Carbohydr Polymers. 1984;4:253–270. doi:10.1016/0144-8617(84)90002-X. [Google Scholar]
- McCleary BV, Matheson NK. Action patterns and substrate-binding requirements of β-D-mannanase with mannosaccharides and mannan-type polysaccharides. Carbohydr Res. 1983;119:191–219. doi:10.1016/0008-6215(83)84056-7. [Google Scholar]
- McCleary BV, Nurthen E, Taravel FR, Joseleau J-P. Characterization of the oligosaccharides produced on hydrolysis of galactomannan with β-D-mannanase. Carbohydr Res. 1983;118:91–109. doi:10.1016/0008-6215(83)88038-0. [Google Scholar]
- Mestechkina NM, Shcherbukhin VD. Galactomannan from Galega orientalis Lam. Seeds. Appl Biochem Microbiol. 1991;26:648–651. [Google Scholar]
- Miller MC, Klyosov AA, Mayo KH. The α-galactomannan Davanat binds galectin-1 at a site different from the conventional galectin carbohydrate binding domain. Glycobiology. 2009;19:1034–1045. doi: 10.1093/glycob/cwp084. doi:10.1093/glycob/cwp084. [DOI] [PMC free article] [PubMed] [Google Scholar]
- Miller M, Klyosov A, Platt D, Mayo KH. Using pulse field gradient NMR diffusion measurements to define molecular weight distributions in glycan preparations. Carbohydr Res. 2009;344:1205–1212. doi: 10.1016/j.carres.2009.04.010. doi:10.1016/j.carres.2009.04.010. [DOI] [PubMed] [Google Scholar]
- Miller MC, Nesmelova IV, Platt D, Klyosov A, Mayo KH. Carbohydrate binding domain on galectin-1 is more extensive for a complex glycan than for simple saccharides: Implications for galectin-glycan interactions at the cell surface. Biochem J. 2009;421:211–221. doi: 10.1042/BJ20090265. doi:10.1042/BJ20090265. [DOI] [PMC free article] [PubMed] [Google Scholar]
- Neri D, Bicknell R. Tumour vascular targeting. Nat Rev Cancer. 2005;5:436–446. doi: 10.1038/nrc1627. doi:10.1038/nrc1627. [DOI] [PubMed] [Google Scholar]
- Nesmelova IV, Dings RPM, Mayo KH. Understanding galectin structure-function relationship to design effective antagonists. In: Klyosov AA, Witczak ZJ, Platt D, editors. Galectins. Hoboken, NJ: John Wiley & Sons; 2008. pp. 33–69. [Google Scholar]
- Nesmelova IV, Ermakova E, Daragan VA, Pang M, Menéndez M, Lagartera L, Solís D, Baum LG, Mayo KH. Lactose binding to galectin-1 modulates structural dynamics, increases conformational entropy, and occurs with apparent negative cooperativity. J Mol Biol. 2010;397:1209–1230. doi: 10.1016/j.jmb.2010.02.033. doi:10.1016/j.jmb.2010.02.033. [DOI] [PubMed] [Google Scholar]
- Nesmelova IV, Pang M, Baum LG, Mayo KH. 1H, 13C, and 15N backbone and side-chain chemical shift assignments for the 29 kDa human galectin-1 protein dimer. J NMR Assign. 2008;2:203–205. doi: 10.1007/s12104-008-9121-9. doi:10.1007/s12104-008-9121-9. [DOI] [PubMed] [Google Scholar]
- Perillo NL, Pace KE, Seilhamer JJ, Baum LG. Apoptosis of T cells mediated by galectin-1. Nature. 1995;378:736–739. doi: 10.1038/378736a0. doi:10.1038/378736a0. [DOI] [PubMed] [Google Scholar]
- Perillo NL, Uittenbogaart CH, Nguyen JT, Baum LG. Galectin-1, an endogenous lectin produced by thymic epithelial cells, induces apoptosis of human thymocytes. J Exp Med. 1997;185:1851–1858. doi: 10.1084/jem.185.10.1851. doi:10.1084/jem.185.10.1851. [DOI] [PMC free article] [PubMed] [Google Scholar]
- Platt D, Klyosov AA, Zomer E. In: Carbohydrate Drug Design. Klyosov AA, Witczak ZJ, Platt D, editors. Vol. 932. Washington (DC): ACS Symposium Series; 2006. pp. 49–66. American Chemical Society. [Google Scholar]
- Rabinovich GA. Galectin-1 as a potential cancer target. Br J Cancer. 2005;92:1188–1192. doi: 10.1038/sj.bjc.6602493. doi:10.1038/sj.bjc.6602493. [DOI] [PMC free article] [PubMed] [Google Scholar]
- Rajagopal P, Waygood EB, Reizer J, Saier MH, Klevit RE. Demonstration of protein–protein interaction specificity by NMR chemical shift mapping. Protein Sci. 1997;6:2624–2627. doi: 10.1002/pro.5560061214. doi:10.1002/pro.5560061214. [DOI] [PMC free article] [PubMed] [Google Scholar]
- Shcherbukhin VD. Galactomannans from seeds of the leguminous plants. Soviet Union Food Hydrocolloids. 1992;6:3–7. doi:10.1016/S0268-005X(09)80054-4. [Google Scholar]
- Thijssen VL, Postel R, Brandwijk RJ, Dings RP, Nesmelova I, Satijn S, Verhofstad N, Nakabeppu Y, Baum LG, Bakkers J, et al. Galectin-1 is essential in tumor angiogenesis and is a target for antiangiogenesis therapy. Proc Natl Acad Sci USA. 2006;103:15975–15980. doi: 10.1073/pnas.0603883103. doi:10.1073/pnas.0603883103. [DOI] [PMC free article] [PubMed] [Google Scholar]
- Werz DB, Ranzinger R, Herget S, Adibekian A, von der Lieth C-W, Seeberger PH. Exploring the structural diversity of mammalian carbohydrates (“glycospace”) by statistical databank analysis. Chem Biol. 2007;2:685–691. doi: 10.1021/cb700178s. [DOI] [PubMed] [Google Scholar]
Associated Data
This section collects any data citations, data availability statements, or supplementary materials included in this article.