


Abstract
ChIP-seq is increasingly used to characterize transcription factor binding and chromatin marks at a genomic scale. Various tools are now available to extract binding motifs from peak data sets. However, most approaches are only available as command-line programs, or via a website but with size restrictions. We present peak-motifs, a computational pipeline that discovers motifs in peak sequences, compares them with databases, exports putative binding sites for visualization in the UCSC genome browser and generates an extensive report suited for both naive and expert users. It relies on time- and memory-efficient algorithms enabling the treatment of several thousand peaks within minutes. Regarding time efficiency, peak-motifs outperforms all comparable tools by several orders of magnitude. We demonstrate its accuracy by analyzing data sets ranging from 4000 to 1 28 000 peaks for 12 embryonic stem cell-specific transcription factors. In all cases, the program finds the expected motifs and returns additional motifs potentially bound by cofactors. We further apply peak-motifs to discover tissue-specific motifs in peak collections for the p300 transcriptional co-activator. To our knowledge, peak-motifs is the only tool that performs a complete motif analysis and offers a user-friendly web interface without any restriction on sequence size or number of peaks.
INTRODUCTION
ChIP-seq (1,2) has recently become a method of choice to study the binding preferences of transcription factors, as well as the localization of epigenetic regulatory marks at a genomic scale. The first steps of the computational analysis (read mapping and peak calling) typically result in several thousands of peak regions ranging between 200 and 10 000 bp. Motif analysis is required to extract the relevant information from these regions: discover binding motifs that capture the binding specificity of the pulled-down factor and their possible co-regulators; compare discovered motifs to databases to predict associated transcription factors; predict the exact positions of the binding sites (usually much shorter than the peak regions); study the binding specificity of transcription factors in various contexts (cell types, mutant strains and transcription factor isoforms).
Specialized software tools have recently been developed for the analysis of ChIP-seq peaks, supporting different combinations of motif-related tasks (Table 1). An important bottleneck for most existing tools is that the underlying algorithms were originally developed to discover binding motifs from a small set of co-regulated promoters, and can hardly treat the thousands of peaks produced by ChIP-seq experiments. This limitation is typically circumvented by restricting motif discovery to a few hundreds peak regions and by truncating the peaks to a maximal width (e.g. 100 bp) to further reduce the total size of the sequence set (3–5). However, given the power of the genome-wide experimental approach, one would like to be able to analyze the full data set. Some alternative algorithms support the analysis of large-scale data sets but are only available via a Unix shell interface (6–8), or as MATLAB functions (9), and are thus of poor usability for life-science researchers.
Table 1.
Features of software tools used for analyzing motifs in ChlP-seq peak seqm
| Program | Peak-motifs | ChipMunk | CompleteMotifs | MEME-ChIP | MICSA | GimmeMotifs |
|---|---|---|---|---|---|---|
| Web interface | Yes | Yes | Yes | Yes | No | No |
| Size limitation | Unrestricted (website tested with 22 Mb) | 100 kb (website) | 500 kb (web site) | Unrestricted, but analysis limited to 600 peaks clipped to 100 bp | Motif discovery restricted to a few hundred base pairs | – |
| Stand-alone version | Yes | Yes | No | Yes | Yes | Yes |
| Tasks | ||||||
| Peak finding | No | No | No | No | Yes | No |
| Annotation of peak-flanking genes | No | No | Yes | No | No | |
| Sequence composition (mono- and di-nucleotides) | Yes | No | No | No | No | |
| Motif discovery | Yes | Yes | Yes | Yes | Yes | Yes |
| Enrichment in motifs from databases | No | No | Yes | Yes | No | |
| Enrichment in discovered motifs | Yes | No | No | No | No | |
| Peak scoring | No | No | No | Yes | Yes | No |
| Motif clustering | No | No | No | No | Yes | |
| Comparison discovered motifs/motif DB | Yes | No | No | Yes | Yes | |
| Sequence scanning for site prediction | Yes | No | No | Yes | No | |
| Positional distribution of sites inside peaks | Yes | No | Yes | No | Yes | |
| Visualization in genome browsers | Yes | No | Yes | No | No | |
| Motif discovery algorithms | RSAT oligo-analysis RSAT dyad-analysis RSAT local-word-analysis MEME ChlPMunk | ChipMunk | ChipMunk MEME Weeder | MEME DREME | MEME | MEME Weeder MotifSampler BioProspector Gadem Improbizer MDmodule Trawler MoAn |
| Pattern matching algorithms | RSAT matrix-scan-quick | No | patser | MAST + AME (enrichment) | No | |
| Motif comparison algorithm | RSAT compare-motifs | No | STAMP | TOMTOM | STAMP | |
| Motif clustering algorithm | STAMP | |||||
| Comparison between discovered motifs | Yes | No | Yes | No | Yes | |
| Motif database comparisons | JASPAR UNIPROBE DMMPMM RegulonDB upload your own database | No | JASPAR TRANSFAC | JASPAR TRANSFAC UNIPROBE FLYREG DPINTERACT SCPD DMMPMM and many others | No | |
| Motif sizes | Variable (multiple word assembly) | User-specified | ≤25 for MEME ≤12 for Weeder ≤ 13 for ChipMunk | Predefined ranges (small, medium, large, extra-large) | ||
| Multiple motifs | Yes | Yes | Yes | Yes | ||
| Ref (PMID) | This article | 20736340 | 21183585 | 21486936 | 20375099 | 21081511 |
The table summarizes the tasks, algorithms and usability properties to compare the different software options for the users. Most programs offer a web interface, but apply restrictive limitations on the size of the data sets to process. Although all programs support motif discovery, the other tasks are quite diverse and not all covered by a single program.
We have developed a computational pipeline called ‘peak-motifs’, motivated by the pressing need for a statistically reliable, time-efficient and user-friendly framework to analyze full data sets of ChIP-seq peaks or similar data (ChIP-PET, ChIP-on-chip, CLIP-seq). This comprehensive pipeline takes as input a set of peak sequences, discovers exceptional motifs, compares them with motif databases, predicts binding site positions and returns a structured HTML report with direct links to visualization in the UCSC genome browser (Figure 1). This tool can also be used for differential analyses, where two datasets are given as input (e.g. test versus control, or peaks from two experimental conditions), to discover motifs specific to one of the datasets.
Figure 1.

Schematic flow chart of the peak-motifs pipeline. For sake of clarity, only the main analysis steps are depicted. The pipeline takes as input a set of peak sequences, and runs several de novo motif discovery algorithms based on different detection criteria: over-representation, differential representation (test versus control), global position bias or local over-representation along the centered peaks. Transcription factors are predicted by matching discovered motifs against several public motif databases and/or against user-uploaded motif collections. Peak sequences are scanned with the discovered motifs to predict precise binding positions. These positions are then automatically exported as an annotation track for UCSC genome browser, thus enabling a flexible visualization in their genomic context.
We first show that this motif discovery approach is significantly faster than other available alternatives, thereby allowing processing of comprehensive ChIP-seq data sets, even from the web server. We then demonstrate the biological relevance of the motifs discovered by our pipeline with two study cases, highlighting the benefit of analyzing complete datasets and using complementary approaches for motif discovery.
MATERIALS AND METHODS
The motif discovery step relies on a combination of tried-and-tested algorithms integrated in the software suite regulatory sequence analysis tools (RSAT, http://rsat.ulb.ac.be/rsat/) (10–12), which use complementary criteria to detect exceptional words (oligonucleotides and spaced motifs): global over-representation of oligonucleotides (oligo-analysis) or spaced pairs (dyad-analysis), heterogeneous positional distribution (position-analysis) and local over-representation (local-word-analysis) (12–15).
The motif comparison step is performed by compare-matrices (12), which supports a wide range of scoring metrics and displays the results as multiple alignments of logos, enabling to grasp the similarities between a discovered motif and several known motifs. This feature is particularly valuable to reveal adjacent fragments of the discovered motif showing similarities with two distinct known motifs, suggesting a bipartite motif for two factors (see the SOCT motif in Figure 4 and below).
Figure 4.
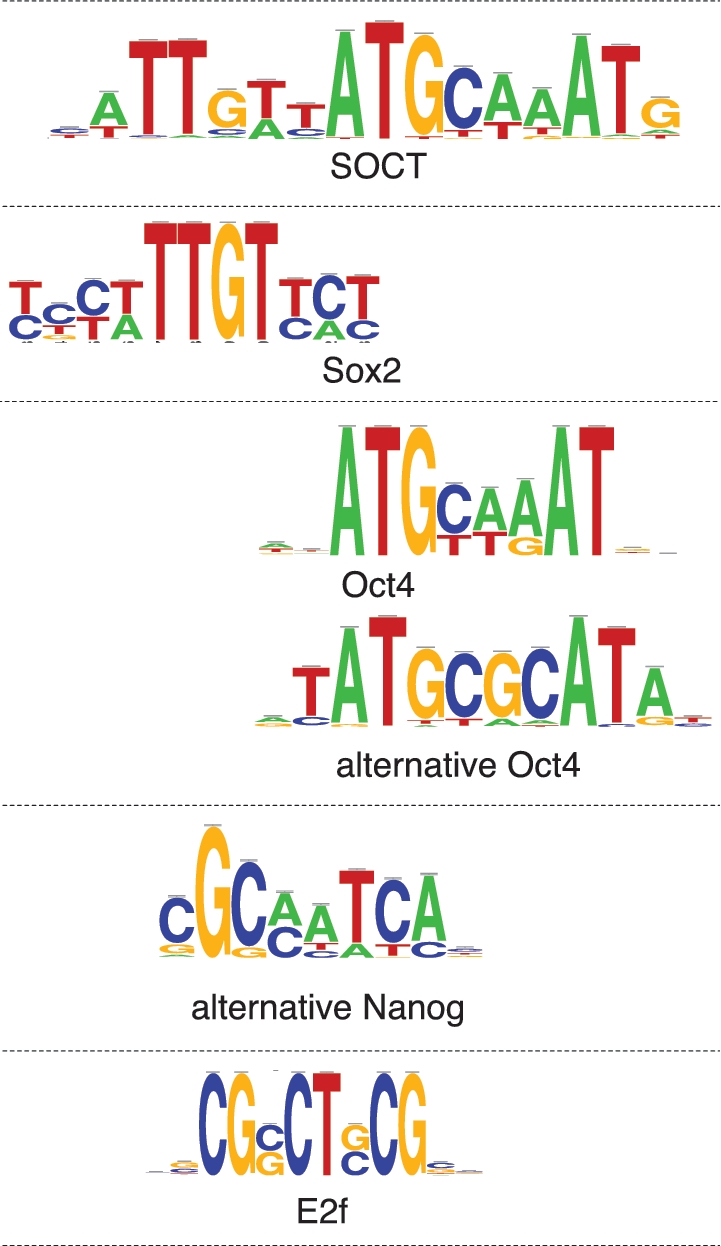
Logos of the motifs discovered by peak-motifs for the factors Oct4, Sox2, Nanog and E2f1 adapted from the ChIP-seq data set by Chen et al. (20).
As the individual components of the workflow have been described previously (12), we briefly explain here the choice of parameters for the different steps of peak-motifs analyses. The full list of commands and parameters are automatically reported at the end of each peak-motifs report. The parameters used for the case studies are available in the peak-motifs reports on the supporting website (http://rsat.bigre.ulb.ac.be/~rsat/supp_material_peak-motifs/).
Motif discovery
Word-based analysis is performed with hexanucleotides (k = 6) and heptanucleotides (k = 7). The significance tests underlying pattern detection ensure a control of the rate of false positives, with suitable multi-testing corrections. The motif discovery algorithms support higher order background models, which are of particular importance for modeling genomic sequences of vertebrates. For oligo-analysis, expected word frequencies were estimated with a Markov model of order m = k − 2, trained in the peak sequences. The website also allows to select lower order Markov models, which are less stringent but achieve a higher sensitivity with small data sets. For differential analysis, the expected frequency of each k-mer is estimated by taking the observed frequency of the same k-mer in the control set. Significant words are assembled using ‘pattern-assembly’ and converted to position-specific scoring matrices with matrix-from-patterns.
Motif comparison
Discovered motifs are compared (using compare-matrices) to one or several databases of known transcription factor binding motifs. The website directly supports comparisons with JASPAR (16), UNIPROBE (17), REGULONDB (18) and Drosophila-specific collections (19), thus providing a vast choice of known motifs, for a wide range of organisms. Personal or license-protected motif collections can also be uploaded. Several metrics are computed to measure the similarity between each matrix pair (Pearson correlation, width normalized correlation, logo dot product, correlation of information content, normalized Sandelin–Wasserman, sum of squared distances and normalized Euclidian similarity). As these metrics span over very different ranges, we convert them to ranks and compute a mean rank in order to obtain a robust comparison metrics.
Matrix scanning
Peak sequences are scanned to predict binding sites with the program matrix-scan, using as background model a Markov chain of order 1 trained on the peak sequences themselves. Noteworthy, a Markov order m ≥ 1 is required to account for the CpG avoidance observed in vertebrate genomes, and for other types of context-dependent residue probabilities. Predicted binding sites are mapped onto the genome (convert-features) and exported as BED files to be automatically loaded as custom tracks on the UCSC genome browser.
RESULTS
Peak-motifs processes full-sized ChIP-seq data sets in a few minutes
We assessed the time efficiency of peak-motifs by analyzing data sets of increasing sizes (from 100 to 1 000 000 peaks of 100 bp each), with total sequence sizes ranging from 10 kb to 100 Mb The computing time of the motif discovery algorithms integrated in peak-motifs increases linearly with sequence size and outperforms all the other existing motif discovery tools used in this comparison (Figure 2, Supplementary File S1). Data sets of several tens of megabytes are processed in a few minutes on a personal computer (the most efficient tool, oligo-analysis, treats 100 Mb in 3 min). This linear time response enables peak-motifs to scale up efficiently with sequence size, and allows us to provide an easy access via a web interface, without any data size restriction. This moreover gives us the possibility to run four distinct algorithms in order to detect motifs of various types (oligonucleotides, spaced pairs) based on complementary criteria (over-representation, positional heterogeneity).
Figure 2.

Time efficiency of motif discovery algorithms integrated in peak-motifs (plain lines) compared to alternative algorithms (dotted lines). The abscissa indicates sequence sizes, the ordinate processing times. The programs oligo-, dyad-, position-analysis and DREME show a linear time complexity (the power is ∼1), ChIPMunk has a quasi-linear complexity (power 1.27) and MEME a more than quadratic complexity (power 2.21). See Supplementary File S1 for the detailed analysis.
Analysis of the ChIP-seq peak sets for 12 DNA-binding transcription factors involved in mouse ES cell pluripotency and self-renewal
To evaluate the accuracy of the predicted motifs, we analyzed the ChIP-seq peak sets for 12 DNA-binding transcription factors involved in mouse embryonic stem cell pluripotency and self-renewal (20). The read sequences were downloaded from the Gene Expression Omnibus website and mapped with Bowtie (21) on the mouse mm9 assembly. Peak regions were extracted from reads using MACS (22) with a false discovery rate threshold of 0.2, and processed with PeakSplitter (23) to obtain actual peaks. For the Smad1 data set, MACS did not return a single peak with the selected parameters. We, therefore, used the peaks from the initial data set GSM288348, which contains 1084 ChIP-seq peaks for the Smad1 factor. The other data sets comprise between 4249 peaks for Stat3 (totaling 1.4 Mb) and 1 28 469 peaks for Esrrb (36.6 Mb).
For each of the 12 tested factors, peak-motifs discovered the correct motif (Figure 3). The relevant motifs were generally detected independently by several of the four algorithms, indicating that they are not only over-represented (oligo-analysis, dyad-analysis) but also positionally biased around peak centers (local-word-analysis, position-analysis). For several peak sets, recent studies (5,24) using novel motif-finding programs returned more accurate motifs than the original study, which was restricted to the 500 top-scoring peaks. Our comprehensive analysis also returned more accurate motifs than the original study, and performed as well or better than other recent motif-finding programs, as detailed below.
Figure 3.

Most significant motifs discovered with the different algorithms encompassed by peak-motifs for ChIP-seq peak collections pulled down with 12 transcription factors involved in ES cell pluripotency (20). The first three columns indicate the studied transcription factor and the size of the data set (in number of peaks and in Mb). The fourth and fifth columns display the ID and consensus of the chosen reference motif. The sixth column shows the best motif found by peak-motifs, followed by two estimations of the correlation between the discovered and the matched motifs (Cor and Cov). The following columns detail which algorithm(s) detected this motif, and which motifs from the Jaspar and Tranfac databases were similar to the found motif.
In the Sox2 and Oct4 peak sets, peak-motifs found not only the composite ‘SOCT’ motif bound by the Sox2/Oct4 complex (reported by Chen and co-workers), but also the distinct motifs recognized by Sox2 (CTCTTTGTT) and Oct4 (ATGyAAAt), respectively (Figure 4, top). Interestingly, in the Oct4 data set, unknown motifs were returned with a high significance, (i.e. motifs with no significant similarity with the consensus encompassed by the common databases). Such motifs may reveal alternative consensus, as in the case of the motif crTATGCGCATAyg, which actually corresponds to an alternative Oct4 motif, also detected in other recent studies (5,24).
As discussed by Chen and co-workers, Nanog and Smad1 frequently bind the same regions as Sox2/Oct4, which raises a particular difficulty for motif discovery. Indeed, their analysis of the Nanog peak set returned a Sox2-like motif instead of the Nanog binding motif. Subsequently, this Sox2-like motif was erroneously annotated as Nanog binding in the TRANSFAC database (matrix V$NANOG_02), although its consensus (CYWTTGTTNT) clearly differs from the previously annotated Nanog consensus (GGGNCCATTKCC, TRANSFAC matrix V$NANOG_01). The prevalent motif discovered by peak-motifs in Nanog peaks corresponds to the SOCT binding motif, while the canonical Nanog motif is not found. However, peak-motifs reports a motif (sCGCmaTCAbg) that is not similar to any motif found in the databases (Figure 4, middle). A similar motif with a ccAT(C/T)A core was also reported by Bailey (5), and actually corresponds to an experimentally validated alternative Nanog motif (25).
For the Smad1 factor, the peak size distribution of the original data set seems to be biased toward very small peaks (smallest peak is 1bp, mean size id 30 bp); nevertheless, peak-motifs was able to discover a motif agAAACAAAGCmar that matches the canonical Smad1 motif (V$SMAD1_01 adAAACAAAGcm). In addition, several other discovered motifs match a Sox-like motif wGAACAATAga, confirming the frequent co-binding of Smad1 and Sox.
In the E2f1 peak set, peak-motifs discovered several motifs matching the generic E2F consensus (GGCGsg, matrix V$E2F_Q2) but distinct from the E2f1-specific consensus (TTTsGCGG, in Transfac matrix V$E2F1_Q4; TTTsGCGC in JASPAR matrix MA0024.1) (Figure 4, bottom). Whereas no E2f1 motif was detected in the original study by Chen and co-workers (20), an E2f-like motif similar to ours was reported in ref. (5).
In summary, our analysis of the 12 peak sets from Chen and co-workers significantly improved motifs as compared to the original study, highlighting the value of applying motif discovery to full-size data sets. Remarkably, in addition to the motifs corresponding to the transcription factors targeted by the experiments, peak-motifs also returned several motifs corresponding to transcription factors presumably involved in the same regulatory pathways.
Analysis of the ChIP-seq peak sets for p300 in four different mouse embryonic tissues
Beyond the analysis of motif-specific DNA-binding transcription factors, the ChIP-seq approach can be used to characterize binding profiles of epigenetic regulators, chromatin marks and generic cofactors. In contrast with the transcription factors analyzed above, such cofactors do not recognize specific DNA motifs, but interact with various specific DNA-binding transcription factors and facilitate the activation of their target genes by modifying DNA structure. Genome-wide location analyzes of the generic cofactor p300 have been performed to reveal regions transcriptionally active in different tissues during embryonic development (26,27). Since the DNA regions identified by this approach likely contain binding sites for the transcription factors specifically active in the analyzed tissues and developmental stages, we wondered if peak-motifs would be able to detect the corresponding motifs. In this respect, we used peak-motifs to detect motifs from the ChIP-seq peaks of the generic enhancer-associated p300 cofactor. In the two aforementioned studies, binding profiles of this cofactor were characterized in several embryonic mouse tissues (heart, midbrain, forebrain and limb) and some binding regions were validated as tissue-specific enhancers. However, the transcription factors bound to those enhancers remain unknown.
We retrieved the peak locations for all four tissues. By running peak-motifs in the p300 peak sets in each of these four tissues, we were able to identify motifs potentially bound by tissue-specific regulators, as well as some motifs common to all four data sets, probably corresponding to ubiquitous activators (Supplementary File S2). Peak-motifs compared these discovered motifs to motifs of known factors stored in databases, including Transfac, JASPAR and UniProbe. Tissue-specific motifs include a motif found in the limb data set alone, which matches the consensus of Hox9, known to be involved in limb development (28). We also identify a GATA motif specific to the heart data set, which presumably points to a key factor of the cardiac gene regulatory network. As a validation of these predictions, we verified that the predicted transcription factors are indeed expressed in the corresponding tissues, using expression data from the MGI database (29) (Supplementary File S2).
For further validation, we analyzed data generated by ChIP-seq experiments targeting various heart-specific transcription factors (Mef2, SRF, GATA4, Nkx2.5) in the mouse HL1 cardiomyocyte cell line. Predicted motifs for these data sets strengthen our findings (Figure 5): the predicted GATA motif from the p300 heart data set clusters with similar motifs obtained from the GATA4 data set. Similarly, several motifs obtained in HL1 data sets cluster with the set of motifs from the p300 data sets matching the Mef2 consensus, giving insight into the highly combinatorial nature of cardiogenesis. We also found two ‘ubiquitous’ motifs significantly over-represented in all four data sets. The first is a C-rich motif, which matches the binding motif of Sp1, consistent with the fact that Sp1 functionally interacts with the acetylase domain of p300 (30,31). The second motif matches the Mef2 consensus (ATTTTTA). Interestingly, Mef2 is known to be involved not only in muscle formation, explaining its presence in the heart and limb data set, but also in CNS development (in particular neuron differentiation).
Figure 5.

Network of motifs discovered in the p300 data set. Each node represents a motif; the shape and color of the node denote the tissue (for the p300 datasets) and the ChIPed-factor (for the HL1 cell-line datasets, used as a validation), respectively. Two motifs are joined by a line if their normalized correlation is above 0.75; the width of the line denotes the degree of correlation. Node labels refer to the algorithm used to discover the motif: L (local-words), P (position-analysis), O (oligo-analysis), D (dyad-analysis) as well as the considered word length (6 or 7). The names of the transcription factor(s) likely associated with the motif clusters are also indicated, together with a representative logo.
The relevance of the discovered motifs opens the exciting prospect of predicting which transcription factors and enhancers are active in a given tissue and/or at a given developmental stage, by discovering specific TF motifs in the peaks pulled down by generic cofactors such as p300.
Peak-motifs is accessible through a user-friendly web interface
The simplest way to use peak-motifs is via its user-friendly web interface, where all parameters (background models, word lengths, etc.) are pre-selected according to the optimal conditions found from our study cases. The only required input is the set of peak sequences. A second set of peak sequences can also be provided to serve as background for differential analyses (treatment versus control). Although peak-motifs is designed to process full data sets, the interface offers the possibility to easily reduce the analysis to a subset of top sequences, or yet to clip peaks at a maximal size from their centers, thereby reducing the need for data manipulation on the user side. The web page is documented with a manual providing detailed information about each option. A ‘demo’ button fills up the form with a typical test set. A tutorial further guides new users through choices of parameters and explains how to interpret the results. In addition to its website access, peak-motifs can be used as a stand-alone application (Unix shell), as well as SOAP/WSDL web services (thereby enabling bioinformaticians to automate its use, without installing it on their machine).
A particular effort has been made to generate a clear and easily interpretable output for less-advanced users, while providing links to the raw results for the expert users. All result files are presented in standard formats and are downloadable as an archive along with the summary web page, to allow further analysis with third-party software. To our knowledge, peak-motifs is the only ChIP-seq pipeline offering direct visualization of the predicted binding sites as custom tracks in the UCSC genome browser. This feature is of prime importance to interpret the results in light of the genomic annotation, in order to plan experiments for further validation of the results.
DISCUSSION
Peak-motifs is a comprehensive pipeline to efficiently discover motifs and identify putative transcription factors in ChIP-seq and related data sets. We demonstrated its biological validity by recovering the correct motifs from 12 ChIP-seq sets corresponding to known transcription factors (20). We also performed an original analysis of the binding profiles of the generic cofactor p300 (26), which led us to predict specific motifs and transcription factors that are active in specific tissues at specific developmental stages. Our benchmarks showed that for large data sets peak-motifs outperforms its most serious competitors by a factor of at least 100, allowing us to analyze full data sets in a matter of minutes. This time efficiency enables an interactive web access for comprehensive data sets, thereby constituting a convenient tool for ChIP-seq data analyses even for naive users. This tool will be of broad interest to the increasing community of experimentalists and bioinformaticians who are confronted to the challenging issue of extracting interpretable information from the massive amounts of data resulting from next generation sequencing.
SUPPLEMENTARY DATA
Supplementary Data are available at NAR Online: Supplementary Files 1 and 2.
FUNDING
Alexander von Humboldt foundation (to M.T.C.); Agence Nationale de la Recherche (ANR) partner of the ERASysBio+ initiative supported under the EU ERA-NET Plus scheme in FP7; ANR Young Researchers Grant ‘CardiHox’ (to C.H.); the Belgian Program on Interuniversity Attraction Poles, initiated by the Belgian Federal Science Policy Office [project P6/25 (BioMaGNet)]; EU-funded COST action [BM1006 ‘Next Generation Sequencing Data Analysis Network’]; FP7 MICROME Collaborative Project (‘Microbial genomics and bio-informatics’, contract number 222886-2). Funding for open access charge: Belgian Program on Interuniversity Attraction Poles [project P6/25 (BioMaGNet)].
Conflict of interest statement. None declared.
Supplementary Material
ACKNOWLEDGEMENTS
The collaboration between BiGRe and ENS has been stimulated by a 2-months invitation of JvH as visiting professor at Ecole Normale Supérieure.
REFERENCES
- 1.Robertson G, Hirst M, Bainbridge M, Bilenky M, Zhao Y, Zeng T, Euskirchen G, Bernier B, Varhol R, Delaney A, et al. Genome-wide profiles of STAT1 DNA association using chromatin immunoprecipitation and massively parallel sequencing. Nat. Methods. 2007;4:651–657. doi: 10.1038/nmeth1068. [DOI] [PubMed] [Google Scholar]
- 2.Johnson DS, Mortazavi A, Myers RM, Wold B. Genome-wide mapping of in vivo protein–DNA interactions. Science. 2007;316:1497–1502. doi: 10.1126/science.1141319. [DOI] [PubMed] [Google Scholar]
- 3.Boeva V, Surdez D, Guillon N, Tirode F, Fejes AP, Delattre O, Barillot E. De novo motif identification improves the accuracy of predicting transcription factor binding sites in ChIP-Seq data analysis. Nucleic Acids Res. 2010;38:e126. doi: 10.1093/nar/gkq217. [DOI] [PMC free article] [PubMed] [Google Scholar]
- 4.Machanick P, Bailey TL. MEME-ChIP: Motif analysis of large DNA datasets. Bioinformatics. 2011;27:1696–1697. doi: 10.1093/bioinformatics/btr189. [DOI] [PMC free article] [PubMed] [Google Scholar]
- 5.Bailey TL. DREME: Motif discovery in transcription factor ChIP-seq data. Bioinformatics. 2011;27:1653–1659. doi: 10.1093/bioinformatics/btr261. [DOI] [PMC free article] [PubMed] [Google Scholar]
- 6.Hu M, Yu J, Taylor JM, Chinnaiyan AM, Qin ZS. On the detection and refinement of transcription factor binding sites using ChIP-Seq data. Nucleic Acids Res. 2010;38:2154–2167. doi: 10.1093/nar/gkp1180. [DOI] [PMC free article] [PubMed] [Google Scholar]
- 7.Kulakovskiy IV, Boeva VA, Favorov AV, Makeev VJ. Deep and wide digging for binding motifs in ChIP-Seq data. Bioinformatics. 2010;26:2622–2623. doi: 10.1093/bioinformatics/btq488. [DOI] [PubMed] [Google Scholar]
- 8.van Heeringen SJ, Veenstra GJ. GimmeMotifs: a de novo motif prediction pipeline for ChIP-sequencing experiments. Bioinformatics. 2011;27:270–271. doi: 10.1093/bioinformatics/btq636. [DOI] [PMC free article] [PubMed] [Google Scholar]
- 9.Agius P, Arvey A, Chang W, Noble WS, Leslie C. High resolution models of transcription factor–DNA affinities improve in vitro and in vivo binding predictions. PLoS Comput. Biol. 2010;6:e1000916. doi: 10.1371/journal.pcbi.1000916. [DOI] [PMC free article] [PubMed] [Google Scholar]
- 10.van Helden J, Andre B, Collado-Vides J. A web site for the computational analysis of yeast regulatory sequences. Yeast. 2000;16:177–187. doi: 10.1002/(SICI)1097-0061(20000130)16:2<177::AID-YEA516>3.0.CO;2-9. [DOI] [PubMed] [Google Scholar]
- 11.Thomas-Chollier M, Sand O, Turatsinze JV, Janky R, Defrance M, Vervisch E, Brohee S, van Helden J. RSAT: regulatory sequence analysis tools. Nucleic Acids Res. 2008;36:W119–W127. doi: 10.1093/nar/gkn304. [DOI] [PMC free article] [PubMed] [Google Scholar]
- 12.Thomas-Chollier M, Defrance M, Medina-Rivera A, Sand O, Herrmann C, Thieffry D, van Helden J. RSAT 2011: regulatory Sequence Analysis Tools. Nucleic Acids Res. 2011;29:W86–W91. doi: 10.1093/nar/gkr377. [DOI] [PMC free article] [PubMed] [Google Scholar]
- 13.van Helden J, Andre B, Collado-Vides J. Extracting regulatory sites from the upstream region of yeast genes by computational analysis of oligonucleotide frequencies. J. Mol. Biol. 1998;281:827–842. doi: 10.1006/jmbi.1998.1947. [DOI] [PubMed] [Google Scholar]
- 14.van Helden J, Rios AF, Collado-Vides J. Discovering regulatory elements in non-coding sequences by analysis of spaced dyads. Nucleic Acids Res. 2000;28:1808–1818. doi: 10.1093/nar/28.8.1808. [DOI] [PMC free article] [PubMed] [Google Scholar]
- 15.van Helden J, del Olmo M, Perez-Ortin JE. Statistical analysis of yeast genomic downstream sequences reveals putative polyadenylation signals. Nucleic Acids Res. 2000;28:1000–1010. doi: 10.1093/nar/28.4.1000. [DOI] [PMC free article] [PubMed] [Google Scholar]
- 16.Portales-Casamar E, Thongjuea S, Kwon AT, Arenillas D, Zhao X, Valen E, Yusuf D, Lenhard B, Wasserman WW, Sandelin A. JASPAR 2010: the greatly expanded open-access database of transcription factor binding profiles. Nucleic Acids Res. 2010;38:D105–D110. doi: 10.1093/nar/gkp950. [DOI] [PMC free article] [PubMed] [Google Scholar]
- 17.Robasky K, Bulyk ML. UniPROBE, update 2011: expanded content and search tools in the online database of protein-binding microarray data on protein–DNA interactions. Nucleic Acids Res. 2011;39:D124–D128. doi: 10.1093/nar/gkq992. [DOI] [PMC free article] [PubMed] [Google Scholar]
- 18.Gama-Castro S, Salgado H, Peralta-Gil M, Santos-Zavaleta A, Muniz-Rascado L, Solano-Lira H, Jimenez-Jacinto V, Weiss V, Garcia-Sotelo JS, Lopez-Fuentes A, et al. RegulonDB version 7.0: Transcriptional regulation of Escherichia coli K-12 integrated within genetic sensory response units (Gensor Units) Nucleic Acids Res. 2011;39:D98–D105. doi: 10.1093/nar/gkq1110. [DOI] [PMC free article] [PubMed] [Google Scholar]
- 19.Kulakovskiy IV, Favorov AV, Makeev VJ. Motif discovery and motif finding from genome-mapped DNase footprint data. Bioinformatics. 2009;25:2318–2325. doi: 10.1093/bioinformatics/btp434. [DOI] [PubMed] [Google Scholar]
- 20.Chen X, Xu H, Yuan P, Fang F, Huss M, Vega VB, Wong E, Orlov YL, Zhang W, Jiang J, et al. Integration of external signaling pathways with the core transcriptional network in embryonic stem cells. Cell. 2008;133:1106–1117. doi: 10.1016/j.cell.2008.04.043. [DOI] [PubMed] [Google Scholar]
- 21.Langmead B, Trapnell C, Pop M, Salzberg SL. Ultrafast and memory-efficient alignment of short DNA sequences to the human genome. Genome Biol. 2009;10:R25. doi: 10.1186/gb-2009-10-3-r25. [DOI] [PMC free article] [PubMed] [Google Scholar]
- 22.Zhang Y, Liu T, Meyer CA, Eeckhoute J, Johnson DS, Bernstein BE, Nussbaum C, Myers RM, Brown M, Li W, et al. Model-based analysis of ChIP-Seq (MACS) Genome Biol. 2008;9:R137. doi: 10.1186/gb-2008-9-9-r137. [DOI] [PMC free article] [PubMed] [Google Scholar]
- 23.Salmon-Divon M, Dvinge H, Tammoja K, Bertone P. PeakAnalyzer: Genome-wide annotation of chromatin binding and modification loci. BMC Bioinformatics. 2010;11:415. doi: 10.1186/1471-2105-11-415. [DOI] [PMC free article] [PubMed] [Google Scholar]
- 24.Mason MJ, Plath K, Zhou Q. Identification of context-dependent motifs by contrasting ChIP binding data. Bioinformatics. 2010;26:2826–2832. doi: 10.1093/bioinformatics/btq546. [DOI] [PMC free article] [PubMed] [Google Scholar]
- 25.He X, Chen C-C, Hong F, Fang F, Sinha S, Ng H-H, Zhong S. A biophysical model for analysis of transcription factor interaction and binding site arrangement from genome-wide binding data. PLoS ONE. 2009;4:e8155. doi: 10.1371/journal.pone.0008155. [DOI] [PMC free article] [PubMed] [Google Scholar]
- 26.Blow MJ, McCulley DJ, Li Z, Zhang T, Akiyama JA, Holt A, Plajzer-Frick I, Shoukry M, Wright C, Chen F, et al. ChIP-Seq identification of weakly conserved heart enhancers. Nat. Genet. 2010;42:806–810. doi: 10.1038/ng.650. [DOI] [PMC free article] [PubMed] [Google Scholar]
- 27.Visel A, Blow MJ, Li Z, Zhang T, Akiyama JA, Holt A, Plajzer-Frick I, Shoukry M, Wright C, Chen F, et al. ChIP-seq accurately predicts tissue-specific activity of enhancers. Nature. 2009;457:854–858. doi: 10.1038/nature07730. [DOI] [PMC free article] [PubMed] [Google Scholar]
- 28.Duboule D. The function of Hox genes in the morphogenesis of the vertebrate limb. Ann. Genet. 1993;36:24–29. [PubMed] [Google Scholar]
- 29.Zhu Y, King BL, Parvizi B, Brunk BP, Stoeckert CJ, Jr, Quackenbush J, Richardson J, Bult CJ. Integrating computationally assembled mouse transcript sequences with the Mouse Genome Informatics (MGI) database. Genome Biol. 2003;4:R16. doi: 10.1186/gb-2003-4-2-r16. [DOI] [PMC free article] [PubMed] [Google Scholar]
- 30.Suzuki T, Kimura A, Nagai R, Horikoshi M. Regulation of interaction of the acetyltransferase region of p300 and the DNA-binding domain of Sp1 on and through DNA binding. Genes Cells. 2000;5:29–41. doi: 10.1046/j.1365-2443.2000.00302.x. [DOI] [PubMed] [Google Scholar]
- 31.Billon N, Carlisi D, Datto MB, van Grunsven LA, Watt A, Wang XF, Rudkin BB. Cooperation of Sp1 and p300 in the induction of the CDK inhibitor p21WAF1/CIP1 during NGF-mediated neuronal differentiation. Oncogene. 1999;18:2872–2882. doi: 10.1038/sj.onc.1202712. [DOI] [PubMed] [Google Scholar]
Associated Data
This section collects any data citations, data availability statements, or supplementary materials included in this article.