

Abstract
Sympatric cryptic species, characterized by low morphological differentiation, pose a challenge to understanding the role of interspecific competition in structuring ecological communities. We used traditional (morphological) and novel molecular methods of diet analysis to study the diet of two cryptic bat species that are sympatric in southern England (Plecotus austriacus and P. auritus) (Fig. 1). Using Roche FLX 454 (Roche, Basel, CH) high-throughput sequencing (HTS) and uniquely tagged generic arthropod primers, we identified 142 prey Molecular Operational Taxonomic Units (MOTUs) in the diet of the cryptic bats, 60% of which were assigned to a likely species or genus. The findings from the molecular study supported the results of microscopic analyses in showing that the diets of both species were dominated by lepidopterans. However, HTS provided a sufficiently high resolution of prey identification to determine fine-scale differences in resource use. Although both bat species appeared to have a generalist diet, eared-moths from the family Noctuidae were the main prey consumed. Interspecific niche overlap was greater than expected by chance (Ojk = 0.72, P < 0.001) due to overlap in the consumption of the more common prey species. Yet, habitat associations of nongeneralist prey species found in the diets corresponded to those of their respective bat predator (grasslands for P. austriacus, and woodland for P. auritus). Overlap in common dietary resource use combined with differential specialist prey habitat associations suggests that habitat partitioning is the primary mechanism of coexistence. The performance of HTS is discussed in relation to previous methods of molecular and morphological diet analysis. By enabling species-level identification of dietary components, the application of DNA sequencing to diet analysis allows a more comprehensive comparison of the diet of sympatric cryptic species, and therefore can be an important tool for determining fine-scale mechanisms of coexistence.
Keywords: Diet, interspecific competition, molecular scatology, next generation sequencing, Plecotus
Introduction
Interspecific competition is an important mechanism structuring ecological communities (Schoener 1983), outweighing the effect of positive mutualistic interactions (Alexandrou et al. 2011), and promoting increased speciation rates (Thierry et al. 2011). Stable coexistence in the face of interspecific competition is the result of ecological niche differentiation, whereby phenotypic character divergence promotes differential resource use, thus reducing the effect of competition for limiting resources (Chesson 2000). There is ample evidence to support both ecological character displacement (species occupying different niches in sympatry; reviewed in Dayan and Simberloff 2005) and limits to the similarity of coexisting competitors (e.g. Kingston et al. 2000). Moreover resource partitioning has been identified as a mechanism that facilitates coexistence in a variety of animal communities (reviewed in Schoener 1974). Nevertheless, some studies have shown that ecologically similar species can coexist through neutral processes that promote phenotypic character convergence rather than divergence (Leibold and McPeek 2006).
Traditional views of niche-based species coexistence are challenged by the presence of sympatric, morphologically similar, but genetically isolated, species (cryptic species) that do not appear to differ sufficiently in their morphology to allow niche differentiation (Wellborn and Cothran 2007). However, morphological similarity may not be a sufficient indication of ecological similarity, and even small differences can influence access to resources (Saunders and Barclay 1992). Cryptic species appear to be common in bats (order Chiroptera) (Clare 2011; Clare et al. 2011a), and in particular among insectivorous bats, because differences in their sensory abilities, in the form of ultrasonic echolocation calls, are not readily distinguished by humans. Moreover, echolocation gives bats an added dimension for niche separation that may be less conserved in its evolution than morphology per se (Jones 1997), and therefore may promote ecological divergence potentially leading to speciation (Kingston and Rossiter 2004). Because foraging habitat use and prey selection in insectivorous bats are closely linked to wing morphology (Aldridge and Rauthenback 1987; Norberg and Rayner 1987) and echolocation call structure (Jones and Rydell 2003), even moderate differences in these features may allow species to partition resources.
Despite their morphological similarity, sympatric cryptic bat species may show pronounced spatial segregation of primary foraging habitats. For example, partitioning of foraging habitat, in the absence of apparent differences in wing morphology (Jones 1997), was identified among the recently separated cryptic Pipistrellus species, whereby P. pygmaeus selects riparian habitats, while P. pipistrellus prefers a wide range of habitats including deciduous woodlands and pasture (Davidson–Watts et al. 2006; Nicholls and Racey 2006). Differences in echolocation call structure can facilitate niche differentiation in sympatric bat species by affecting the detection distances of prey of various sizes (Kingston and Rossiter 2004), as well as contributing to foraging performance under different levels of habitat clutter (Siemers and Schnitzler 2004). For bats foraging in the same habitat, sensory adaptations may allow access to different prey, thus reducing resource competition (Siemers and Swift 2006). However, the role of interspecific competition in driving trophic resource partitioning in bats is still debated (Husar 1976; Arlettaz et al. 1997; Schoeman and Jacobs 2011).
The advent of finer resolution methods of diet analysis may offer a clearer picture of trophic resource partitioning among coexisting species. Indeed some studies that failed to identify resource partitioning among morphologically similar bat species suggest that finer scale differences in microhabitat use or finer resolution diet analysis may reduce the extent of resource overlap (Jacobs and Barclay 2009; Schoeman and Jacobs 2011). Contrary to traditional methods of diet analysis (e.g., fecal or stomach content analysis), polymerase chain reaction (PCR) amplification and DNA sequencing of prey remains from predator fecal samples allows identification to the species level of both soft- and hard-bodied consumed prey (Symondson 2002). Despite the high potential of DNA sequencing to aid identification at finer resolution than the ordinal level for important insect prey, such as Lepidoptera (Whitaker et al. 2009), this technique has only recently been applied to study the diet of insectivorous bats. However, molecular diet studies to date have focused on individual species (Clare et al. 2009, 2011b; Zeale et al. 2011) or on sympatric species that are not close relatives (Bohmann et al. 2011), rather than on cryptic species, where finer resolution of prey types may be fundamental to decipher mechanisms of resource partitioning.
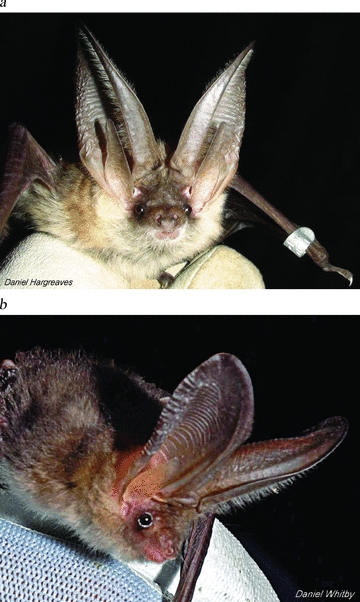
We applied traditional (morphological) and novel next generation sequencing approaches to study the diet of two sympatric cryptic sister species in southern England, the gray and brown long-eared bats, Plecotus austriacus and P. auritus. Plecotus austriacus (Fig. 1) is one of the rarest mammals in Britain, with a prebreeding population estimated at 1000 individuals, and is restricted to southern England, while P. auritus is more common and widespread throughout the British Isles (Harris et al. 1995). The long-eared bat genus contains at least 19 distinct cryptic species, nearly all of which were only identified in the past decade based on molecular studies (Spitzenberger et al. 2006; Mayer et al. 2007). Though recognized as separate species in the 1960s (Corbet 1964), P. austriacus and P. auritus show high overlap in most morphological characteristics (Ashrafi et al. 2010), including their wing morphology (Sevcik 2003) and echolocation call parameters (Russo and Jones 2002). Significant differences in the shape of the baculum (Dietz et al. 2009) may partly account for reproductive isolation between these cryptic species (Patterson and Thaeler 1982). The two bats are sympatric in southern England and parts of Europe. However, while P. austriacus is primarily a southern European species, P. auritus is abundant in central and northern Europe, but confined to mountainous areas with cooler climates in southern Europe (Spitzenberger et al. 2006). Similarities in morphology and echolocation calls suggest that these species share several niche dimensions, and therefore studying their patterns of resource use may reveal important fine-scale mechanisms of coexistence (Tokeshi 1999).
Figure 1.
(a) The grey long-eared bat, Plecotus austriacus, and (b) the brown long-eared bat, Plecotus auritus.
Our objectives were to assess the ability of PCR-coupled next generation (Roche FLX, Roche, Basel, CH) sequencing to identify fine-scale differences in trophic ecology from fecal samples, and compare the performance of this technique with previous molecular (PCR-coupled cloning and fragment targeting) and nongenetic methods of diet analysis. We hypothesized that despite showing few phenotypic differences, cryptic species are able to coexist due to differences in their ecology. Therefore, we predicted that (1) coexistence among P. austriacus and P. auritus is mediated via fine-scale mechanisms of resource partitioning; (2) the extent of dietary niche overlap and diet selectivity are affected by variation in prey availability; and (3) the diet of the two bat species corresponds to patterns of foraging habitat selection.
Methods
Sample collection
We collected fecal samples directly from 30 P. austriacus (representing approximately 3% of the prebreeding British population [Harris et al. 1995]) and 30 P. auritus bats caught at sites in southern England (Devon, Isle of Wight, and Somerset). The P. austriacus samples were collected between April 2009 and October 2010, and the P. auritus samples between June and October 2010 (Supporting Information 1). Bats were caught under license either in roosts, bat boxes, or in woodlands, and held in separate holding bags for a maximum of 30 min. Feces were immediately stored in 100% ethanol in individual tubes, and frozen within 12 h of collection. For the morphological diet analysis, feces were collected once a month between April and October 2009 from seed collection trays placed on the floor of a P. austriacus maternity colony in Devon (50°3′N, 3°3′W).
DNA extraction and PCR amplification
DNA was extracted from feces using the QIAamp DNA stool extraction kit (Qiagen, Valencia, CA) following the modifications described in Zeale et al. (2011). A short (157 bp excluding primer) region of the cytochrome c oxidase subunit I (COI) mitochondrial DNA gene was subsequently PCR amplified from each DNA extract. We used generic arthropod primers with a wide taxonomic coverage that includes 13 insect and arachnid orders commonly found in insectivorous bat diets (ZBJ-ArtF1c and ZBJ-ArtR2c; Zeale et al. 2011). The primers were modified into 5′-tagged “fusion primers,” in order to enable Roche FLX sequencing of pools of the amplicons, and subsequent bioinformatic sorting into original PCR (Binladen et al. 2007). Post-PCR amplification, the amplicons were purified, quantified by real-time PCR (qPCR) (Meyer et al. 2007), and then pooled by species at equimolar ratio. Each pool of amplicons was deep sequenced on one-eighth of a Roche GS-FLX platform using Titanium sequencing chemistry. PCR reaction conditions, cycle program, and sequencing procedures followed Bohmann et al. (2011) and are provided in Supporting Information 2.
Analysis of FLX sequencing data
We used a conservative approach discarding sequences that did not match primers exactly, fragments that were too short, and all singleton sequences (unique sequences that were only present once) to minimize the effect of sequencing errors. Sequences were aligned using the ClustalW algorithm in BioEdit (T. Hall, http://www.mbio.ncsu.edu/bioedit/bioedit.html), and the nucleotide and amino acid alignment was checked by hand with reference to known arthropod sequences. All sequences were collapsed into Molecular Operational Taxonomic Units (MOTUs), approximating species, using the software jMOTU (Jones et al. 2011, https://www.nematodes.org/bioinformatics/jMOTU/). This approach is useful for describing niche breadth and overlap when identification of sequences is limited by an incomplete reference dataset (Clare et al. 2011b). The MOTU assignment was tested at a series of thresholds corresponding to 0–10% sequence divergence and the resulting assignments were graphed. For further analysis, we selected a threshold (2%) based on the infliction point of the graph of distribution of MOTUs recovered, that is, the percent of sequence differences where the graph reached an asymptote and new MOTUs were not being recognized but existing MOTUs had not been collapsed. This value is biologically meaningful and is well within expected variation at the species level in surveyed insects (see Clare et al. 2011b for a discussion of MOTU divergences). Representative sequences from each MOTU (the three most common sequences when identical sequences are collapsed into haplotypes) were compared to reference sequences using the Barcode of Life Data System (BOLD, http://www.barcodinglife.org) identification engine. We used a conservative threshold of >98.5% sequence similarity for species identification based on mean sequence divergence values estimated by Zeale et al. (2011) for the amplified COI region.
Phylogenetic approaches employed by Clare et al. (2009, 2011b) to compliment distance-based species identification were not possible due to the short length of the sequences (157 bp). Moreover, short sequence length meant that some MOTUs gave >98.5% match to more than one species, some of which belonged to different genera or even families. To overcome these obstacles, we used the following criteria to create three identification confidence levels:
Solid match (>98.5%) to one species—species-level assignment, or match (>98.5%) to more than one species, all belonging to the same genus—genus-level assignment.
Match (>98.5%) to more than one species belonging to different genera, only one of which was a U.K. species—species-level assignment to U.K. species.
Match (>98%) to several species of different genera within the same family or to reference sequences only identified to the family-level—family level assignment.
Diet analysis
The diet of P. austriacus and P. auritus was quantified based on the percent frequency of occurrence (%FO) of prey orders (the number of feces containing an order divided by the total occurrences of all orders). All other analyses were carried out at the MOTU (species) level.
The extent of dietary specialization and diversity was determined at the MOTU level using the standardized Levins’ measure of niche breadth (Equation 1) and Shannon's diversity index (Equation 2).
 |
(1) |
where B is Levins's measure, pi is the proportion of fecal samples in which MOTU i was found, and n is the number of possible MOTUs in the diet.
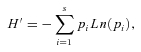 |
(2) |
where pi is the proportion of fecal samples in which MOTU i was found.
We used Pianka's (1973) measure of niche overlap (Equation 3) to quantify dietary resource overlap at the MOTU level between the two bat species and within each bat species between the two main collection sites (Devon and Isle of Wight). Null models were used to test whether the extent of niche overlap is greater than expected by chance, and determine the effect of season and sex on dietary resource use. We generate 10,000 simulated matrices of randomized MOTU diet composition, using the software EcoSim (version 7; http://grayentsminger.com/ecosim.htm) with Randomisation Algorithm 3, and compared observed and randomly simulated extents of niche overlap. Bonferroni corrections were applied to retain significance value at P < 0.05, resulting in significance level set at P < 0.017.
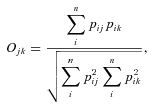 |
(3) |
where Pij is the proportion that resource i is of the total resources used by species j; Pik is the proportion that resource i is of the total resources used by species k; and n is the total number of resource states (total number of MOTUs).
Dietary prey composition was compared within each bat species between seasons using nonparametric tests. We compared the proportion of Lepidoptera MOTUs within each fecal sample between the spring (April–May), summer (June–August), and autumn (Sep–Oct) for P. austriacus, and between the summer and autumn for P. auritus. Statistical analyses were carried out in PASW Statistics 18.
Arthropod prey habitat associations and presence in southern England were determined based on previously published information (Heath and Emmet 1983; Waring et al. 2003; Chinery 2005; Manley 2008; Chandler 2010). Arthropod species commonly found in a range of habitat types were classified as habitat generalists, while species that were exclusively associated with either grassland and open habitats or woodland habitats were classified as grassland and woodland specialists, respectively.
Morphological diet analysis
Primer generality
In order to test for primer amplification biases against certain prey orders, we used traditional microscopic fecal analysis methods (Whitaker et al. 2009) to determine prey composition in all fecal samples analyzed genetically. We looked for the presence of prey orders that were absent from the molecular study and for differences in prey order composition in terms of percent frequency of occurrence (%FO) in diet.
Traditional morphological diet analysis
We compared the results of the high-throughput sequencing (HTS) analysis to a previous microscopic fecal analysis study of the diet of P. auritus from Somerset, southern England (Hollyfield 1993). However, because there were no previous studies of the diet of P. austriacus in Britain, we analyzed feces collected from a maternity colony in Devon, using traditional microscopic fecal analysis methods (Shiel et al. 1997; Whitaker et al. 2009). We randomly selected 30 droppings for analysis from each monthly collection, and teased them apart under a dissection microscope, picking out all recognizable arthropod fragments for identification with reference slides and identification guides (Shiel et al. 1997; M. James pers. comm.). The diets of P. austriacus and P. auritus were quantified based on percent frequency of occurrence of prey orders (%FO).
Results
Of the 30 fecal samples collected for each bat species, 28 of the P. austriacus (93%) and 24 of the P. auritus extractions (80%) produced PCR amplicons, and were therefore included in subsequent analyses. The sequencing run generated 100,508 and 73,606 sequences containing correctly barcoded primers for the P. austriacus and P. auritus samples, respectively. Subsequent filtering of the data to return only high-quality, identifiable arthropod sequences and removal of singleton sequences reduced these to 91,476 and 63,715, respectively.
The high-quality arthropod sequences were collapsed into 142 MOTUs (using a 2% sequence divergence threshold), belonging to three species of arachnids, two species of Crustacea, and at least six orders of insects. We identified 60% of the MOTUs to the likely species or genus (69% were solid matches—confidence level 1, while 31% matched more than one species, only one of which was a U.K. species—confidence level 2), and 16% to the family level (Table 1). The remaining MOTUs (24%) could not be identified confidently based on our classification scheme and were therefore left as unknown. In Lepidoptera, where the reference dataset is relatively complete, 59 discrete MOTUs were identified as 52 separate species; suggesting that using current taxonomic classification in BOLD, MOTUs slightly overestimated species richness (by 12%).
Table 1.
List of arthropod prey identified in the feces of 28 Plecotus austriacus and 24 P. auritus from southern England, including the number of individuals from each bat species that consumed the prey taxa. Confidence levels are based on the BOLD identification system, whereby confidence level 1 = solid match to one species or genus (>98.5%); level 2 = match to more than one species (>98.5%), only one of which was a U.K. species; and level 3 = match > 98% to several species of different genera, or to reference sequences only identified to the family level
| Order | Family | Species | P. austriacus | P. auritus | Confidence level |
|---|---|---|---|---|---|
| Lepidoptera | Aractiidae | Unknown | 2 | 0 | 3 |
| Diaphora mendica | 1 | 0 | 1 | ||
| Seirarctia sp. | 1 | 0 | 1 | ||
| Spilosoma luteum | 3 | 0 | 1 | ||
| Crambidae | Agriphila tristella | 2 | 0 | 1 | |
| Chrysoteuchia culmella | 2 | 0 | 2 | ||
| Crambus perlella | 1 | 0 | 2 | ||
| Elachistidae | Depressaria daucella | 1 | 0 | 1 | |
| Semioscopis sp. | 2 | 0 | 1 | ||
| Gelechiidae | Carpatolechia decorella | 1 | 2 | 1 | |
| Geometridae | Gymnoscelis rufifasciata | 1 | 0 | 2 | |
| Hepialidae | Hepialus sp. | 6 | 2 | 2 | |
| Hepialus sylvina | 6 | 3 | 1 | ||
| Noctuidae | Unknown | 6 | 3 | 3 | |
| Acronicta alni | 0 | 1 | 1 | ||
| Agrochola litura | 0 | 1 | 1 | ||
| Agrochola lota | 0 | 1 | 1 | ||
| Agrochola lychnidis | 0 | 1 | 2 | ||
| Agrochola macilenta | 0 | 1 | 1 | ||
| Agrotis exclamationis | 4 | 2 | 1 | ||
| Agrotis ipsilon | 2 | 0 | 2 | ||
| Agrotis segetum | 1 | 0 | 1 | ||
| Agrotis puta | 1 | 0 | 1 | ||
| Allophyes oxyacanthae | 1 | 2 | 2 | ||
| Apamea crenata | 0 | 1 | 1 | ||
| Apamea epomidion | 0 | 1 | 1 | ||
| Apamea monoglypha | 6 | 0 | 2 | ||
| Apamea sp. | 1 | 0 | 1 | ||
| Autographa gamma | 11 | 2 | 1 | ||
| Charanyca trigrammica | 1 | 0 | 2 | ||
| Conistra sp. | 0 | 1 | 2 | ||
| Diarsia sp. | 0 | 2 | 2 | ||
| Hoplodrina ambigua | 1 | 0 | 1 | ||
| Hydraecia micacea | 1 | 0 | 2 | ||
| Hydraecia sp. | 1 | 0 | 1 | ||
| Hypena proboscidalis | 0 | 1 | 1 | ||
| Lithophane hepatica | 1 | 0 | 2 | ||
| Mythimna albipuncta | 2 | 0 | 1 | ||
| Mythimna pallens | 0 | 1 | 2 | ||
| Noctua comes | 2 | 0 | 2 | ||
| Noctua pronuba | 19 | 13 | 1 | ||
| Noctua sp. | 1 | 1 | 2 | ||
| Ochropleura sp. | 0 | 1 | 2 | ||
| Oligia sp. | 0 | 1 | 1 | ||
| Omphaloscelis lunosa | 1 | 1 | 1 | ||
| Orthosia gothica | 1 | 0 | 2 | ||
| Phlogophora meticulosa | 2 | 0 | 1 | ||
| Scoliopteryx libatrix | 1 | 0 | 1 | ||
| Tholera cespitis | 0 | 1 | 1 | ||
| Tholera decimalis | 2 | 0 | 1 | ||
| Xestia xanthographa | 2 | 6 | 2 | ||
| Oecophoridae | Diurnea fagella | 0 | 1 | 2 | |
| Endrosis sarcitrella | 0 | 1 | 2 | ||
| Diptera | Anisopodidae | Unknown | 0 | 1 | 3 |
| Calliphoridae | Unknown | 0 | 1 | 3 | |
| Pollenia sp. | 0 | 1 | 2 | ||
| Muscidae | Unknown | 0 | 2 | 3 | |
| Eudasyphora cyanella | 1 | 2 | 1 | ||
| Eudasyphora sp. | 0 | 1 | 1 | ||
| Helina impuncta | 1 | 0 | 1 | ||
| Morellia simplex | 0 | 1 | 1 | ||
| Phaonia subventa | 1 | 3 | 1 | ||
| Polietes lardarius | 0 | 3 | 1 | ||
| Scathophagidae | Scathophaga stercoraria | 1 | 1 | 1 | |
| Syrphidae | Platycheirus sp. | 0 | 2 | 2 | |
| Tachinidae | Leskia sp. | 1 | 4 | 1 | |
| Tipulidae | Unknown | 1 | 0 | 3 | |
| Tipula oleracea | 8 | 1 | 1 | ||
| Tipula sp. | 1 | 0 | 1 | ||
| Neuroptera | Chrysopidae | Unknown | 2 | 0 | 3 |
| Coleoptera | Dermestidae | Anthrenus fuscus | 0 | 1 | 1 |
| Hemiptera | Miridae | Unknown | 3 | 0 | 3 |
| Phytocoris tiliae | 1 | 0 | 1 | ||
| Trichoptera | Limnephilidae | Stenophylax sp. | 1 | 0 | 2 |
| Isopoda | Porcellionidae | Porcellio scaber | 1 | 1 | 1 |
| Porcellio sp. | 0 | 1 | 1 | ||
| Araneae | Anyphaenidae | Unknown | 0 | 1 | 3 |
| Anyphaena accentuata | 0 | 1 | 1 | ||
| Tetragnathidae | Metellina segmentata | 0 | 1 | 1 |
The majority of MOTUs (80%) were consumed by a single individual, though the most common prey species in the diet of both species, Noctua pronuba, was consumed by 19 P. austriacus and 13 P. auritus bats. Number of prey taxa (MOTUs) per dropping ranged between 1 and 17 (means ± SD: P. austriacus, 5.3 ± 4; P. auritus, 4.2 ± 3).
Diet composition and specialization
The diet of P. austriacus contained 90 MOTUs, while that of P. auritus contained 68. Analysis carried out at the MOTU level showed that both bat species had relatively narrow niches (Levins’ measure: BA = 0.21, for both species) but high dietary diversity (Shannon diversity index: P. austriacus H = 4.1, P. auritus H = 3.9). We identified six prey orders in the diet of P. austriacus (Lepidoptera, Diptera, Neuroptera, Hemiptera, Trichoptera, and Isopoda) and five orders in the diet of P. auritus (Lepidoptera, Diptera, Coleoptera, Araneae, and Isopoda). The diet of both bat species comprised primarily of prey from the orders Lepidoptera and Diptera, with Lepidoptera accounting for 66.7% of the diet of P. austriacus and 64.7% of the diet of P. auritus (Fig. 2). The same prey orders were identified at similar proportions in the morphological analysis of prey remains in genetically analyzed fecal samples, with the exception of Coleoptera, which was only found in the morphological analysis of the P. austriacus samples. However, it is important to note that Coleoptera was only identified in one P. austriacus fecal sample, and comprised less than 5% of the volume of that sample.
Figure 2.
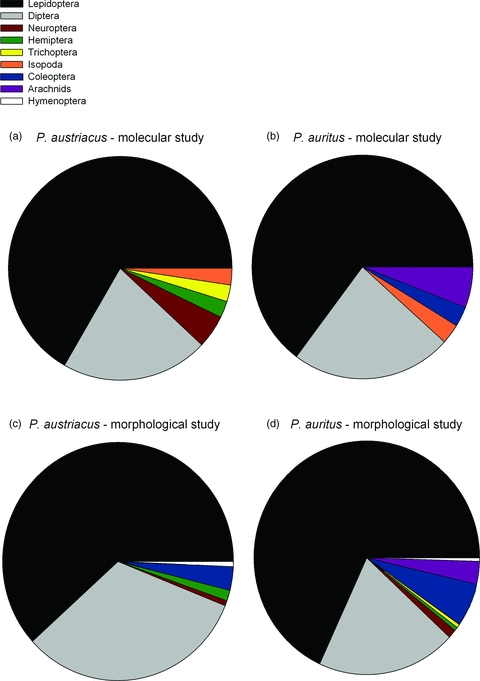
Pie charts showing the diet composition at the ordinal level of the two bat species in southern England based on molecular ([A] Plecotus austriacus [N = 28]; [B] P. auritus [N = 24]) and morphological diet analyses ([C] P. austriacus from the Devon colony [N = 170]; [D] P. auritus adapted from Hollyfield 1993 [N = 240]). The proportion of prey orders in the diet is presented as percent frequency of occurrence (%FO).
The majority of the lepidopteran species identified in the diet of both bat species were eared-moths of the family Noctuidae (proportion of Lepidoptera MOTUs: P. ausitracus 71%, P. auritus 83.3%; Fig. 3). Species of the family Tipulidae were the most common dipterans identified in the diet of P. austriacus (76%), while species of the dipteran family Muscidae were more common in the diet of P. auritus (65%). The most common prey species in the diet of P. austriacus were N. pronuba, Autographa gamma, Hepialus sp., Apamea monoglypha, and Tipula oleracea, while the most common prey species in the diet of P. auritus were N. pronuba, Xestia xanthographa, Hepialus sylvina, and Polietes lardarius (Table 1).
Figure 3.
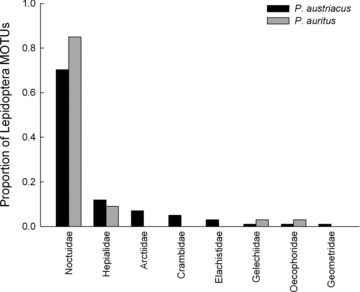
The proportion of Lepidoptera families identified in the diet of P. austriacus (black bars, N = 28) and P. auritus (gray bars, N = 24) in southern England.
The diet composition at the ordinal level of both bat species differed between the seasons. Plecotus austriacus consumed higher proportion of Lepidoptera in summer than in spring (Kruskal–Wallis test: H = 7.72, N = 14, 8, P = 0.002; Fig. 4), while P. auritus consumed more Lepidoptera in summer than in autumn (Mann–Whitney test: U = 33, N = 10, 14, P = 0.014; Supporting Information 3).
Figure 4.
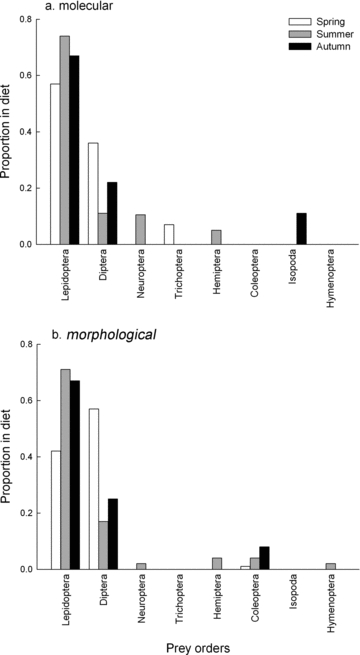
Seasonal variation in the proportion of prey orders identified in the diet of P. austriacus in southern England based on (A) the molecular study (Spring: N = 8, Summer: N = 14, Autumn: N = 6) and (B) the morphological study (Spring: N = 60, Summer: N = 80, Autumn: N = 30). Diet composition is presented as percent frequency of occurrence (%FO).
Dietary niche overlap
We found little evidence for dietary resource partitioning among these cryptic bat species. Interspecific niche overlap, measured based on MOTUs, was significantly higher than expected by chance (Ojk = 0.72, P < 0.001) and higher than intraspecific niche overlap (P. austriacus: Ojk = 0.63, P = 0.009; P. auritus: Ojk = 0.31, not significant) (Fig. 5). Niche overlap between bat species was greater in the summer (Ojk = 0.62, P = 0.012) than the autumn (Ojk = 0.48, not significant).
Figure 5.
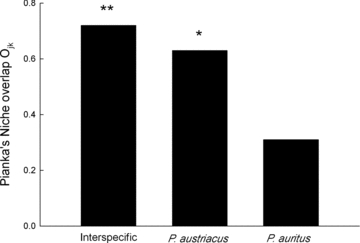
Extent of between (interspecific) and within species niche overlap among P. austriacus and P. auritus in southern England based on Pianka's measure of niche overlap, including the significance of niche overlap relative to random simulations (**P < 0.001; *P < 0.01). Within species niche overlap was tested by comparing the diet of Devon and Isle of Wight colonies separately for each bat species (P. austriacus: Devon N = 19, Isle of Wight N = 9; P. auritus: N = 10, 7).
Prey habitat associations
The majority of the prey MOTUs identified to the species level were habitat generalists. Generalist prey species tended to be consumed by both bat species and formed the majority of their diet (P. austriacus 65%, P. auritus 68%). Of the 25 prey MOTUs with specific habitat associations, the majority of species that the literature considered as found exclusively in woodlands (67%) were consumed by P. auritus, while the majority of species associated with more open grassland habitats (75%) were consumed by P. austriacus. Patterns of prey selection by habitat were not random (Chi square: χ2 = 13.1, df = 1, P < 0.01).
Concordance between morphological and molecular analysis
A morphological analysis of 170 P. austriacus fecal samples resulted in the identification of six prey orders, the most common of which was Lepidoptera (62%), followed by Diptera (32%). The morphological analysis identified two prey orders that were not recorded in the molecular diet analysis, Coleoptera and Hymenoptera, but instead did not identify any Trichoptera or Isopoda (Fig. 2). Nevertheless, differences in the proportion of prey orders were not statistically significant (Paired t-tests, Arcsin transformation: P = 0.98). Similar to the results of the molecular diet analysis, the proportion of Lepidoptera in the diet differed between the study seasons, being significantly lower in spring (Kruskal–Wallis test with Arcsin transformation: H = 47.7, df = 2, P < 0.001), while the proportion of Diptera was highest in the spring (Fig. 4).
A comparison with a previous morphological study of the diet of P. auritus (data adapted from Hollyfield 1993, N = 240) showed similar proportions of Lepidoptera (68%) and Diptera (20%) but higher proportions of Coleoptera (6%) than those identified in our molecular study (Fig. 2). The morphological analysis revealed four additional prey orders absent from our study, Neuroptera, Trichoptera, Hymenoptera, and Plecoptera, though all contributed together to less than 1.6% of the diet. As in the diet of P. austriacus, there were no significant differences in the results of the molecular and microscopic diet analysis (P = 0.59). Niche overlap between the diet of P. austriacus and P. auritus at the ordinal level, based on the result of the morphological diet studies, was very high and significant (Ojk = 0.95, P = 0.01).
Discussion
Use of high-throughput DNA sequencing to study interspecific interactions
High-throughput DNA sequencing technology has the potential to increase the scope of dietary studies by revealing patterns of resource partitioning among competing species with a level of detail not previously possible (Valentini et al. 2009a). This study is the first application of molecular techniques to study interspecific competition between sympatric cryptic species that are expected to show high dietary overlap due to strong morphological similarities (Findley and Black 1983). Unlike previous DNA sequencing techniques, which relied on either cloning (e.g., Deagle et al. 2005; Zeale et al. 2011) or the selection of prey fragments (Clare et al. 2009, 2011b), high-throughput DNA sequencing exploits entire samples and does not rely on subsampling, and therefore even very rare dietary items can potentially be detected (Deagle et al. 2009). Moreover, the use of uniquely tagged primers (Binladen et al. 2007) makes HTS more economical by enabling the pooling of many samples (up to 30 fecal samples per sequencing lane in our study) together while retaining the ability to ascribe prey sequences to an individual bat consumer, thus allowing the identification of seasonal and sexual dietary and niche overlap patterns. Yet, due to differences in primer binding, prey digestibility, and amount of DNA in prey tissue, neither method of molecular diet analysis to date can provide an accurate quantitative measure of diet composition within any one sample (Sipos et al. 2007; Deagle et al. 2010).
The number of potential prey items (MOTUs) identified in the diet of the two bat species in our study (P. austriacus [90], P. auritus [68]) did not exceed those identified in previous molecular studies of the diet of insectivorous bats (Clare et al. 2009—127 prey species in the diet of Lasiurus borealis; Zeale 2011—89 prey species in Barbastella barbastellus). However, the number of MOTUs per fecal sample in our study was much higher (we identified a maximum of 17 prey MOTUs per dropping in P. austriacus and 16 in P. auritus, versus a maximum of seven and nine prey species in Clare et al. (2009) and Zeale (2011), respectively), suggesting that HTS has greater potential to reveal rare dietary components and species with less visible remains in the feces.
The application of molecular techniques did not result in the identification of more lepidopteran prey species than previous studies of culled prey remains. Bauerova (1982) recorded 140 species of Lepidoptera in the diet of P. austriacus in central Europe, while Robinson (1990) found 34 species of Lepidoptera in the diet of P. auritus in England. However, because DNA sequencing techniques are less likely to be biased toward large hard-bodied prey (Whitaker et al. 2009), we were able to successfully record a variety of smaller and softer bodied prey items of orders overlooked in previous studies.
Strong overall agreement between the diet composition and seasonal patterns of diet composition of the two bat species identified in our HTS study and our own and previous (Hollyfield [1993] for P. auritus) morphological diet studies supports the validity of the molecular diet composition estimations at the ordinal level. Moreover, the fact that similar results were obtained from morphological studies carried out on >170 fecal samples suggests that our sample size was sufficient for representing differences in the diets of the two bat species.
The short sequence length (157 bp) and lack of complete overlap between the coverage of the primers used in our study and available COI reference sequences in BOLD (only ∼130-bp overlap) meant that not all MOTUs could be identified to the species level, and we were not able to use phylogenetic trees to confirm identification. In addition, many of the sequences showed 100% match to more than one species distributed globally, some of which belonged to different genera, thus forcing us to create a three-tiered confidence system and to identify some species based on whether they are found in the United Kingdom. Nevertheless, because a high proportion of prey DNA fragments recovered from feces are degraded and relatively short (Deagle et al. 2006), short amplicons may provide a more accurate estimate of diet composition, including also prey of higher digestibility, and are more likely to identify rare dietary components. As such, short amplicons can overcome problems encountered by Clare et al. (2011b) of low amplification success and high contamination by nonprey DNA. The source material may thus dictate the choice of primer length, a trade-off between length of amplicon for identification and the impact of DNA degradation.
As suggested by Zeale et al. (2011), the primers successfully amplified DNA from a wide range of arthropod orders, including a crustacean order (Isopoda) never before recorded in the diets of the two bat species. Zeale et al. (2011) fed an individual P. auritus an experimentally manipulated diet of Diptera, Coleoptera, and Lepidoptera, and found close agreement between items recorded in the diet by molecular analysis and the food items fed to the bat 6–24 h previously, suggesting that the primers do not appear to suffer from significant amplification biases. Microscopic analysis confirmed the diet composition results concluded from genetic data. Although previous morphological studies found higher proportions of Coleoptera in the diet of both bat species, our microscopic analysis of genetically analyzed fecal samples confirmed the low proportion of Coleoptera in our samples and the absence of other prey orders. Hence, the primers appear to provide good coverage of the main prey orders commonly found in the diet of insectivorous bats.
Molecular approaches were able to overcome many of the biases associated with traditional bat diet analysis techniques (reviewed in Whitaker et al. 2009), while providing an accurate estimate of diet composition and more fine-scale extent of niche overlap (see Table 2 for comparison of the performance of the various diet analysis methods). Yet, molecular diet analysis is still constrained by an incomplete reference sequences database, though this problem was at least partly overcome in our study through the use of MOTUs as a surrogate for prey species identification. High correspondence between MOTUs and lepidopteran species, for which the BOLD reference dataset is relatively complete, suggests that MOTUs are an effective method of diet assessment. However, our results suggest that they may overestimate prey species richness by 12% due to the proportion of repeated species identification in our study. This overestimation can be attributed to intraspecific polymorphism in the amplified region (Valentini et al. 2009b), though it can also be an artifact of the incomplete reference dataset or taxonomic ambiguity among some prey species.
Table 2.
Comparison of the strength and weaknesses of available diet analysis techniques
| Molecular techniques | Traditional methods | ||||
|---|---|---|---|---|---|
| High-throughput sequencing (HTS) | Cloning (Zeale et al. 2011) | Fragments (Clare et al. 2011b) | Morphological—feces/stomach | Culled prey remains | |
| Diet resolution | High: species level constrained by reference sequences database (can be mediated by MOTU) | High: species level constrained by reference sequences database (can be mediated by MOTU) | High: species level constrained by reference sequences database (can be mediated by MOTU) | Low: family order | High: species order but depends on taxa |
| Diet coverage | Better representation of the DNA extracted, but bias from primer binding biases, and relative DNA abundance of prey | Limited by the selected number of clones. Bias toward free floating DNA, DNA abundance, and primer bias | Selected fragments. Bias toward prey of low digestibility or fragment selection method | Greater bias toward hard-bodied prey of low digestibility | Bias toward large prey that requires culling |
| Diet quantification | Number of species/ MOTUs, no within samples quantification | Number of species/ MOTUs, no within samples quantification | Number of species/ MOTUs, no within samples quantification | Number of prey taxa and percent volume | Number of prey taxa and density |
| Rare dietary components | High potential to identify rare prey—high proportion of DNA variance sequenced | Selection of clones for sequencing reduces the chance of identifying rare prey | Potential of identification depends on number of fragments sequenced from each dropping (costs) | High potential to identify hard-bodied rare prey, but low potential to recover rare soft prey | Rare prey identified only if require culling |
| Accuracy | Does not require taxonomists to obtain accurate results, lower analyzer bias | Does not require taxonomists to obtain accurate results, lower analyzer bias | Does not require taxonomists to obtain accurate results, lower analyzer bias | Accuracy requires significant entomological training on the part of the identifier | Accuracy requires entomological training on the part of the identifier |
| Costs | Less limited by the amount of prey sequences or droppings per sequencing run. Lower cost per sequence but high initial costs and needs specialized facilities | Expensive cloning process, but less specialized facilities | Depends on number of fragments sequenced—each fragment requires separate sequencing. Less specialized facilities. | Very low—minimal consumables | Very low—minimal consumables |
| Applicability across feeding groups | High relevance across taxa, including herbivores | High relevance across taxa, including herbivores | Mainly relevant for predators and seed disperser | Mainly relevant for predators | Only relevant for predators that use feeding perches |
Trophic ecology relative to resource availability
Insectivorous bats are sometimes perceived as opportunistic foragers (Kunz 1974), consuming prey based on their availability both in the environment (Swift et al. 1985) and to the bat itself, given the constraints of its sensory and flight abilities (Fenton 1990; Siemers and Schnitzler 2004). Clare et al. (2011b) shows that the same predator can be regarded as a generalist, based on the number of prey MOTUs identified in the diet, and as a specialist when the diet is considered phylogenetically, if all the prey species identified in the diet belong to the same order. In our study, diet selectivity at the ordinal, and even family level, appears to be high. Lepidoptera, and in particular eared-moths of the family Noctuidae, were the main prey consumed by both bats. In contrast, when the diet is considered at the MOTU or species level, P. austriacus and P. auritus appear to have a generalist diet, including a variety of prey items, most of which were often only consumed by a single individual (although if more samples could be obtained more individuals may have consumed these items). Diet generality is reinforced by the fact that all prey MOTUs identified to the species level were common and widespread in southern England, and were consumed by the bats when at the peak of their adult-form activity (Heath and Emmet 1983; Waring et al. 2003).
The larger size and potentially high energetic value of Lepidoptera makes them an important component of the diet of many insectivorous bat species (e.g., Vaughan 1997; Bogdanowicz et al. 1999). Based on a small sample size, we found a trend in the diet of P. austriacus and P. auritus to shift from a diet dominated by Lepidoptera in summer toward the consumption of high proportions of Diptera during spring and autumn, when Lepidoptera availability is reduced (Jones 1990). This seasonal trend of dietary shift highlights the preferential consumption of Lepidoptera and the tendency of P. austriacus and P. auritus to concentrate on high-quality prey at times of high energetic demands (Kurta et al. 1989; McLean and Speakman 1999, for P. auritus).
Many moths have tympanal organs that enable them to detect the echolocation calls of approaching bats and initiate behavioral responses to evade predation. They are particularly sensitive to relatively high-intensity echolocation calls between 20 and 60 kHz (Rydell et al. 1995; Miller and Surlykke 2001). Consequently, the proportion of Lepidoptera is higher in the diet of bats that either produce echolocation calls above or below these frequencies (Bogdanowicz et al. 1999), or produce low-intensity echolocation calls when approaching prey (Goerlitz et al. 2010), or listen to prey-generated sounds to detect prey (Faure and Barclay 1992). High proportions of Lepidoptera in the diets of P. austriacus and P. auritus have been attributed to the latter two strategies (Rydell et al. 1995) due to the bats’ low-intensity echolocation calls, long ears, and the ability of P. auritus to glean prey from surfaces without producing echolocation calls (Coles et al. 1989; Anderson and Racey 1991). However, P. austriacus appears to hunt mainly by aerial hawking rather than gleaning (Bauerova 1982) and the use of passive listening by this species is yet to be confirmed (Swift 1998).
Mechanisms of coexistence in cryptic bat species
Although dietary partitioning is regarded as a principal mechanism for resource partitioning in animal communities (e.g., Schoener 1974; Saunders and Barclay 1992, for bats), it does not appear to play an important role in facilitating coexistence among sympatric P. austriacus and P. auritus. High similarity in both morphology (Ashrafi et al. 2010) and echolocation call characteristics (Russo and Jones 2002) suggests that the two species may not differ sufficiently in their aerodynamic or sensory abilities to have access to different prey (Siemers and Schnitzler 2004). Significant dietary overlap even when prey resources were limiting led Schoeman and Jacobs (2011) to conclude that competition does not structure the trophic niches of bat species, although they admit that greater differences in diet may be apparent when diets are quantified at finer resolution than at the ordinal level. Indeed finer resolution of dietary composition revealed the importance of the partitioning of minor prey items in reducing interspecific competition among coral reef fish, despite high overlap in the consumption of major prey items (Nagelkerken et al. 2009). Similarly, high dietary overlap in our study was primarily the result of the sharing of common prey items between the two cryptic bat species, while rare dietary items were generally consumed by a single species (Table 1).
We found that interspecific prey resource overlap was higher than intraspecific overlap, suggesting that individual P. auritus bats, in particular, are more likely to consume the same prey items as individuals from their sibling species, P. austriacus, than members of their own species. Greater levels of intraspecific dietary partitioning may be the result of higher intraspecific than interspecific prey resource competition because of differences in foraging habitat use. While P. austriacus preferentially forages in more open habitats, such as unimproved grasslands, or at the edge of riparian areas and woodlands (Razgour et al. 2011), P. auritus forages primarily in deciduous woodland (Entwistle et al. 1996). In this case, apparent resource partitioning may be less of an effect of competition for limited food resources than a pattern that results from habitat partitioning. The majority of grassland-only prey species, such as the moths Agriphila tristella, Chrysoteuchia culmella, and the crane fly Tholera decimalis, were consumed by P. austriacus, while woodland-only moth species, including A. epomidion and Acronicta alni, were consumed by P. auritus. Generalist prey species, such as N. pronuba, the most common prey item in the diet of both bat species, tended to be consumed equally by both species, hence resulting in the observed high dietary overlap. Other cryptic Myotis and Pipistrellus bat species show similar patterns of foraging habitat segregation mirrored by prey habitat associations (Arlettaz 1999; Davidson–Watts et al. 2006), though in both cases dietary partitioning was significant despite the coarse study resolution (Arlettaz et al. 1997; Barlow 1997).
The diet of the two cryptic bat species tended to only overlapped in summer, when the availability of Lepidoptera, the preferred prey resource, peaks in southern England (Jones 1990), suggesting that dietary resource partitioning is greatest in autumn, when prey resources are more limiting. In addition, interspecific competition may be greater in autumn because P. austriacus tends to forage in woodlands to a greater extent when ambient temperatures are low (Razgour et al. 2011). Therefore, it appears that when prey resources are more limiting and habitat use overlap is higher, the role of dietary partitioning in facilitating coexistence becomes more important. However, a larger dataset is needed to confirm the trend of seasonal differences in dietary niche overlap identified in our study.
Our results suggest that instead of prey selection driving differential habitat use (as is the case in Saunders and Barclay 1992), sympatric P. austriacus and P. auritus simply consume the most energetically beneficial prey available to them in their respective foraging habitats. Hence, spatial partitioning, rather than dietary partitioning, is the principal mechanism of coexistence among these highly cryptic bat species. It is still unclear what morphological differences, if any, drive the differences in foraging and flight behavior, because the two bats show no significant differences in wing loading and aspect ratio (Sevcik 2003), the main wing parameters controlling manoeuvrability and ability to sustain prolonged flight in bats (Norberg and Rayner 1987). Indeed, it could be that morphological divergence is not necessary to drive differences in habitat use by these species.
Conclusions
HTS provided species-level identification of dietary components, and therefore allowed a more comprehensive comparison of the diet of two sympatric cryptic bat species. We found little evidence of trophic resource partitioning. Instead, patterns of prey consumption corresponded to predator habitat use, highlighting the importance of habitat partitioning as the principal mechanism of coexistence. The use of MOTUs as surrogates for prey species enabled us to overcome the constraints of an incomplete reference dataset, and corresponded well with prey species identification. Using generic arthropod primers, we were able to PCR amplify and sequence short fragments of degraded DNA from bat feces with little contamination from nonprey DNA, but our prey species identification confidence was compromised. Therefore, efforts should be put into testing and developing an optimal amplicon length for molecular diet studies, which will provide maximum identification ability with minimum loss of degraded prey DNA. Our study provides significant support for the use of molecular diet analysis, and in particular HTS, to decipher potential mechanisms of resource partitioning.
Acknowledgments
We wish to thank all roost owners and G. Bemment and C. Pope for arranging access to roosts. We are grateful to A. Fisher, E. Dahlberg, and R. Cooper-Bohannon for their enormous help with field work, to D. Hargreaves and J. Mason for help with sample collection, to M. James for help with the microscopic diet analysis, and to E. Willerslev for access to the sequencing platforms. This study was funded by the Hon. Vincent Weir and from the Danish National Research Foundation “GeoGenetics” grant (MTPG), and was carried out in collaboration with Bat Conservation Trust, UK. ELC was funded through a Natural Sciences and Engineering Research Council of Canada (NSERC) post-doctoral fellowship.
Supporting Information
Additional Supporting Information may be found online on Wiley Online Library.
Table S1. Plecotus austriacus.
Table S2. Plecotus auritus.
Please note:Wiley-Blackwell is not responsible for the content or functionality of any supporting materials supplied by the authors. Any queries (other than missing material) should be directed to the corresponding author for the article.
References
- Aldridge HDJN, Rautenbach IL. Morphology, echolocation and resource partitioning in insectivorous bats. J. Anim. Ecol. 1987;56:763–778. [Google Scholar]
- Alexandrou MA, Oliveira C, Maillard M, McGill RAR, Newton J, Creer S, Taylor MI. Competition and phylogeny determine community structure in Mullerian co-mimics. Nature. 2011;469:84–88. doi: 10.1038/nature09660. [DOI] [PubMed] [Google Scholar]
- Anderson ME, Racey PA. Feeding behaviour of captive brown long-eared bats, Plecotus auritus. Anim. Behav. 1991;42:489–493. [Google Scholar]
- Arlettaz R. Habitat selection as a major resource partitioning mechanism between the two sympatric sibling bat species Myotis myotis and Myotis blythii. J. Anim. Ecol. 1999;68:460–471. [Google Scholar]
- Arlettaz R, Perrin N, Hausser J. Trophic resource partitioning and competition between the two sibling bat species Myotis myotis and Myotis blythii. J. Anim. Ecol. 1997;66:897–911. [Google Scholar]
- Ashrafi S, Bontadina F, Kiefer A, Pavlinic I, Arlettaz R. Multiple morphological characters needed for field identification of cryptic long-eared bat species around the Swiss Alps. J. Zool. 2010;281:241–248. [Google Scholar]
- Barlow K. The diet of the two phonic types of the bat Pipistrellus pipistrellus in Britain. J. Zool. 1997;243:597–609. [Google Scholar]
- Bauerova Z. Contributions to the trophic ecology of the grey long-eared bat, Plecotus austriacus. Folia Zool. 1982;31:113–122. [Google Scholar]
- Binladen J, Gilbert MTP, Bollback JP, Panitz F, Bendixen C, Nielsen R, Willerslev E. The use of coded PCR primers enables high-throughput sequencing of multiple homolog amplification products by 454 parallel sequencing. PLoS ONE. 2007;2:e1–9. doi: 10.1371/journal.pone.0000197. [DOI] [PMC free article] [PubMed] [Google Scholar]
- Bogdanowicz W, Fenton MB, Daleszczyk K. The relationships between echolocation calls, morphology and diet in insectivorous bats. J. Zool. 1999;247:381–393. [Google Scholar]
- Bohmann K, Monadjem A, Lehmkuhl Noer C, Rasmussen M, Zeale MRK, Clare EL, Jones G, Willerslev E, Gilbert MTP. Molecular diet analysis of two African free-tailed bats (Molossidae) using high-throughput sequencing. PLoS ONE. 2011;6:e21441. doi: 10.1371/journal.pone.0021441. [DOI] [PMC free article] [PubMed] [Google Scholar]
- Chandler P. A Dipterist's handbook. 2nd ed. London: The Amateur Entomologist Society; 2010. [Google Scholar]
- Chesson P. Mechanisms of maintenance of species diversity. Ann. Rev. Ecol. Syst. 2000;31:343–366. [Google Scholar]
- Chinery M. Complete British insects. London, U.K: Harper Collins Publishers Ltd; 2005. [Google Scholar]
- Clare EL. Cryptic species? Patterns of maternal and paternal gene flow in eight Neotropical bats. PLoS One. 2011;6:e21460. doi: 10.1371/journal.pone.0021460. [DOI] [PMC free article] [PubMed] [Google Scholar]
- Clare EL, Fraser EE, Braid HE, Fenton MB, Hebert PDN. Species on the menu of a generalist predator, the eastern red bat (Lasiurus borealis): using a molecular approach to detect arthropod prey. Mol. Ecol. 2009;18:2532–2542. doi: 10.1111/j.1365-294X.2009.04184.x. [DOI] [PubMed] [Google Scholar]
- Clare EL, Lim BK, Fenton MB, Hebert PDN. Neotropical bats: estimating species diversity with DNA barcodes. PLoS One. 2011a;6:e22648. doi: 10.1371/journal.pone.0022648. [DOI] [PMC free article] [PubMed] [Google Scholar]
- Clare EL, Barber BR, Sweeney BW, Hebert PDN, Fenton MB. Eating local: influences of habitat on the diet of little brown bats (Myotis lucifugus. Mol. Ecol. 2011b;20:1772–1780. doi: 10.1111/j.1365-294X.2011.05040.x. [DOI] [PubMed] [Google Scholar]
- Coles RB, Guppy A, Anderson ME, Schlegel P. Frequency sensitivity and directional hearing in the gleaning bat, Plecotus auritus (Linnaeus 1758) J. Comp. Physiol. A. 1989;165:269–280. doi: 10.1007/BF00619201. [DOI] [PubMed] [Google Scholar]
- Corbet GB. The grey long-eared bat, Plecotus austriacus, in England and the Channel Islands. Proc. Zool. Soc. Lond. 1964;143:511–515. [Google Scholar]
- Davidson-Watts I, Walls S, Jones G. Differential habitat selection by Pipistrellus pipistrellus and Pipistrellus pygmaeus identifies distinct conservation needs for cryptic species of echolocating bats. Biol. Conserv. 2006;133:118–127. [Google Scholar]
- Dayan T, Simberloff D. Ecological and community-wide character displacement: the next generation. Ecol. Lett. 2005;8:875–894. [Google Scholar]
- Deagle BE, Tollit DJ, Jarman SN, Hindell MA, Trites AW, Gales NJ. Molecular scatology as a tool to study diet: analysis of prey DNA in scats from captive Steller sea lions. Mol. Ecol. 2005;14:1831–1842. doi: 10.1111/j.1365-294X.2005.02531.x. [DOI] [PubMed] [Google Scholar]
- Deagle BE, Eveson JP, Jarman SN. Quantification of damage in DNA recovered from highly degraded samples—a case study on DNA in faeces. Front. Zool. 2006;3:e11. doi: 10.1186/1742-9994-3-11. [DOI] [PMC free article] [PubMed] [Google Scholar]
- Deagle BE, Kirkwood R, Jarman SN. Analysis of Australian fur seal diet by pyrosequencing prey DNA in faeces. Mol. Ecol. 2009;18:2022–2038. doi: 10.1111/j.1365-294X.2009.04158.x. [DOI] [PubMed] [Google Scholar]
- Deagle BE, Chiaradia A, McInnes J, Jarman SN. Pyrosequencing faecal DNA to determine diet of little penguins: is what goes in what comes out? Conserv. Genet. 2010;11:2039–2048. [Google Scholar]
- Dietz C, von Helversen O, Nill D. Bats of Britain, Europe and Northwest Africa. English Edition. London, U.K: A & C Black Publishers Ltd; 2009. [Google Scholar]
- Entwistle AC, Racey PA, Speakman JR. Habitat exploitation by a gleaning bat, Plecotus auritus. Philos. Transac. R. Soc. Lond. B. 1996;351:921–931. [Google Scholar]
- Faure PA, Barclay RMR. The sensory basis of prey detection by the long-eared bat, Myotis evotis, and the consequences for prey selection. Anim. Behav. 1992;44:31–39. [Google Scholar]
- Fenton MB. The foraging behaviour and ecology of animal-eating bats. Can. J. Zool. 1990;68:411–422. [Google Scholar]
- Findley JS, Black H. Morphological and dietary structuring of a Zambian insectivorous bat community. Ecology. 1983;64:625–630. [Google Scholar]
- Goerlitz HR, Hofstede HMter, Zeale MRK, Jones G, Holderied MW. An aerial-hawking bat uses stealth echolocation to counter moth hearing. Curr. Biol. 2010;20:1568–1572. doi: 10.1016/j.cub.2010.07.046. [DOI] [PubMed] [Google Scholar]
- Harris S, Morris P, Wray S, Yalden D. A review of British mammals: population estimates and conservation status of British mammals other than Cetaceans. Peterborough, U.K: JNCC; 1995. [Google Scholar]
- Heath J, Emmet M. The moths and butterflies of Great Britain and Ireland. Colchester, U.K: Harley Books; 1983. [Google Scholar]
- Hollyfield AM. 1993. Diet in relation to prey availability and the directionality and design of echolocation calls in three species of British bats. [PhD thesis], University of Bristol, U.K.
- Husar SL. Behavioral character displacement: evidence of food partitioning in insectivorous bats. J. Mammal. 1976;57:331–338. [Google Scholar]
- Jacobs DS, Barclay RMR. Niche differentiation in two sympatric sibling bat species, Scotophilus dinganii and Scotophilus mhlanganii. J. Mammal. 2009;90:879–887. [Google Scholar]
- Jones G. Prey selection by the greater horseshoe bat (Rhinolophus ferrumequinum): optimal foraging by echolocation? J. Anim. Ecol. 1990;59:587–602. [Google Scholar]
- Jones G. Acoustic signals and speciation: the roles of natural and sexual selection in the evolution of cryptic species. Adv. Stud. Behav. 1997;26:317–354. [Google Scholar]
- Jones G, Rydell J. Attack and defence: interactions between echolocating bats and their insect prey. In: Kunz TH, Fenton MB, editors. Bat ecology. Chicago, USA, and London, U.K: Univ. of Chicago Press; 2003. pp. 301–345. [Google Scholar]
- Jones M, Ghoorah A, Blaxter M. jMOTU and taxonerator: turning DNA barcode sequences into annotated operational taxonomic units. PLos ONE. 2011;6:e19259. doi: 10.1371/journal.pone.0019259. [DOI] [PMC free article] [PubMed] [Google Scholar]
- Kingston T, Rossiter SJ. Harmonic hopping in Wallacea's bats. Nature. 2004;429:654–657. doi: 10.1038/nature02487. [DOI] [PubMed] [Google Scholar]
- Kingston T, Jones G, Zubaid A, Kunz TH. Resource partitioning in rhinolophoid bats revisited. Oecologia. 2000;124:332–342. doi: 10.1007/PL00008866. [DOI] [PubMed] [Google Scholar]
- Kunz TH. Feeding ecology of a temperate insectivorous bat (Myotis velifer. Ecology. 1974;55:693–711. [Google Scholar]
- Kurta A, Bell GP, Naggy KA, Kunz TH. Energetic of pregnancy and lactation in freeranging little brown bats (Myotis lucifugus. Physiol. Zool. 1989;62:804–818. [Google Scholar]
- Leibold MA, McPeek MA. Coexistence of the niche and neutral perspectives in community ecology. Ecology. 2006;87:1399–1410. doi: 10.1890/0012-9658(2006)87[1399:cotnan]2.0.co;2. [DOI] [PubMed] [Google Scholar]
- Manley C. British moths and butterflies. London, U.K: A & C Black Publishers Ltd; 2008. [Google Scholar]
- Mayer F, Dietz C, Kiefer A. Molecular species identification boosts bat diversity. Front. Zool. 2007;4:e4. doi: 10.1186/1742-9994-4-4. [DOI] [PMC free article] [PubMed] [Google Scholar]
- McLean JA, Speakman JR. Energy budgets of lactating and non-reproductive brown long-eared bats (Plecotus auritus) suggest females use compensation in lactation. Funct. Ecol. 1999;13:360–372. [Google Scholar]
- Meyer M, Stenzel U, Myles S, Prüfer K, Hofreiter M. Targeted high-throughput sequencing of tagged nucleic acid samples. Nucleic Acids Res. 2007;35:e97. doi: 10.1093/nar/gkm566. [DOI] [PMC free article] [PubMed] [Google Scholar]
- Miller LE, Surlykke A. How some insects detect and avoid being eaten by bats: tactics and countertactics of prey and predator. Bioscience. 2001;51:570–581. [Google Scholar]
- Nagelkerken I, van der Velde G, Wartenbergh SLJ, Nugues MM, Pratchett MS. Cryptic dietary components reduce dietary overlap among sympatric butterflyfishes (Chaetodontidae) J. Fish Biol. 2009;75:1123–1143. doi: 10.1111/j.1095-8649.2009.02303.x. [DOI] [PubMed] [Google Scholar]
- Nicholls B, Racey PA. Habitat selection as a mechanism of resource partitioning in two cryptic bat species Pipistrellus pipistrellus and Pipistrellus pygmaeus. Ecography. 2006;26:697–708. [Google Scholar]
- Norberg UM, Rayner JMV. Ecological morphology and flight in bats (Mammalia; Chiroptera): wing adaptations, flight performance, foraging strategy and echolocation. Philos. Trans. R. Soc. Lond. B. 1987;316:335–427. [Google Scholar]
- Patterson BD, Thaeler CS., Jr The mammalian baculum: hypotheses on the nature of bacular variability. J. Mammal. 1982;63:1–15. [Google Scholar]
- Pianka ER. The structure of lizard communities. Annu. Rev. Ecol. Syst. 1973;4:53–74. [Google Scholar]
- Razgour O, Hanmer J, Jones G. Using multi-scale modelling to predict habitat suitability for species of conservation concern: the grey long-eared bat as a case study. Biol. Conserv. 2011 [Google Scholar]
- Robinson MF. Prey selection by the brown long-eared bat (Plecotus auritus. Myotis. 1990;28:5–18. [Google Scholar]
- Russo D, Jones G. Identification of twenty-two bat species (Mammalia: Chiroptera) from Italy by analysis of time-expanded recordings of echolocation calls. J. Zool. 2002;258:91–103. [Google Scholar]
- Rydell J, Jones G, Waters D. Echolocating bats and hearing moths: who are the winners? Oikos. 1995;73:419–424. [Google Scholar]
- Saunders MB, Barclay RMR. Ecomorphology of insectivorous bats: a test of predictions using two morphologically similar species. Ecology. 1992;73:1335–1345. [Google Scholar]
- Schoeman MC, Jacobs DS. The relative influence of competition and prey defences on the trophic structure of animalivorous bat ensembles. Oecologia. 2011;166:493–506. doi: 10.1007/s00442-010-1854-3. [DOI] [PubMed] [Google Scholar]
- Schoener TW. Resource partitioning in ecological communities. Science. 1974;185:27–39. doi: 10.1126/science.185.4145.27. [DOI] [PubMed] [Google Scholar]
- Schoener TW. Field experiments on interspecific competition. Am. Nat. 1983;122:240–285. [Google Scholar]
- Sevcik M. Does wing morphology reflect different foraging strategies in sibling bat species Plecotus auritus and P. austriacus. Folia Zool. 2003;52:121–126. [Google Scholar]
- Shiel C, McAney C, Sullivan C, Fairley J. Identification of arthropod fragments in bat droppings. 1997. Publication No. 17. Mammal Society, London, U.K. [Google Scholar]
- Siemers BM, Schnitzler HU. Echolocation signals reflect niche differentiation in five sympatric congeneric bat species. Nature. 2004;429:657–661. doi: 10.1038/nature02547. [DOI] [PubMed] [Google Scholar]
- Siemers BM, Swift SM. Differences in sensory ecology contribute to resource partitioning in the bats Myotis bechsteinii and Myotis nattereri (Chiroptera: Vespertilionidae) Behav. Ecol. Sociobiol. 2006;59:373–380. [Google Scholar]
- Sipos R, Székely AJ, Palatinszky M, Révész S, Márialigeti K, Nikolausz M. Effect of primer mismatch, annealing temperature and PCR cycle numberon16S rRNA gene-targetting bacterial community analysis. FEMS Microbial Ecol. 2007;60:341–350. doi: 10.1111/j.1574-6941.2007.00283.x. [DOI] [PubMed] [Google Scholar]
- Spitzenberger F, Strelkov P, Winkler H, Haring E. A preliminary revision of the genus Plecotus (Chiroptera, Vespertilionidae) based on genetic and morphological results. Zool. Scr. 2006;35:187–230. [Google Scholar]
- Swift SM. Long-eared bats. London, U.K: Poyser Ltd; 1998. [Google Scholar]
- Swift SM, Racey PA, Avery MI. Feeding ecology of Pipistrellus pipistrellus (Chiroptera: Vespertilionidae) during pregnancy and lactation. II. Diet. J. Anim. Ecol. 1985;54:217–225. [Google Scholar]
- Symondson WO. Molecular identification of prey in predator diets. Mol. Ecol. 2002;11:627–641. doi: 10.1046/j.1365-294x.2002.01471.x. [DOI] [PubMed] [Google Scholar]
- Thierry D, Canard M, Deutsch B, Ventura MA, Lourenço P, Lodé T. Ecological character displacement in competing common green lacewings in Europe: a route to speciation? Biol. J. Linn. Soc. 2011;102:292–300. [Google Scholar]
- Tokeshi M. Species coexistence: ecological and evolutionary perspective. U.K: Blackwell Science Ltd; 1999. [Google Scholar]
- Valentini A, Miquel C, Ali Nawaz M, Bellemain E, Coissac E, Pompanon F, Gielly L, Cruaud C, Nascetti G, Wincker P, et al. New perspectives in diet analysis based on DNA barcoding and parallel pyrosequencing: the trnL approach. Mol. Ecol. Res. 2009a;9:51–60. doi: 10.1111/j.1755-0998.2008.02352.x. [DOI] [PubMed] [Google Scholar]
- Valentini A, Pompanon F, Taberlet P. DNA barcoding for ecologists. Trends Ecol. Evol. 2009b;24:110–117. doi: 10.1016/j.tree.2008.09.011. [DOI] [PubMed] [Google Scholar]
- Vaughan N. The diets of British bats (Chiroptera) Mammal Rev. 1997;27:77–94. [Google Scholar]
- Waring P, Townsend M, Lewington R. Field guide to the moths of Great Britain and Ireland. Hampshire, U.K: British Wildlife Publishing; 2003. [Google Scholar]
- Wellborn GA, Cothran RD. Niche diversity in crustacean cryptic species: complementarity in spatial distribution and predation risk. Oecologia. 2007;154:175–183. doi: 10.1007/s00442-007-0816-x. [DOI] [PubMed] [Google Scholar]
- Whitaker JO, McCracken GF, Siemers BM. Food habits analysis of insectivorous bats. In: Kunz TH, Parsons S, editors. Ecological and behavioural methods for the study of bats. 2nd ed. Baltimore, MD: The John Hopkins Univ. Press; 2009. pp. 567–592. [Google Scholar]
- Zeale MRK. U.K: University of Bristol; 2011. Conservation biology of the barbastelle (Barbastella barbastellus): applications of spatial modelling, ecology and molecular analysis of diet. [Ph.D. thesis] [Google Scholar]
- Zeale MRK, Butlin RK, Barker GLA, Lees DC, Jones G. Taxon-specific PCR for DNA barcoding arthropod prey in bat faeces. Mol. Ecol. Res. 2011;11:236–244. doi: 10.1111/j.1755-0998.2010.02920.x. [DOI] [PubMed] [Google Scholar]
Associated Data
This section collects any data citations, data availability statements, or supplementary materials included in this article.