Abstract
Diabetic nephropathy is a progressive and generalized vasculopathic condition associated with abnormal angiogenesis. We aim to determine whether changes in renal microvascular (MV) density correlate with and play a role in the progressive deterioration of renal function in diabetes. We hypothesize that MV changes represent the early steps of renal injury that worsen as diabetes progresses, initiating a vicious circle that leads to irreversible renal injury. Male nondiabetic (ND) or streptozotocin-induced diabetic (D) Sprague-Dawley rats were followed for 4 or 12 wk. Renal blood flow and glomerular filtration rate (GFR) were measured by PAH and 125I-[iothalamate], respectively. Renal MV density was quantified ex vivo using three-dimensional micro computed tomography and JG-12 immunoreactivity. Vascular endothelial growth factor (VEGF) levels (ELISA) and expression of VEGF receptors and factors involved in MV remodeling were quantified in renal tissue by Western blotting. Finally, renal morphology was investigated by histology. Four weeks of diabetes was associated with increased GFR, accompanied by a 34% reduction in renal MV density and augmented renal VEGF levels. However, at 12 wk, while GFR remained similarly elevated, reduction of MV density was more pronounced (75%) and associated with increased MV remodeling, renal fibrosis, but unchanged renal VEGF compared with ND at 12 wk. The damage, loss, and subsequent remodeling of the renal MV architecture in the diabetic kidney may represent the initiating events of progressive renal injury. This study suggests a novel concept of MV disease as an early instigator of diabetic kidney disease that may precede and likely promote the decline in renal function.
Keywords: diabetes, vascular endothelial growth factor, imaging
diabetes mellitus is the leading cause of end-stage renal disease (ESRD) needing replacement therapy in the United States. Although the incidence of diabetes-related ESRD and prevalence of ESRD risk factors have declined in all age groups the past 5 yr (2), possibly due to improved treatment and care, diabetes is still one of the heaviest burdens to our health care system.
The mechanisms underlying initiation and progression of renal injury in diabetes are only partly understood. It has been shown in numerous experimental studies that early changes in renal function such as microalbuminuria or augmented glomerular filtration rate (GFR), i.e., glomerular hyperfiltration, may indicate the initial steps toward diabetic nephropathy (22, 23). However, these are useful markers of ongoing renal damage and the sequence of events that lead to progressive and irreversible injury in the diabetic kidney is still not clear.
One of the hallmarks of diabetes mellitus is microvascular (MV) disease and its complications (12, 14). Indeed, changes in MV density and distribution in different organs, as well as remodeling and loss of microvessels, have been observed during the evolution of the diabetes. A typical example of MV changes associated with diabetes is diabetic retinopathy, which is characterized by MV proliferation and remodeling (10). In contrast, in the diabetic kidney, MV changes are more related to progressive MV damage and loss (15). A decrease in the function and density of intrarenal microvessels in the diabetic kidney has been reported in several studies (23). However, the role that MV changes may play in the initiation and progression of renal injury in diabetes has not been defined. The current study tested the hypothesis that MV changes represent the early steps of renal injury that worsen as diabetes progresses, initiating a vicious circle that leads to irreversible renal injury. Streptozotocin (STZ)-induced diabetic rats were examined at 4 and 12 wk following induction of diabetes and MV changes correlated with the progressive deterioration of renal function and injury.
MATERIALS AND METHODS
Study design.
The study was performed on 12-wk-old male Sprague-Dawley rats (Harlan, Madison, WI) maintained on standard rat diet and tap water ad libitum. The rats were randomly divided to remain either nondiabetic (ND; n = 8) or rendered diabetic (D; n = 9) with a single intraperitoneal injection of STZ (55 mg/kg in 0.1 mM citrate buffer, pH 7.4) as previously described (16). After 4 wk of diabetes, half of the animals (ND, n = 4 and D, n = 4) were killed, while the other half (ND, n = 4 and D, n = 5) was killed after 12 wk of diabetes. Throughout either the 4- and 12-wk experimental period, all diabetic rats received insulin, every 3 days (2–4 U, Lantus, Aventis Pharmaceuticals, Kansas City, MO) to maintain blood glucose levels (measured using the OneTouch Ultra glucometer) between 300 and 450 mg/dl sc, to promote weight gain and prevent mortality.
Two days before death, all animals were placed in metabolic cages for 24 h for urine collection for determination of urine albumin excretion (UAE). One day before death, the animals were instrumented with catheters for measurement of blood pressure and renal function as described below. At the time of death, the left kidney was prepared for micro computed tomography (micro-CT) as described below, while parts of the right kidney were snap-frozen in liquid nitrogen (for protein analysis) or fixed with 10% buffered formalin (for histology and immunohistochemistry). All experiments were performed according to the guidelines recommended by the National Institutes of Health and approved by the University of Mississippi Medical Center Animal Care and Use Committee.
Measurement of mean arterial pressure and renal function.
Under 3% isofluorane anesthesia, catheters were placed in the femoral artery for recording of arterial pressure and in the femoral vein for intravenous infusions and blood collection. After overnight recovery, mean arterial pressure (MAP) was continuously recorded for 2 h in conscious rats via a pressure transducer connected to a computerized data-acquisition system (PowerLab, ADInstruments, Colorado Springs, CO). GFR was measured by infusing 125I-iothalamate (10 μCi/ml) at a rate of 2 ml/h over 3 h. Renal plasma flow (RPF) was measured by infusing PAH (2.5 mg/ml) at a rate of 2 ml/h for a time period over 3 h. Renal blood flow (RBF) was calculated as RPF/1 − hematocrit and renal vascular resistance (RVR) as MAP/RBF.
Micro-CT.
At the time of death, the right kidney was perfused at under physiological perfusion pressure first with saline and then with a contrast agent (radio-opaque silicone polymer containing lead chromate; Microfil MV122, Flow Tech, Carver, MA). The polymer-filled kidneys were left at 4°C overnight and then immersed in 10% buffered formalin for 72 h before scanning. The kidney samples were scanned at 0.3° increments using a micro-CT scanner (SkyScan 1076 system, Micro Photonics) and the X-ray transmission images were acquired in each angle of view at a resolution of 18 μm and digitized to 16 bits gray scale. Three-dimensional volume images were reconstructed using a filtered back-projection algorithm and displayed on a computer workstation by volume rendering for display and analysis of renal MV using the Analyze (Biomedical Imaging Resource, Mayo Clinic, Rochester, MN) software package. The cortex was tomographically divided and the spatial density and distribution of microvessels (diameters 9–200 μm) and vascular volume fraction (the ratio of the sum of cross-sectional areas of all vessels and the total area of the region of interest) were calculated, as previously described (7, 8).
Renal vascular endothelial growth factor levels.
Vascular endothelial growth factor (VEGF) protein levels were measured in homogenized renal cortical samples using a commercially available ELISA specific for rat VEGF (R&D Systems, cat. no. RRV00, Minneapolis, MN), according to the manufacturer's protocol.
Immunohistochemistry.
Immunolocalization of JG-12, α-smooth muscle actin (α-SMA), VEGF, VEGFR1, VEGFR2, and tissue-transglutaminase (tTg) was performed on paraffin-embedded sections as previously described in detail (29) using the following antibodies: JG-12 (1:1,000, mouse monoclonal, cat. no. BMS1104, eBioscience, San Diego, CA), α-SMA (1:1,000, mouse monoclonal, cat. no. A5228, Sigma, St. Louis, MO), VEGF (1:500, rabbit polyclonal, cat. no. sc-152, Santa Cruz Biotechnology, Santa Cruz, CA), VEGFR1 (1:500, rabbit polyclonal, cat. no. sc-315, Santa Cruz Biotechnology), VEGFR2 (1:100, rabbit polyclonal, cat. no. sc-316, Santa Cruz Biotechnology), and tTg (1:100, rabbit polyclonal, cat. no. 3557, Cell Signaling).
The density of JG-12 and α-SMA immunoexpression was assessed in 30 randomly selected glomeruli and/or cortical interstitial regions per section and quantitated using image analysis software (NIS-Elements, Ver. 2.32; Nikon Instruments, Melville, NY). The data are expressed as percentage of area stained for either JG-12 or α-SMA per selected area (glomerulus or cortical tubulointerstitial regions).
Western blotting.
Expression of VEGF, VEGFR1, VEGFR2, tTG, matrix-metalloproteinases-2 (MMP-2), and tissue inhibitor of MMP (TIMP-1) protein was performed using the following antibodies: VEGF (1:2,000, rabbit polyclonal, cat. no. sc-152, Santa Cruz Biotechnology), VEGFR1 (1:1,000), VEGFR2 (1:1,000), tTg (1:1,000), MMP-2 (1:1,000, rabbit polyclonal, cat. no. 4022, Cell Signaling, Boston, MA), and TIMP-1 (1:500, rabbit polyclonal, cat. no. sc-5538, Santa Cruz Biotechnology). The densities of specific bands were quantified by densitometry using the Scion Image beta (version 4.02) software and normalized to the total amount of protein loaded in each well following densitometric analysis of gels stained for β-actin (1:1,000, mouse monoclonal, cat. no. sc-47778, Santa Cruz Biotechnology).
Statistical analysis.
Results are expressed as means ± SE. Comparisons between groups were performed using two-way ANOVA. Statistical significance was accepted at P ≤ 0.05.
RESULTS
Metabolic and renal parameters.
Body weight of D animals was lower than that of ND after both 4 and 12 wk (Table 1). Kidney/body weight ratio was increased by 45% in D animals compared with ND after 4 wk and by 79% after 12 wk (Table 1). The kidney/body weight ratio was higher in D animals after 12 wk compared with 4 wk. As expected, glucose levels were higher in D compared with ND rats after both 4 and 12 wk (Table 1).
Table 1.
Metabolic and renal parameters
| ND |
D |
|||
|---|---|---|---|---|
| 4w (n = 4) | 12w (n = 4) | 4w (n = 4) | 12w (n = 5) | |
| Body wt, g | 394 ± 27 | 402 ± 39 | 308 ± 38* | 276 ± 22† |
| Kidney/body wt, mg/g | 4.2 ± 0.5 | 4.4 ± 0.06 | 6.1 ± 1.0* | 7.9 ± 1.0†‡ |
| Blood glucose, mg/dl | 89 ± 6 | 94 ± 9 | 374 ± 37* | 386 ± 41† |
| MAP, mmHg | 108 ± 8 | 112 ± 8 | 94 ± 10 | 89 ± 9 |
| UAE, mg/day | 1.2 ± 0.2 | 2.3 ± 1.3 | 2.9 ± 0.3* | 6.0 ± 1.0†‡ |
| GFR, ml·min−1·kidney wt−1 | 1.4 ± 0.2 | 1.3 ± 0.2 | 2.1 ± 0.3* | 2.2 ± 0.4† |
| RBF, ml·min−1·kidney wt−1 | 5.5 ± 04 | 6.8 ± 0.3 | 5.0 ± 0.8 | 5.0 ± 1.1 |
| RVR, mmHg·ml−1·min | 20 ± 1.5 | 21 ± 0.5 | 21 ± 3.3 | 25 ± 5.5 |
Values are expressed as means ± SE. Statistical significance was accepted at P < 0.05:
0.05 vs. nondiabetic (ND) at 4 wk (4w);
0.05 vs. ND at 12 wk (12w);
0.05 vs. diabetic (D) at 4w.
MAP, mean arterial pressure; UAE, urine albumin excretion; GFR, glomerular filtration rate; RBF, renal blood flow; RVR, renal vascular resistance.
While there was a tendency toward lower levels in D animals, no significant differences in MAP were observed between any of the groups (Table 1). There was a 141% increase in UAE in D compared with ND animals after 4 wk and a 160% increase after 12 wk (Table 1). This increase in UAE was greater by 106% in D animals after 12 wk compared with 4 wk. GFR was increased by 50% and 69% in D compared with ND animals after 4 and 12 wk, respectively (Table 1). No differences in RBF or RVR were observed between any of the groups (Table 1).
MV architecture.
Micro-CT reconstruction of the renal MV architecture (Fig. 1A) showed that in the D animals, the density of microvessels with diameters under 100 μm decreased by 34% after 4 wk and by 75% after 12 wk compared with ND (Fig. 1B). In contrast, the density of microvessels with diameters between 300 and 500 μm increased by 18% after 4 wk and by 40% after 12 wk (Fig. 1B). No differences in MV density were observed in microvessles with diameters between 200 and 300 μm.
Fig. 1.

Micro-CT. A: representative 3-dimensional (3D) micro-CT reconstruction of the renal vasculature. B: quantification of the cortical microvascular (MV) density and vascular volume fraction of microvessels with diameters between 0–100, 200–300, and 300–500 μm. Data are expressed as means ± SE. 4w, 4 wk; 12w, 12 wk; ND, nondiabetic; D, diabetic.
The micro-CT analysis of the renal microcirculation was extended by immunohistochemical labeling of endothelial cells (JG-12; Fig. 2), α-SMA (Fig. 3), and protein expression of tTg (see Fig. 8). No differences in the density of JG-12-positive cells in the glomerular region were observed between ND and D animals after 4 wk (Fig. 2B); however, there was a 21% decrease in the density of JG-12-positive cells in the glomerulus of D compared with ND animals after 12 wk (Fig. 2B). Compared with ND animals, the density of JG-12-positive cells in the cortical interstitial region of D animals was decreased by 37% after 4 wk and by 54% after 12 wk (Fig. 2C). The density of α-SMA-positive cells was calculated in the cortical interstitium. No difference in the density of α-SMA-positive cells was observed between ND and D animals after 4 wk (Fig. 3B). Compared with ND animals, the density of α-SMA-positive cells in D animals was increased by 99% after 12 wk, and this was accompanied by a significant increase in renal expression of tTg (Fig. 4), indicating progressive remodeling of the renal microvasculature.
Fig. 2.

Renal cortical JG-12 density. A: JG-12 immunolocalization (brown staining). Original magnification ×400. B: quantification of the cortical JG-12 density. C: quantification of the cortical interstitial JG-12 density. Data are expressed as means ± SE.
Fig. 3.
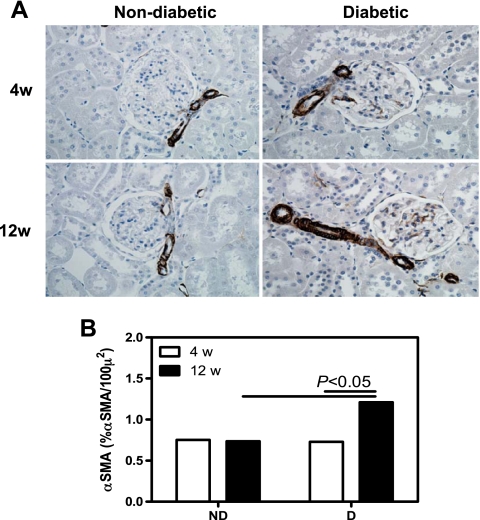
Renal cortical α-smooth muscle actin (SMA) density. A: α-SMA immunolocalization (brown staining). Original magnification ×400. B: quantification of α-SMA density. Data are expressed as means ± SE.
Fig. 8.
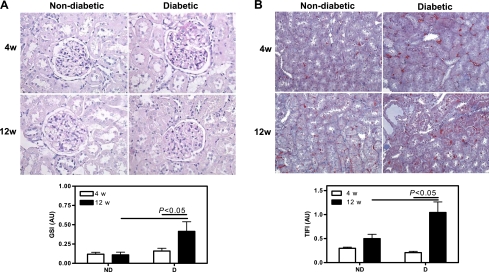
Renal pathology. A: representative PAS-stained section and quantification of glomerulosclerosis. B: representative Mason's trichrome-stained section and quantification of tubulointerstitial fibrosis. Original magnification ×400. Data are expressed as means ± SE.
Fig. 4.
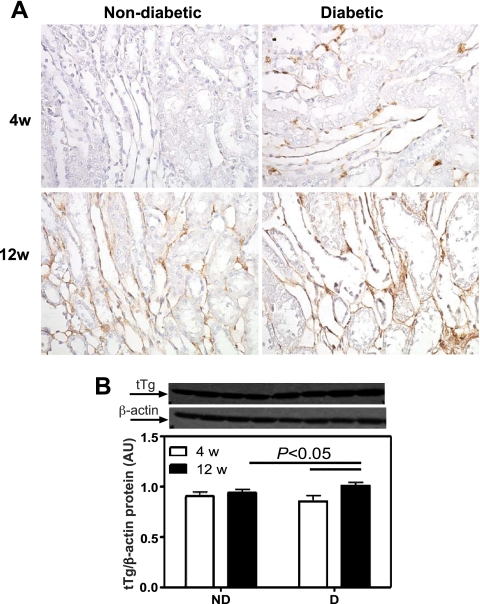
Renal cortical tissue-transglutaminase (tTG) protein expression. A: tTg immunolocalization (brown staining). Original magnification ×400. B: tTg protein expression. Top: representative immunoblot of tTg protein expression. Bottom: densitometric scans in relative optical density (ROD) expressed as a ratio of tTg/β-actin. Data are expressed as means ± SE.
Renal protein expression of VEGF and VEGF receptors.
To examine some of the mechanisms for the changes in MV density, we measured VEGF immunolocalization and protein levels as well as VEGFR1 and VEGFR2 protein expression. Using ELISA, no differences in VEGF levels were observed between any of the groups (Fig. 5B). As measured by Western blotting, there was a 69% increase in VEGF protein expression in the D compared with ND animals after 4 wk, but no differences were observed after 12 wk (Fig. 5C). The Western blotting data were confirmed by immunohistochemistry (Fig. 5A).
Fig. 5.

Renal cortical vascular endothelial growth factor (VEGF) protein expression. A: VEGF immunolocalization (brown staining). Original magnification ×400. B: VEGF protein levels as measured by ELISA. C: VEGF protein expression. Top: representative immunoblot of VEGF protein expression. Bottom: densitometric scans in ROD expressed as a ratio of VEGF/β-actin. Data are expressed as means ± SE. PT, proximal tubule; DT, distal tubule.
While there was no difference in VEGFR1 protein expression between ND and D after 4 wk, there was a 54% increase after 12 wk (Fig. 6B). These observations were confirmed by immunohistochemistry (Fig. 6A). No differences in VEGFR2 protein expression were observed between any of the groups, as measured by both Western blotting (Fig. 7B) and immunohistochemistry (Fig. 7A). It should be noted that while immunolocalization for both VEGFR1 and VEFR2 was prominent in the renal tubules, staining was also observed in both endothelial and vascular smooth muscle cells of the renal vasculature.
Fig. 6.
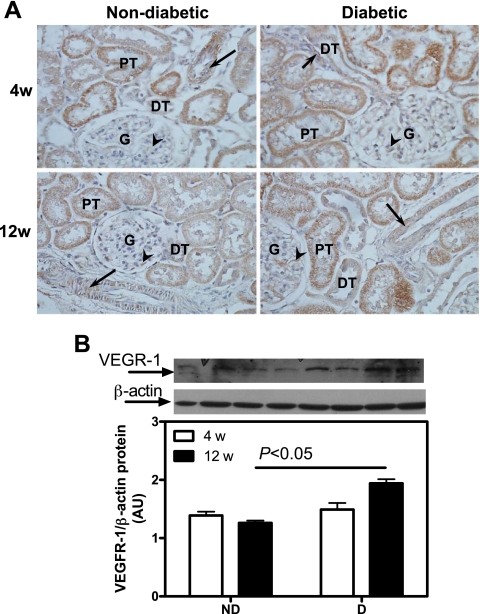
Renal cortical VEGFR1 protein expression. A: VEGFR1 immunolocalization (brown staining). Original magnification ×400. B: VEGFR1 protein expression. Top: representative immunoblot of VEGFR1 protein expression. Bottom: densitometric scans in ROD expressed as a ratio of VEGFR1/β-actin. Data are expressed as means ± SE. G, glomerulus; arrows, vascular smooth muscle cells; arrowheads, endothelial cells.
Fig. 7.
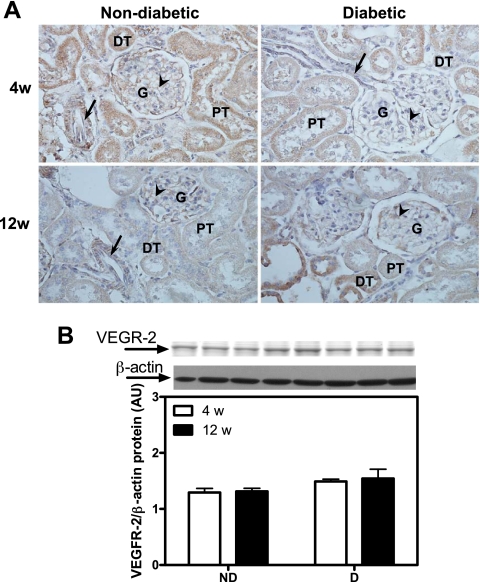
Renal cortical VEGFR2 protein expression. A: VEGFR2 immunolocalization (brown staining). Original magnification ×400. B: VEGFR2 protein expression. Top: representative immunoblot of VEGFR2 protein expression. Bottom: densitometric scans in ROD expressed as a ratio of VEGFR2/β-actin. Data are expressed as means ± SE.
Renal morphology.
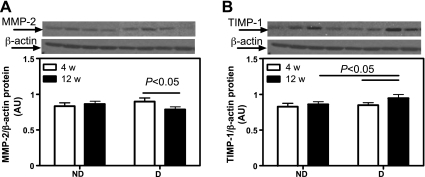
After 4 wk, there was no evidence of renal glomerular (Fig. 8A) or tubulointerstitial (Fig. 8B) damage. While ND animals showed healthy kidneys after 12 wk, D animals showed significant glomerulosclerosis and tubulointerstitial fibrosis. This was accompanied by increased expression of MMP-2 (Fig. 9A) and augmented TIMP-1 (Fig. 9B), indicating extracellular matrix accumulation and progression of renal damage.
Fig. 9.
Renal cortical matrix-metalloproteinases-2 (MMP-2) and tissue inhibitor of MMP (TIMP-1) protein expression. A: MMP-2 protein expression. Top: representative immunoblot of MMP-2 protein expression. Bottom: densitometric scans in ROD expressed as a ratio of MMP-2/β-actin. B: TIMP-1 protein expression. Top: representative immunoblot of TIMP-1 protein expression. Bottom: densitometric scans in ROD expressed as a ratio of TIMP-1/β-actin. Data are expressed as means ± SE.
DISCUSSION
The current study shows that a 4-wk exposure to type 1 diabetes leads to a decrease in renal MV density accompanied by augmented VEGF protein expression, which might be a compensatory mechanism to counteract the MV loss at this early stage of the disease. Twelve weeks of STZ-induced diabetes results in a similar increase in VEGF but with a greater decrease in renal MV density, accompanied by significant remodeling of the MV architecture, progressive glomerulosclerosis, and tubulointerstitial fibrosis and an increase in albuminuria. These results indicate that STZ-induced diabetes, characterized by glomerular hyperfiltration, is associated with a progressive decrease in MV density and remodeling of the MV architecture, which precedes the deterioration of renal function, supporting the notion that MV changes early in the disease process may initiate renal injury in the diabetic kidney.
While current therapeutic treatments for diabetic nephropathy are able to slow the disease progression, they are unable to reverse the disease. One of the major reasons for this is related to the incomplete understanding of the early events in the pathogenesis of the diabetic renal disease. Thus, the goal of the present study was to identify major deleterious mechanisms initiated in the early stages of the disease to determine their role in the progressive nature of diabetes-induced renal injury. Using the STZ-induced model of diabetes in the rat, we observed that vascular changes are evident in the diabetic kidney as early as 4 wk following induction of diabetes. This early stage is also associated with glomerular hyperfiltration but no structural tissue damage. We observed that the reduction in renal MV density at 4 wk affects intrarenal vessels of diameter under 100 μm both in the cortex and medulla. Such findings were confirmed by the significant decrease in glomerular and tubulointerstitial JG-12-positive endothelial cells, supporting the notion of decreased MV density early in the diabetic kidney.
Abnormal angiogenesis has been shown at the very early stages of both human and STZ-induced diabetes in mice, resulting in a larger glomerular capillary density but constituted of highly permeable and dilated vessels with swollen endothelial cells (5, 6, 24, 30). In contrast, the present study shows a decrease in MV density in early stages (4 wk) of diabetes. However, it should be noted that previous studies mainly focused on measuring glomerular capillary densities rather than tubulointerstitial capillaries. Other possible explanations are differences in experimental models (mice vs. rats), different methods used in the analysis (immunohistochemical labeling of endothelial cells vs. micro-CT), and type of dibetes (type 2 vs. type 1). However, our finding that the later stages (12 wk) of diabetic renal disease are accompanied by reduced microvasculature and capillary loss is consistent with previous reports in both humans and animal models (21).
MV changes are one of the hallmarks of diabetic nephropathy (13, 27). Changes in the renal MV architecture have been observed in both experimental (18) and clinical studies (15). VEGF has been suggested to play a major role in MV changes in the diabetic kidney and the progression of diabetic nephropathy (28). We observed a significant increase in the renal expression of this angiogenic cytokine at both the early (4 wk) and a more advance stage (12 wk) of diabetes. This was accompanied by a progressive increased expression of the VEGFR1, which was evident after 12 wk of diabetes. VEGFR1 is known to mediate the anti-angiogenic effects of VEGF to counteract the proangiogenic effects mediated through the VEGFR2 by reducing blood vessel formation via downregulation of endothelial cell division (26). The weaker expression of VEGF receptors we observed in endothelial cells correlates with a progressive decrease in capillary density in the diabetic kidney, suggesting a potential abnormal VEGF signaling and stimulation of MV proliferation and repair as diabetes advances. Furthermore, the augmented renal VEGF may have progressively bound to VEGFR1 and thereby contributed to the reduced MV density in the diabetic kidney (11). Alternatively, the reduction in renal MV density may have partly been mediated by a disrupted expression of downstream mediators of VEGF such as endothelial nitric oxide synthase (eNOS) and decreased NO bioavailability. VEGF stimulates endothelial NO release and acts in concert with elevated NO levels as a trophic factor for vascular endothelium (19), and it is possible that decreased bioavailability of NO in the diabetic kidney may have also contributed to decreased renal MV density and augmented remodeling (20).
We found that while renal microcirculation in control animals grew from 4 to 12 wk, renal MV density was further decreased with evolution of diabetes. The reasons behind the growth of renal microvasculature in controls are not entirely clear, and may have been a part of the normal growth in rats (still active at that age), although more studies (beyond the scope of the current work) are needed to better understand the underlying causes. However, these observations in turn suggest that the progressive deleterious effects of diabetes on the renal microvasculature may be due to effects on the developing vasculature.
On the other hand, the decrease in MV density in the diabetic kidney was associated with a significant and progressive remodeling of larger intrarenal microvessels (as indicated by the increased MV expression of α-SMA and tTg), greater albuminuria, decreased extracellular matrix turnover (decreased MMP-2 and increased TIMP-1), overt glomerulosclerosis and tubulointerstitial fibrosis, and glomerular hyperfiltration. Several studies have proposed that hyperfiltration-induced renal injury is an important contributor to renal damage in diabetes (9, 17). However, the MV changes we observed in our study accompanied by progressive glomerulosclerosis and tubulointerstitial fibrosis may imply that the sustained elevation in GFR may actually be a compensatory mechanism in response to a vascular insult leading to MV damage, loss, and remodeling throughout the diabetic kidney. Although unbiased stereological analysis was not performed in this study, a direct count of glomerular profiles in each animal did not reveal any differences in glomerular number (data not shown). These suggest that possible combined hemodynamic disturbances within the glomerulus and tubulointerstitial capillaries alongside MV loss contribute to increases in glomerular pressure leading to a higher single-nephron GFR (4), which in turn may also contribute to sustain RBF at this stage of the disease. However, it is known that such intraglomerular hemodynamic changes could also lead to mesangial cell and basement membrane expansion, extracellular matrix production and accumulation, resulting in glomerulosclerosis (25), which we observed only at 12 wk of diabetes. Therefore, our data imply that reduced renal MV density and MV remodeling may indeed play an important role in initiating the deleterious sequence of events that ultimately lead to a later deterioration of renal function in the diabetic kidney. Furthermore, these data suggest that the progressive deleterious effects of diabetes on the renal microvasculature seem to be simultaneously on both the developing microvessels and on the stabilized mature vasculature.
Diabetes is a complex multiorgan disease and mechanisms behind MV dysfunction, damage, and loss in the diabetic kidney are still unclear. Most likely, MV disease in the diabetic kidney is not the result of a sole mechanism but the consequence of concurrent insults such as hyperglycemia-induced renal vascular endothelial dysfunction (1, 3), augmented advanced-glycation end products (which reduce NO bioavailability leading to sustained vasoconstriction), and increased secretion of cytokines and growth factors such as transforming growth factor-β and VEGF, among others (25). Our study observation that albuminuria, glomerulosclerosis, and tubulointerstitial fibrosis worsen with duration of diabetes suggests that activation of such mechanisms may first affect the microvasculature before compromising renal function and structure.
Our study was performed at an early (4 wk) and more advanced stage (12 wk) of diabetic renal disease. A limitation of our study is the fact that the STZ-induced diabetic rats don't recapitulate all the aspects of advanced human diabetic nephropathy. While the goal of the present study was to identify the earlier events in diabetes-induced renal damage, focusing on the MV changes and their role in the diabetic kidney, future studies are warranted to examine additional mechanisms involved in the progression of renal injury. Finally, while no therapeutic interventions were performed in the present study, future experiments will be designed to determine the feasibility of interventions (e.g., insulin-treated animals, angiogenic cytokines) to preserve the renal microcirculation. These studies will further contribute to our understanding of the events leading to and the development and progression of diabetic renal disease.
In summary, the current study suggests that MV damage, loss, and remodeling in the diabetic kidney may represent initiating events of renal injury. As diabetes advances, we observed that changes in the renal MV architecture are accompanied by progressive albuminuria and tissue injury. Future studies using targeted interventions on the renal microcirculation will further determine the definitive role of MV disease as the early instigator of diabetic kidney disease.
GRANTS
This work was supported by National Institutes of Health Grants DK075832 (C. Maric-Bilkan), HL095638 (A. Chade), and PO1 HL51971 (J. E. Hall for the support of core facilities used for part of the study).
DISCLOSURES
No conflicts of interest, financial or otherwise, are declared by the author(s).
AUTHOR CONTRIBUTIONS
Author contributions: C.M.-B. and A.R.C. conception and design of research; C.M.-B., E.R.F., and A.R.C. performed experiments; C.M.-B. and A.R.C. analyzed data; C.M.-B. and A.R.C. interpreted results of experiments; C.M.-B. and A.R.C. prepared figures; C.M.-B. and A.R.C. drafted manuscript; C.M.-B. and A.R.C. edited and revised manuscript; C.M.-B. and A.R.C. approved final version of manuscript.
ACKNOWLEDGMENTS
The authors thank Stephanie Evans for technical assistance with paraffin sectioning, Jonathan Lee, David C. Marbury, and Silvia Kelsen for technical assistance with measuring renal function and Western blotting.
REFERENCES
- 1.Affonso FS, Cailleaux S, Pinto LF, Gomes MB, Tibirica E. Effects of high glucose concentrations on the endothelial function of the renal microcirculation of rabbits. Arq Bras Cardiol 81: 161–165, 156–160, 2003 [DOI] [PubMed] [Google Scholar]
- 2.Burrows NR, Li Y, Geiss LS. Incidence of treatment for end-stage renal disease among individuals with diabetes in the US continues to decline. Diabetes Care 33: 73–77, 2010 [DOI] [PMC free article] [PubMed] [Google Scholar]
- 3.Gomes MB, Affonso FS, Cailleaux S, Almeida AL, Pinto LF, Tibirica E. Glucose levels observed in daily clinical practice induce endothelial dysfunction in the rabbit macro- and microcirculation. Fundam Clin Pharmacol 18: 339–346, 2004 [DOI] [PubMed] [Google Scholar]
- 4.Hostetter TH, Rennke HG, Brenner BM. The case for intrarenal hypertension in the initiation and progression of diabetic and other glomerulopathies. Am J Med 72: 375–380, 1982 [DOI] [PubMed] [Google Scholar]
- 5.Ichinose K, Maeshima Y, Yamamoto Y, Kinomura M, Hirokoshi K, Kitayama H, Takazawa Y, Sugiyama H, Yamasaki Y, Agata N, Makino H. 2-(8-Hydroxy-6-methoxy-1-oxo-1h-2-benzopyran-3-yl) propionic acid, an inhibitor of angiogenesis, ameliorates renal alterations in obese type 2 diabetic mice. Diabetes 55: 1232–1242, 2006 [PubMed] [Google Scholar]
- 6.Ichinose K, Maeshima Y, Yamamoto Y, Kitayama H, Takazawa Y, Hirokoshi K, Sugiyama H, Yamasaki Y, Eguchi K, Makino H. Antiangiogenic endostatin peptide ameliorates renal alterations in the early stage of a type 1 diabetic nephropathy model. Diabetes 54: 2891–2903, 2005 [DOI] [PubMed] [Google Scholar]
- 7.Iliescu R, Chade AR. Progressive renal vascular proliferation and injury in obese Zucker rats. Microcirculation 17: 250–258, 2010 [DOI] [PMC free article] [PubMed] [Google Scholar]
- 8.Iliescu R, Fernandez SR, Kelsen S, Maric C, Chade AR. Role of renal microcirculation in experimental renovascular disease. Nephrol Dial Transplant 25: 1079–1087, 2010 [DOI] [PMC free article] [PubMed] [Google Scholar]
- 9.Jerums G, Premaratne E, Panagiotopoulos S, MacIsaac RJ. The clinical significance of hyperfiltration in diabetes. Diabetologia 53: 2093–2104, 2010 [DOI] [PubMed] [Google Scholar]
- 10.Josifova T, Schneider U, Henrich PB, Schrader W. Eye disorders in diabetes: potential drug targets. Infect Disord Drug Targets 8: 70–75, 2008 [DOI] [PubMed] [Google Scholar]
- 11.Kamba T, Tam BY, Hashizume H, Haskell A, Sennino B, Mancuso MR, Norberg SM, O'Brien SM, Davis RB, Gowen LC, Anderson KD, Thurston G, Joho S, Springer ML, Kuo CJ, McDonald DM. VEGF-dependent plasticity of fenestrated capillaries in the normal adult microvasculature. Am J Physiol Heart Circ Physiol 290: H560–H576, 2006 [DOI] [PubMed] [Google Scholar]
- 12.Karalliedde J, Gnudi L. Future strategies to prevent renal microvascular disease complications in diabetes. Future Cardiol 4: 77–83, 2008 [DOI] [PubMed] [Google Scholar]
- 13.Khavandi K, Greenstein AS, Sonoyama K, Withers S, Price A, Malik RA, Heagerty AM. Myogenic tone and small artery remodelling: insight into diabetic nephropathy. Nephrol Dial Transplant 24: 361–369, 2009 [DOI] [PubMed] [Google Scholar]
- 14.Krentz AJ, Clough G, Byrne CD. Interactions between microvascular and macrovascular disease in diabetes: pathophysiology and therapeutic implications. Diabetes Obes Metab 9: 781–791, 2007 [DOI] [PubMed] [Google Scholar]
- 15.Lindenmeyer MT, Kretzler M, Boucherot A, Berra S, Yasuda Y, Henger A, Eichinger F, Gaiser S, Schmid H, Rastaldi MP, Schrier RW, Schlondorff D, Cohen CD. Interstitial vascular rarefaction and reduced VEGF-A expression in human diabetic nephropathy. J Am Soc Nephrol 18: 1765–1776, 2007 [DOI] [PubMed] [Google Scholar]
- 16.Mankhey R, Wells CC, Bhatti F, Maric C. 17-β Estradiol supplementation reduces tubulointerstitial fibrosis by increasing MMP activity in the diabetic kidney. Am J Physiol Regul Integr Comp Physiol 292: R769–R777, 2007 [DOI] [PubMed] [Google Scholar]
- 17.Marre M, Hallab M, Roy J, Lejeune JJ, Jallet P, Fressinaud P. Glomerular hyperfiltration in type I, type II, and secondary diabetes. J Diabetes Complications 6: 19–24, 1992 [DOI] [PubMed] [Google Scholar]
- 18.Nakagawa T. A new mouse model resembling human diabetic nephropathy: uncoupling of VEGF with eNOS as a novel pathogenic mechanism. Clin Nephrol 71: 103–109, 2009 [DOI] [PubMed] [Google Scholar]
- 19.Nakagawa T. Uncoupling of the VEGF-endothelial nitric oxide axis in diabetic nephropathy: an explanation for the paradoxical effects of VEGF in renal disease. Am J Physiol Renal Physiol 292: F1665–F1672, 2007 [DOI] [PubMed] [Google Scholar]
- 20.Nakagawa T. Uncoupling of VEGF with NO as a mechanism for diabetic nephropathy. Diabetes Res Clin Pract 82, Suppl 1: S67–S69, 2008 [DOI] [PubMed] [Google Scholar]
- 21.Nakagawa T, Kosugi T, Haneda M, Rivard CJ, Long DA. Abnormal angiogenesis in diabetic nephropathy. Diabetes 58: 1471–1478, 2009 [DOI] [PMC free article] [PubMed] [Google Scholar]
- 22.Nawroth PP, Isermann B. Mechanisms of diabetic nephropathy–old buddies and newcomers part 1. Exp Clin Endocrinol Diabetes 118: 571–576, 2010 [DOI] [PubMed] [Google Scholar]
- 23.Nawroth PP, Isermann B. Mechanisms of diabetic nephropathy–old buddies and newcomers part 2. Exp Clin Endocrinol Diabetes 118: 667–672, 2010 [DOI] [PubMed] [Google Scholar]
- 24.Osterby R, Nyberg G. New vessel formation in the renal corpuscles in advanced diabetic glomerulopathy. J Diabetes Complications 1: 122–127, 1987 [DOI] [PubMed] [Google Scholar]
- 25.Raptis AE, Viberti G. Pathogenesis of diabetic nephropathy. Exp Clin Endocrinol Diabetes 109, Suppl 2: S424–S437, 2001 [DOI] [PubMed] [Google Scholar]
- 26.Roberts DM, Kearney JB, Johnson JH, Rosenberg MP, Kumar R, Bautch VL. The vascular endothelial growth factor (VEGF) receptor Flt-1 (VEGFR-1) modulates Flk-1 (VEGFR-2) signaling during blood vessel formation. Am J Pathol 164: 1531–1535, 2004 [DOI] [PMC free article] [PubMed] [Google Scholar]
- 27.Rosenson RS, Fioretto P, Dodson PM. Does microvascular disease predict macrovascular events in type 2 diabetes? Atherosclerosis 218: 13–18, 2011 [DOI] [PubMed] [Google Scholar]
- 28.Schrijvers BF, Flyvbjerg A, De Vriese AS. The role of vascular endothelial growth factor (VEGF) in renal pathophysiology. Kidney Int 65: 2003–2017, 2004 [DOI] [PubMed] [Google Scholar]
- 29.Xu Q, Wells CC, Garman JH, Asico L, Escano CS, Maric C. Imbalance in sex hormone levels exacerbates diabetic renal disease. Hypertension 51: 1218–1224, 2008 [DOI] [PMC free article] [PubMed] [Google Scholar]
- 30.Yamamoto Y, Maeshima Y, Kitayama H, Kitamura S, Takazawa Y, Sugiyama H, Yamasaki Y, Makino H. Tumstatin peptide, an inhibitor of angiogenesis, prevents glomerular hypertrophy in the early stage of diabetic nephropathy. Diabetes 53: 1831–1840, 2004 [DOI] [PubMed] [Google Scholar]


