

Abstract
Reactivity to smoking-related cues may be an important factor that precipitates relapse in smokers who are trying to quit. The neurobiology of smoking cue reactivity has been investigated in several fMRI studies. We combined the results of these studies using activation likelihood estimation, a meta-analytic technique for fMRI data. Results of the meta-analysis indicated that smoking cues reliably evoke larger fMRI responses than neutral cues in the extended visual system, precuneus, posterior cingulate gyrus, anterior cingulate gyrus, dorsal and medial prefrontal cortex, insula, and dorsal striatum. Subtraction meta-analyses revealed that parts of the extended visual system and dorsal prefrontal cortex are more reliably responsive to smoking cues in deprived smokers than in non-deprived smokers, and that short-duration cues presented in event-related designs produce larger responses in the extended visual system than long-duration cues presented in blocked designs. The areas that were found to be responsive to smoking cues agree with theories of the neurobiology of cue reactivity, with two exceptions. First, there was a reliable cue reactivity effect in the precuneus, which is not typically considered a brain region important to addiction. Second, we found no significant effect in the nucleus accumbens, an area that plays a critical role in addiction, but this effect may have been due to technical difficulties associated with measuring fMRI data in that region. The results of this meta-analysis suggest that the extended visual system should receive more attention in future studies of smoking cue reactivity.
Keywords: smoking, cue reactivity, fMRI, meta-analysis, tobacco, addiction
1. Introduction
Cigarette smoking is the leading preventable cause of disease and death in the United States (US Department of Health and Human Services, 2010). Quitting smoking reduces the risk of developing health problems, but approximately 85% of unaided cessation attempts fail (NIDA, 2009). The presence of cigarette-related cues has been implicated as a precipitating factor in many relapse episodes (Shiffman et al., 2007). Thus, reducing reactivity to smoking cues appears to be a promising strategy for improving the success of quit attempts. It is therefore important to identify neurobiological processes involved in the expression of cue reactivity, because these processes may provide targets for more effective smoking-cessation interventions.
In typical cue-reactivity paradigms, smokers’ responses are compared between conditions where they view cigarette-related or neutral cues (Carter & Tiffany, 1999). Several studies have used functional magnetic resonance imaging (fMRI) to investigate the neuroanatomical substrates of cigarette cue reactivity by comparing the blood-oxygenation-level-dependent (BOLD) signal between the cigarette-related and neutral cue conditions (for reviews, see Azizian et al., 2009; McClernon & Gilbert, 2004). Experiments using this paradigm have found that exposure to cigarette cues increases the BOLD signal in a large number of brain regions, including the visual association cortex in the occipital, posterior parietal, and inferior temporal lobes, cingulate gyrus, prefrontal cortex, insula, and subcortical structures of the limbic system and basal ganglia. The emergence of statistically significant contrasts between cigarette and neutral cues in so many regions demonstrates the extraordinary sensitivity of modern imaging techniques in the search for neuroanatomical substrates of cue reactivity. In fact, findings from brain imaging studies have shaped the development of contemporary theories of addiction (Everitt & Robbins, 2005; Koob & LeMoal, 2001; Robinson & Berridge, 2003; Volkow et al., 2010). However, the large number of active regions in response to cigarette cues is also problematic in that it provides a potentially excessive number of targets for future fMRI studies. Furthermore, not all studies find significant cue reactivity in the same brain regions, making it difficult to distinguish reliable patterns of activation from those that are an artifact of a particular sample or unique to a specific cue exposure paradigm.
The variability of brain regions identified across cue reactivity studies likely arises for two reasons: 1) the behavioral paradigms used for cue presentation differ considerably across studies, and 2) most studies have used small sample sizes. To address these issues, we conducted an activation likelihood estimation (ALE) meta-analysis of the coordinates of significantly active clusters of voxels from several fMRI studies of cigarette cue reactivity. ALE is an established methodology for quantitatively combining the results of fMRI experiments and generating a map of the most statistically reliable activation clusters from those studies (Eickhoff et al., 2009). Specifically, this technique allowed us to: 1) restrict the analyses to studies (n = 11) using similar cue presentation methodologies and 2) create a large sample (n = 216) via the combination of these studies. We used information from this pooled sample to generate a map of brain regions that are most reliably activated by cigarette cues; regions which therefore may be especially important contributors to cue-induced craving and relapse.
Recently, two ALE meta-analyses of cue reactivity have been published. The first study combined the results from fMRI studies of cue exposure across a range of substance (nicotine, alcohol, cocaine, marijuana, and heroin) and non-substance (gambling) addictions (Chase et al., 2011). The second study conducted separate analyses for nicotine, cocaine, and alcohol addiction (Kuhn & Gallinat, 2011). In these meta-analyses, brain regions that were found to be more active during the presentation of drug cues than control cues included the ventral striatum, amygdala, prefrontal cortex, and anterior cingulate cortex. In this manuscript, we extend the literature beyond these two meta-analyses by focusing specifically on smokers. Furthermore, we completed two subtraction meta-analyses that compared subsets of studies. First, we compared the results of studies on the basis of whether or not the smokers were deprived of cigarettes at the time of the fMRI scan. This is an important comparison because most smokers relapse during the initial deprivation period at the beginning of a quit attempt (Hughes et al., 2004). One reason for deprivation-induced vulnerability to relapse may be that the loss of nicotine causes functional changes in the brain that heighten sensitivity to smoking-related cues (Drummond, 2000). Thus, in our meta-analysis, we expected to see different patterns of active brain regions as a function of deprivation. Second, we compared studies on the basis of cue duration. Our literature search revealed that two types of paradigms are generally used to study cigarette cue reactivity using fMRI. Event-related designs with short cue duration and a large number of trials per session, and blocked designs with long cue duration and a small number of trials per session. This comparison allowed us to examine the effect of variability across cue presentation paradigms on brain responses to the cues.
2. Method
The objective of this meta-analysis was to produce statistical maps identifying brain regions that are consistently reactive to cigarette cues across fMRI studies. We defined cigarette cue reactivity as the difference between the response to cigarette and neutral cues. This definition of cue reactivity was used in a previous meta-analysis of the subjective, behavioral, and psychophysiological effects of drug cues (Carter & Tiffany, 1999), and has frequently been used to quantify cue reactivity in fMRI and psychophysiological studies of addicted populations (e.g., Due et al., 2002; Littel & Franken, 2007; Versace et al., 2011). Our approach was thus to search the literature for studies that compared fMRI responses to cigarette and neutral cues, extract the stereotaxic coordinates of locations in the brain with significantly greater responses to cigarette cues than to neutral cues, and conduct an ALE meta-analysis on these coordinates to quantify the consistency with which different brain regions showed cue reactivity effects across studies. We also completed two subtraction meta-analyses in which we compared the results of studies on the basis of 1) tobacco deprivation and 2) stimulus duration.
2.1. Literature search
Studies for potential inclusion in the meta-analysis were identified by searching the PubMED (Medline), PsycINFO, and Google Scholar databases. Independent searches were conducted by two authors (JME and PMC) and included the combination of search terms related to smoking cues (e.g., smoking, cigarette, cue reactivity, cue) and fMRI (e.g., fMRI, MRI, BOLD, brain imaging, neuroimaging, imaging). The internet searches included studies that were listed in the databases on or before August 1, 2011. Candidate studies were also identified by searching the reference lists of three literature reviews (Azizian et al., 2009; McClernon & Gilbert, 2004; Sharma & Brody, 2009) and of the publications returned from the initial literature search. These searches identified 36 publications that involved fMRI and smoking cues.
2.2. Study inclusion/exclusion criteria
The 36 candidate publications were evaluated using an ordered set of 8 inclusion criteria and 5 exclusion criteria, such that when a study failed to meet one of the inclusion criteria or when it met an exclusion criterion, it was excluded from further consideration (Table 1). This process resulted in the exclusion of 25 publications, leaving a final sample of 11 studies. We required that the study participants be daily smokers (inclusion criterion 1) not taking medication at the time of the fMRI scan (exclusion criterion 1). We included studies in which the smokers were shown smoking-related and neutral pictures or videos (inclusion criterion 2), which were the most common cue-presentation modalities. Most studies that failed to meet this criterion were fMRI studies in which smokers were not shown smoking-related cues (Gloria et al., 2009; Kozink et al., 2010; Wang et al., 2007; Wilson et al., 2008). One study had smokers handle a cigarette or a neutral object instead of viewing pictures or videos (Wilson et al., 2005). We excluded this study because the objects differed with respect to several important characteristics (e.g., size, texture) other than smoking-specific content, whereas the pictures and videos used in the studies meeting this inclusion criterion had been more closely matched on characteristics unrelated to smoking.
Table 1.
Study Inclusion and Exclusion Criteria
| Ordered List of Criteria | Studies excluded at each level (n) |
|---|---|
| Inclusion Criteria | |
| 1. Participants were daily cigarette smokers | 1 |
| 2. Cues were pictures or videos | 5 |
| 3. Imaging technique was BOLD or ASL fMRI | 0 |
| 4. Coordinates for a smoking cue > neutral cue contrast were reported | 7 |
| 5. Whole-brain, voxelwise, general-linear-model-based analysis | 8 |
| 6. Type I error rate controlled via FDR or cluster-size-threshold | 0 |
| 7. Activation clusters reported in Talairach or MNI coordinates | 0 |
| 8. Type of software used to convert coordinates to standard space was reported | 0 |
| Exclusion Criteria | |
| 1. Participants were taking smoking-cessation medications at the time of scanning | 0 |
| 2. Smoking and neutral cues were presented during separate scanning sessions | 1 |
| 3. Cues were presented in the background while participants completed a cognitive task | 2 |
| 4. Participants were instructed to suppress craving during smoking cues | 0 |
| 5. Data from the same sample were already included in this meta analysis because they were reported in a different publication | 1 |
| Total Number of Excluded Studies | 25 |
Note: Each candidate study was evaluated by assessing whether it satisfied, in order, the inclusion and exclusion criteria listed here. After a study failed to meet one criterion, it was not listed under other criteria for the purposes of tallying each excluded study only once in this table.
Next, we required that the fMRI scan used either the BOLD or arterial spin labeling (ASL) technique to measure responses to the stimuli (inclusion criterion 3). Because we defined cue reactivity as the difference in fMRI responses between smoking-related and neutral cues, we required that activation coordinates for a smoking > neutral contrast in the fMRI signal be reported (inclusion criterion 4).
Several studies only conducted region of interest (ROI) analysis, limiting their search for smoking > neutral cue reactivity effects to certain brain regions (Artiges et al., 2009; Due et al., 2002; Gloria et al., 2009; Janes et al., 2010; Kozink et al., 2010; McClernon et al., 2005; McClernon et al., 2007b; McClernon et al., 2007a; Moon & Lee, 2009; Okuyemi et al., 2006; Stippekohl et al., 2010; Wilson et al., 2005; Wilson et al., 2008). For this meta-analysis, we were interested in searching the entire brain for areas in which responses to smoking cues differed significantly from neutral cues, because including studies that only searched within specific ROIs has the potential to bias whole-brain meta-analysis toward finding effects in those areas at the expense of other areas. Thus, we only included studies that reported the results of whole-brain, voxelwise analyses (inclusion criterion 5), but did not include ROI analyses.
We also required that the results of the whole-brain analyses were statistically thresholded using established procedures for reducing the Type I error rate (inclusion criterion 6). Adequate thresholds were defined as a whole-brain false discovery rate (FDR) of q < .05 (Genovese et al., 2002), a whole-cluster p < .05 obtained via simulations based on random field theory (Friston et al., 1993; Worsley et al., 1992), or a single-voxel p < .005 combined with a minimum cluster size of 10 contiguous voxels (Lieberman & Cunningham, 2009). Finally, combination of results across studies requires the use of a standard, stereotaxic coordinate system. Thus, we required that the activation clusters be reported in Talairach-Tournoux or Montreal Neurological Institute (MNI) space (inclusion criterion 7) and that the software package used to generate MNI coordinates was reported, so that we could transform these coordinates to Talairach-Tournoux space for meta-analysis (inclusion criterion 8; see Section 2.3, Data extraction).
We limited our meta-analysis to studies where the comparison between smoking and neutral cues was the primary focus of the fMRI procedure. To this end, we excluded studies where the smoking-related and neutral cue were presented during separate fMRI scanning sessions (exclusion criterion 2; Franklin et al., 2007), where the cues were presented in the background while the smokers performed a cognitive task (exclusion criterion 3; Artiges et al., 2009; Luijten et al., 2011; Nestor et al., 2011), and where the smokers were explicitly instructed to suppress their craving while the smoking cues were presented (exclusion criterion 4; Kober et al., 2010). Finally, we excluded the results from one publication because different analyses from the same sample were published in two articles (exclusion criteria 5). We included the original analysis of the fMRI data (Franklin et al., 2011a), excluding the second publication containing follow-up analyses of the same participants (Franklin et al., 2011b).
2.3. Data extraction
We extracted the coordinates of peak activation for each cluster of smoking > neutral fMRI reactivity from the 11 published studies that satisfied all inclusion and exclusion criteria. The references to these studies and the table within the publication from where the coordinates were obtained are reported in Table 2. If the coordinates were reported in MNI space, they were converted to Talairach coordinates using the Lancaster transform (Lancaster et al., 2007). Then, all Talairach coordinates were entered into a database of active clusters that was used as input for the meta-analysis.
Table 2.
Data source, sample size (n), and number of activation foci for all studies included in the meta-analysis.
| Study | Stimulus Type | Stimulus Duration (s) | Data Source | n | Foci |
|---|---|---|---|---|---|
| Non-deprived Smokers | |||||
| McBride et al. (2006) | Videos | 120 | Table 3 | 19 | 5 |
| David et al. (2007)a | Pictures | 5 | Table 1 | 8 | 2 |
| Brody et al. (2007) | Videos | 45 | Table 1 | 42 | 17 |
| McClernon et al. (2008) | Pictures | 4 | Table S6 | 30 | 18 |
| Janes et al. (2009) | Pictures | 4 | Table 1 | 13 | 25 |
| Rubinstein et al. (2011) | Pictures | 18b | Table 2 | 12 | 4 |
| Franklin et al. (2011a) | Videos | 600 | Table 3 | 26 | 1 |
| Hartwell et al. (2011) | Pictures | 24c | Table 1 | 31 | 12 |
| Total | — | 181 | 84 | ||
| Deprived Smokers | |||||
| David et al. (2005) | Pictures | 5 | Table 1 | 9 | 3 |
| Lee et al. (2005) | Pictures | 30 | Table 2 | 8 | 11 |
| David et al. (2007)a | Pictures | 5 | Table 1 | 8 | 2 |
| McClernon et al. (2009) | Pictures | 60d | Table 1 | 18 | 19 |
| Total | — | 43 | 35 | ||
| Totals for pooled analysis | — | 224 | 119 | ||
This study used a within-subjects design, in which the same participants were scanned when non-deprived and when deprived of cigarettes for 12 h. For purposes of the pooled meta-analysis, these two conditions were modeled as independent studies. Thus, the effective sample size for the pooled analysis was 224, even though there were only 216 individual smokers enrolled across all studies.
This study used a blocked design, in which the 18 s stimulation period consisted of consecutive presentation of 3 pictures from the same category for 6 s each. In the study, the data were modeled as a single, 18 s stimulus.
This study used a blocked design, in which the 24 s stimulation period consisted of consecutive presentation of 5 pictures from the same category for 4.8 s each. In the study, the data were modeled as a single, 24 s stimulus.
This study used a blocked design, in which the 60 s stimulation period consisted of consecutive presentation of 10 pictures from the same category for 6 s each. In the study, the data were modeled as a single, 60 s stimulus.
2.4. Pooled meta-analysis
Our primary analysis was a pooled analysis that included data from all studies that satisfied the inclusion and exclusion criteria. We used ALE meta-analysis to generate a statistical parametric map whose values at each voxel represent the degree of spatial convergence of smoking > neutral fMRI effects across studies. Thus, for any voxel in Talairach space, a larger ALE value suggests that smoking > neutral fMRI activity at that voxel is more likely due to a consistent pattern of activation across studies than to random variability between studies.
The ALE statistics and maps were generated using The University of Texas Research Imaging Institute’s GingerALE 2.1b1 (http://www.brainmap.org). Computational details of the ALE meta analysis can be found on the BrainMap website (http://www.brainmap.org/ale/) and in Eickhoff et al. (2009). The computation of ALE scores consisted of two steps. First, a map of Talairach space was created for each study. The values at each voxel in this map, referred to as modeled activation (MA) scores, represented the probability of finding a significant smoking > neutral effect at that location in Talairach space for the specific study modeled in that map. Each reported activation was modeled as a 3-dimensional normal probability distribution centered at the coordinates reported in the publication. The variance of the probability distribution was inversely proportional to the sample size of the study, such that coordinates from larger samples were modeled with more confidence in their location than coordinates from smaller samples. At each voxel in Talairach space, the MA score was computed as the union of the values of these probability distributions. Second, the MA maps for all studies were combined by computing their voxelwise union. This value was used as the ALE statistic for smoking > neutral activation at that voxel, where larger values indicated a greater likelihood of consistent activation in that location across studies.
Statistical inference was carried out on the map of ALE scores by assigning each ALE score a p-value based on the probability of observing a score larger than the same score in an empirical null distribution that was obtained by randomly relocating ALE scores across Talairach space (i.e., simulating the case where there is no systematic relationship between activation coordinates across studies; Eickhoff et al., 2009). The raw p-values were then converted into FDR values, q (Genovese et al., 2002). ALE scores were considered significantly active only where they formed part of a cluster of contiguous voxels with q < .05 spanning an area of at least 200 mm3. Clusters that exceeded this threshold were described using their volume and weighted center-of-mass in Talairach-Tournoux Space. Anatomical labels for the clusters were generated by visually inspecting the ALE images, with the assistance of a computerized version of the Talairach-Tournoux atlas (Lancaster et al., 1997; Lancaster et al., 2000).
2.5. Comparison of non-deprived and deprived smokers
To compare anatomical locations of smoking > neutral cue reactivity between non-deprived smokers and deprived smokers, we used ALE subtraction analysis. Studies were classified according to whether the smokers were non-deprived (i.e., instructed to follow their normal smoking behavior for at least 24 h prior to the scan) or deprived (i.e., instructed not to smoke for a specific period of time before the scan). The subtraction analysis was also conducted in GingerALE 2.1b1, using the method described by Eickhoff et al. (2011). First, separate ALE maps were created for the studies in the non-deprived and deprived conditions. Then, the voxelwise intersection of the statistically significant ALE scores from the two maps was computed across Talairach space. The p-values for the ALE intersection scores were obtained from a null distribution that was generated via 5,000 permutations in which the ALE intersection scores were randomly re-labeled as being from a study of non-deprived smokers or deprived smokers (i.e., simulating the case where there is no systematic difference in activation coordinates between studies using non-deprived or deprived smokers). These p-values were thresholded for statistical significance as described above (i.e., q < .05 with a minimum cluster-size of 200 mm3).
2.6. Comparison of studies that used short and long stimulus durations
The studies included in this meta-analysis had stimulus durations ranging from 4 s-10 min (Table 2). We divided the studies into two subgroups on the basis of stimulus duration. One subgroup (short group) consisted of 5 studies that all used pictures that were presented for 5 s or shorter in an event-related design (David et al., 2005; David et al., 2007; Janes et al., 2009; McClernon et al., 2008). The other subgroup (long group) consisted of 6 studies with stimulus durations of 18 s or longer: Two studies used block designs with several pictures presented in blocks that ranged from 18–60 s (McClernon et al., 2009; Rubinstein et al., 2011), one study used an event-related design with the presentation of individual pictures for 30 s (Lee et al., 2005), and three studies used videos that lasted from 45–600 s (Brody et al., 2007; Franklin et al., 2011a; McBride et al., 2006). In the short group, 21–60 smoking trials and 40–69 neutral trials were presented, and intertrial intervals ranged from 1–22 s. In the long group, 1–4 trials were presented per category, and intertrial intervals ranged from 18–600 s.
An ALE subtraction analysis was used to compare patterns of significant smoking > neutral cue reactivity between the short and long stimulus-duration groups using the computational procedures described above (see Section 2.5, Comparison of Non-Deprived and Deprived Smokers).
3. Results
3.1. Study and participant characteristics
The 11 studies meeting inclusion and exclusion criteria provided a sample size of 216 smokers (51% female). Seven studies reported that 100% of the participants were right-handed, one study reported that 89% were right-handed, one study reported that 82% were right-handed, and three studies did not report the number of right- and left-handed participants. Five studies reported the ethnic background of their participants, with an average of 72% (range 66% – 78%) of the participants in these studies being of European descent. The average age of the sample was 33.3 ± 11.1 years (mean ± SD), and the participants smoked an average of 17.7 ± 6.0 cigarettes per day and their mean score on the Fagerström Test of Nicotine Dependence (provided by all studies except one) was 5.1 ± 1.2, indicating a moderate level of nicotine dependence (Heatherton et al., 1991).
In seven studies, the smokers were non-deprived, and in one study (David et al., 2007), they were scanned both when non-deprived and deprived (i.e., that study used a within-subjects design). Including only the non-deprived condition of David et al. (2007), the effective number of studies for the non-deprived smoker meta-analysis was eight, with a combined sample size of 181 participants. Their mean expired carbon monoxide (CO) level was 17.5 ± 5.1 (CO data were provided by six of the eight studies). In three studies, the smokers were deprived of cigarettes before the scan. Combined with the deprived condition of David et al. (2007), the effective sample for the deprived smoker analysis consisted of four studies with a total of 43 participants. The deprived smokers had a mean CO level of 2.7 ± 0.4 (CO data were provided by three of the four studies). The deprivation intervals in the four studies were 7 h (Lee et al., 2005), 12 h (David et al., 2005; David et al., 2007), and 24 h (McClernon et al., 2009). Finally, it should be noted that, for the pooled meta-analysis, we treated the deprived and non-deprived conditions of David et al. (2007) as separate studies with independent groups of participants, which is a common method of handling within-subjects designs in fMRI meta-analyses (Turkeltaub et al., 2002b; Turkeltaub et al., 2011). Thus, the effective number of studies for the pooled analysis was 12 and the effective sample size was 224. Treating the conditions within this study as independent experiments had little effect on the overall results of the meta-analysis; a parallel set of analyses that excluded both the deprived and non-deprived conditions of this study produced the same pattern of activation clusters as those reported here.
The task used in all studies was a passive-viewing task, in which smokers were instructed to simply watch the cues during the fMRI scan. Pictures were used in eight studies, and videos in three studies. In four of the studies, a nominal forced-attention manipulation was used, in which the participant was asked to press a button if the stimulus contained an animal (Janes et al., 2009; McClernon et al., 2008) or to press a button indicating whether the person depicted in the stimulus was male or female (David et al., 2005; David et al., 2007).
3.2. Pooled meta-analysis
Our primary meta-analysis was the pooled analysis, which included activation coordinates from all 11 studies. This meta-analysis found 44 statistically significant clusters of smoking > neutral activations (Table 3 and Figure 1). Most of these clusters (32%) were located within the extended visual system of the occipital, posterior parietal, and inferior temporal lobes. Other areas with a large concentration of clusters were the cingulate gyrus (18% of all clusters), superior and middle temporal gyri (14% of all clusters), and prefrontal cortex (9% of all clusters). Smaller, but theoretically important, clusters of activation were detected in the insula, dorsal striatum (putamen and globus pallidus), and parahippocampal gyrus. There were also small clusters of activation in primary motor and somatosensory cortices (pre- and post-central gyri, respectively). Overall, there were more active clusters in the left hemisphere (23) than in the right hemisphere (21), and the total volume of these clusters was larger in the left hemisphere (33,424 mm3) than in the right hemisphere (14,600 mm3).
Table 3.
Suprathreshold clusters of Smoking Cue > Neutral Cue fMRI activation from the ALE meta-analysis of all studies.
| Volume | Location (mm)
|
Hem | Brain Area | |||
|---|---|---|---|---|---|---|
| x | y | z | ||||
| 1 | 10776 | −6 | −53 | 24 | L | Posterior Cingulate Gyrus, Precuneus, Cuneus, Lingual Gyrus |
| 2 | 6016 | −1 | 41 | 0 | L | Anterior Cingulate Gyrus, Medial Frontal Gyrus |
| 3 | 4776 | 37 | −72 | −9 | R | Fusiform Gyrus, Middle Occipital Gyrus |
| 4 | 2968 | −15 | 43 | 35 | L | Superior Frontal Gyrus, Middle Frontal Gyrus |
| 5 | 2152 | −12 | −83 | 31 | L | Cuneus |
| 6 | 2104 | −41 | −66 | −16 | L | Cerebellar Declive, Fusiform Gyrus |
| 7 | 2064 | −44 | −70 | 13 | L | Middle Temporal Gyrus |
| 8 | 1536 | 43 | −32 | 4 | R | Superior Temporal Gyrus |
| 9 | 1152 | 9 | −77 | −19 | R | Cerebellar Declive, Lingual Gyrus |
| 10 | 1024 | −5 | 23 | 23 | L | Anterior Cingulate Gyrus |
| 11 | 1000 | 9 | −22 | 24 | R | Posterior Cingulate Gyrus |
| 12 | 984 | 3 | 34 | 18 | R | Anterior Cingulate Gyrus |
| 13 | 912 | −52 | −50 | 24 | L | Supramarginal Gyrus |
| 14 | 832 | 16 | −68 | 43 | R | Precuneus |
| 15 | 776 | 0 | −37 | 59 | L | Paracentral Lobule |
| 16 | 728 | −10 | −69 | −15 | L | Cerebellar Declive, Lingual Gyrus |
| 17 | 704 | −25 | −1 | 63 | L | Superior Frontal Gyrus |
| 18 | 696 | 53 | −63 | 20 | R | Middle Temporal Gyrus |
| 19 | 384 | −12 | −35 | −29 | L | Brain Stem |
| 20 | 384 | 34 | −21 | 57 | R | Precentral Gyrus |
| 21 | 352 | 16 | 47 | 20 | R | Superior Frontal Gyrus |
| 22 | 312 | −46 | −62 | 28 | L | Middle Temporal Gyrus |
| 23 | 288 | −30 | −1 | −7 | L | Putamen |
| 24 | 288 | −27 | −27 | 14 | L | Insula |
| 25 | 288 | −15 | −60 | 61 | L | Superior Parietal Lobule |
| 26 | 280 | −39 | −4 | −23 | L | Middle Temporal Gyrus |
| 27 | 280 | 15 | −82 | 31 | R | Cuneus |
| 28 | 264 | −29 | −79 | 29 | L | Cuneus |
| 29 | 256 | 39 | −49 | −23 | R | Cerebellar Culmen, Fusiform Gyrus |
| 30 | 256 | 5 | −45 | −19 | R | Cerebellar Anterior Lobe |
| 31 | 256 | 29 | −5 | 1 | R | Putamen |
| 32 | 248 | 6 | −76 | 25 | R | Cuneus |
| 33 | 248 | 28 | −28 | 45 | R | Postcentral Gyrus |
| 34 | 240 | 16 | −10 | −5 | R | Globus Pallidus |
| 35 | 240 | 9 | 20 | 31 | R | Anterior Cingulate Gyrus |
| 36 | 224 | −48 | −40 | 7 | L | Middle Temporal Gyrus |
| 37 | 224 | 0 | −16 | 34 | L | Posterior Cingulate Gyrus |
| 38 | 224 | 18 | −37 | 40 | R | Posterior Cingulate Gyrus |
| 39 | 224 | 12 | −52 | 61 | R | Precuneus |
| 40 | 216 | −18 | −22 | −14 | L | Parahippocampal Gyrus |
| 41 | 216 | 24 | −82 | 10 | R | Cuneus |
| 42 | 216 | −30 | −34 | 52 | L | Postcentral Gyrus |
| 43 | 216 | 0 | −10 | 64 | L | Medial Frontal Gyrus |
| 44 | 200 | 12 | −91 | 7 | R | Cuneus |
Note: Cluster volume is measured in mm3. Cluster location refers to the weighted center of mass of each cluster, measured in Talairach coordinates. Hem = Hemisphere, L = Left, R = Right.
Figure 1.
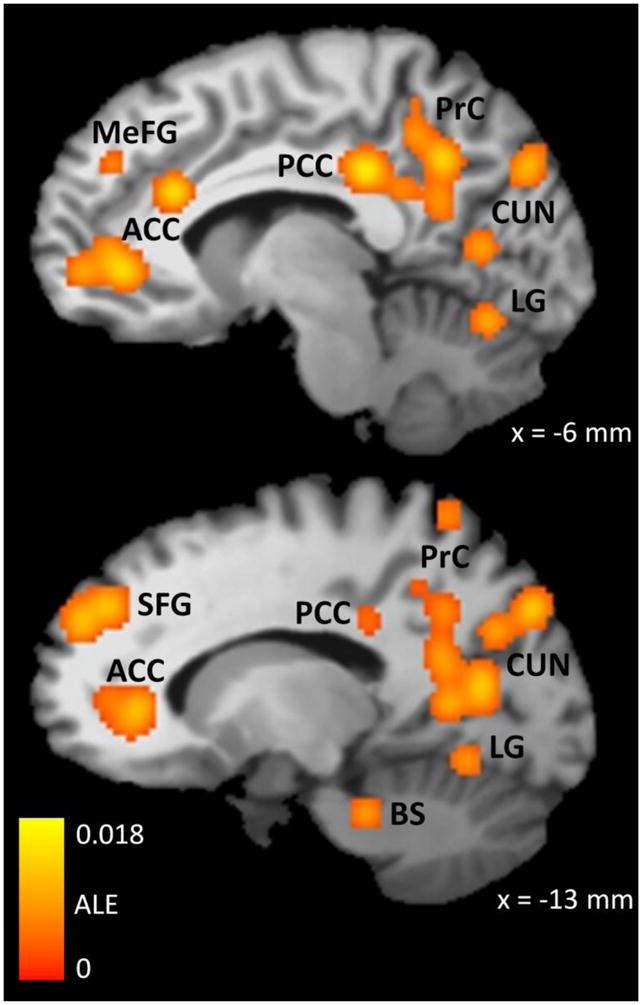
Brain regions where the Smoking Cue > Neutral Cue contrast was consistently significant across fMRI studies, as determined by ALE meta-analysis. The color map indicates the value of the ALE statistic in regions that were found to be significantly active using a whole-brain false discovery rate of q < .05 and a minimum cluster size of 200 mm3. These data were obtained from 12 experiments in which cigarette smokers (n = 224) viewed smoking-related and neutral pictures or videos during an fMRI scan. ACC = Anterior Cingulate Cortex, MeFG = Medial Frontal Gyrus, PCC = Posterior Cingulate Cortex, PrC = Precuneus, CUN = Cuneus, LG = Lingual Gyrus, SFG = Superior Frontal Gyrus, BS = Brainstem, ALE = Activation Likelihood Estimate. The x coordinate refers to the placement of the sagittal slice in Talairach-Tournoux space, where negative coordinates indicate the left side of the brain.
3.3. Comparison of non-deprived and deprived smokers
To compare the patterns of significant smoking cue > neutral cue fMRI activation between studies of non-deprived and deprived smokers, we conducted a subtraction meta-analysis (Table 4 and Figure 2). This analysis found evidence of more reliable smoking cue > neutral cue fMRI activation in deprived smokers than non-deprived smokers in three locations. The first cluster was located in the inferior occipital cortex — primarily the lingual gyrus, but the cluster also extended into adjacent regions of the superior cerebellum. The other two clusters were located in the superior frontal gyrus. There were no areas where smoking cue > neutral cue fMRI activation was more reliable in non-deprived smokers than in deprived smokers.
Table 4.
Suprathreshold clusters of Smoking Cue > Neutral Cue fMRI activation from the ALE subtraction analysis comparing studies of deprived and non-deprived smokers
| Volume | Location (mm)
|
Hem | Brain Area | |||
|---|---|---|---|---|---|---|
| x | y | z | ||||
| Deprived > Non-deprived | ||||||
| 1 | 2296 | 8 | −78 | −18 | R | Cerebellar Declive, Cerebellar Pyramis, Lingual Gyrus |
| 2 | 1096 | −15 | 52 | 29 | L | Superior Frontal Gyrus |
| 3 | 344 | −33 | 48 | 26 | L | Superior Frontal Gyrus |
| Non-deprived > Deprived | ||||||
| No suprathreshold clusters | ||||||
Note: Cluster volume is measured in mm3. Cluster location refers to the weighted center of mass of each cluster, measured in Talairach coordinates. Hem = Hemisphere, L = Left, R = Right.
Figure 2.
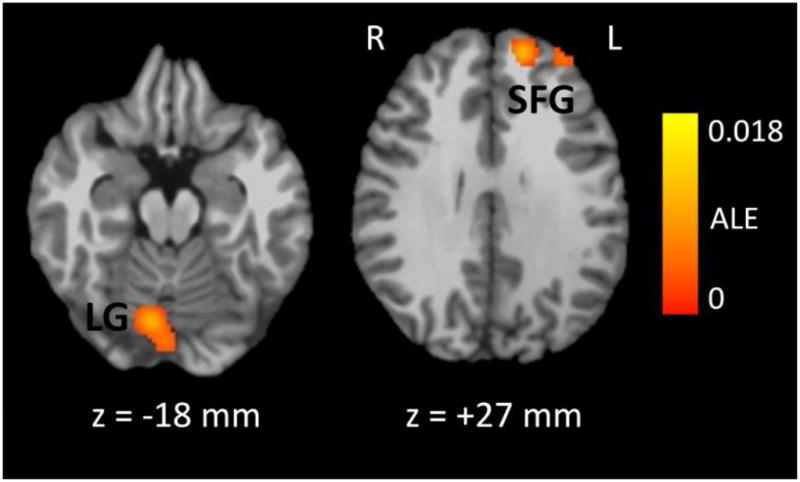
Brain regions where the Smoking Cue > Neutral Cue contrast was more reliably significant in studies of non-deprived smokers than in studies of deprived smokers, as determined by subtraction ALE meta-analysis. The color map indicates the value of the ALE difference score between the deprived and non-deprived conditions in regions that were found to be significantly active using a whole-brain false discovery rate of q < .05 and a minimum cluster size of 200 mm3. These data were obtained from 8 studies of non-deprived smokers (n = 181) and 4 studies of deprived smokers (n = 43) who viewed smoking-related and neutral pictures or videos during an fMRI scan. LG = Lingual Gyrus, SFG = Superior Frontal Gyrus, ALE = Activation Likelihood Estimate, R = Right, L = Left. The z coordinate refers to the placement of the axial slice in Talairach-Tournoux space, where negative coordinates are inferior to the plane connecting the anterior and posterior commissures.
Examination of the results of separate meta-analyses of studies of non-deprived smokers (Supplementary Table 1) and deprived smokers (Supplementary Table 2) supported the results of the subtraction analysis. The pattern of significantly active clusters from the two individual meta-analyses was highly similar to the results from the pooled analysis, with the majority of active clusters located within the extended visual system: 16 of 40 activation clusters (40%) for the non-deprived smokers and 11 of 28 activation clusters (39%) for the deprived smokers. Consistent with the findings from the subtraction analysis, a greater proportion of active clusters were located within the prefrontal cortex for the deprived smokers (29%) than for the non- deprived smokers (10%). Similarly, the total size of the clusters in the prefrontal cortex was larger for the deprived-smokers (5,512 mm3) than the non-deprived smokers (1,496 mm3).
Although not detected by the subtraction analysis, there appeared to be a larger number of active clusters in the dorsal striatum and insula in deprived smokers than in non-deprived smokers (for all other brain regions, comparable clusters emerged in the pooled analysis and in the individual analyses of both groups). The clusters located in the left insula (640 mm3) and left (640 mm3) and right (704 mm3) putamen, both of which were statistically significant in the pooled analysis, were also statistically significant in the analysis of deprived smokers but not in the analysis of non-deprived smokers. However, the ALE difference scores for the clusters in the insula and putamen did not approach statistical significance in the subtraction analysis (single-voxel ps > .17 for left putamen and ps > .33 for right putamen and left insula).
3.4. Comparison of studies that used short and long stimulus durations
We also used subtraction ALE meta-analysis to compare patterns of significant smoking cue > neutral cue fMRI activation between studies that used short (≤ 5 s) or long (≥ 18 s) stimulus durations (Table 5 and Figure 3). This analysis found evidence of more reliable smoking cue > neutral cue fMRI activation in the short group than in the long group in the left and right fusiform gyri. There were no areas where smoking cue > neutral cue fMRI activation was more reliable in the long group than in the short group.
Table 5.
Suprathreshold clusters of Smoking Cue > Neutral Cue fMRI activation from the ALE subtraction analysis comparing studies that used short and long stimulus durations
| Volume | Location (mm)
|
Hem | Brain Area | |||
|---|---|---|---|---|---|---|
| x | y | z | ||||
| Short-Duration Stimuli > Long-Duration Stimuli | ||||||
| 1 | 1280 | −43 | −67 | −13 | L | Fusiform Gyrus |
| 2 | 208 | 40 | −73 | −13 | R | Fusiform Gyrus |
| Long-Duration Stimuli > Short-Duration Stimuli | ||||||
| No suprathreshold clusters | ||||||
Note: Cluster volume is measured in mm3. Cluster location refers to the weighted center of mass of each cluster, measured in Talairach coordinates. Hem = Hemisphere, L = Left, R = Right. Short-duration stimuli lasted 5 s or less, and there were 5 studies in this group. Long-duration stimuli lasted 18 s or longer, and there were 7 studies in this group.
Figure 3.
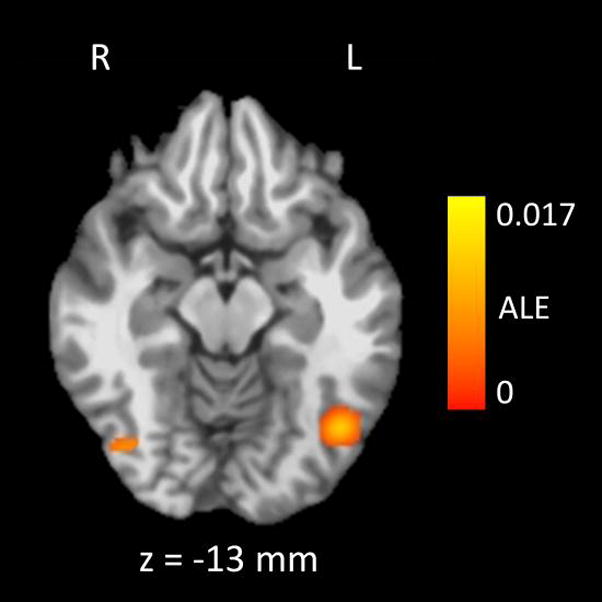
In the bilateral fusiform gyri, the Smoking Cue > Neutral Cue contrast was more reliably significant in studies that used short stimulus presentation times (≤ 5 s) than in studies that used long stimulus presentation times (≥ 18 s), as determined by subtraction ALE meta-analysis. The color map indicates the value of the ALE difference score between the two groups of studies in regions that were found to be significantly active using a whole-brain false discovery rate of q < .05 and a minimum cluster size of 200 mm3. There were 5 studies (n = 68) that used short stimulus presentation times, and 7 studies that used long stimulus presentation times (n = 156). ALE = Activation Likelihood Estimate, R = Right, L = Left. The z coordinate refers to the placement of the axial slice in Talairach-Tournoux space, where negative coordinates are inferior to the plane connecting the anterior and posterior commissures.
The results of the separate meta-analyses for the short and long groups are presented in Supplementary Tables 3 and 4. The results of these meta-analyses resembled those of the pooled analysis. The total number and volume of active clusters was similar across both groups. For the short group, there were 38 clusters with a total volume of 27,136 mm3. For the long group, there were 29 clusters with a total volume of 28,208 mm3. Similar to the pooled analysis, most active clusters were located in the extended visual system (39% of clusters in the short group and 38% of clusters in the long group), cingulate gyrus (18% of clusters in the short group and 17% of clusters in the long group), and prefrontal cortex (13% of clusters in the short group and 10% of clusters in the long group).
4. Discussion
We used ALE meta-analysis to search for brain regions that showed the most consistent responses to smoking-related cues across several fMRI studies. The meta-analysis revealed that several brain areas show consistently greater activation in response to smoking cues than neutral cues, and that these areas are located primarily within the extended visual system of the occipital, inferior temporal, and posterior parietal lobes, and in the cingulate gyrus and prefrontal cortex. We also completed two ALE subtraction analyses. The first found that smoking > neutral cue reactivity was more consistently found in the lingual gyrus and superior frontal gyrus in studies of deprived smokers than in studies of non-deprived smokers. The second found that smoking > neutral cue reactivity was more consistently found in the fusiform gyrus in studies that used short stimulus durations than in studies that used long stimulus durations. When placed into the broader context of the role of these brain regions in cognition, emotion, and behavior, the results of this meta-analysis have important implications for the study of tobacco addiction.
4.1. Possible roles of these brain areas in cue reactivity
In the meta-analysis, the extended visual system (lingual gyrus, fusiform gyrus, and cuneus) emerged as an area that was consistently more reactive to smoking cues than neutral cues. Previous fMRI studies comparing emotionally arousing stimuli to neutral stimuli have found that the emotionally arousing stimuli consistently evoke larger responses than neutral stimuli in these brain regions, a finding that has been interpreted as increased allocation of attentional resources to the processing of the arousing stimuli (Bradley et al., 2003; Lang et al., 1998; Sabatinelli et al., 2007). Thus, the finding of consistently larger fMRI responses to smoking cues than neutral cues in these regions may also be due to increased allocation of attention to the smoking cues. It also appears that more resources may be allocated to the processing of smoking cues when smokers are deprived of nicotine, as the subtraction meta-analysis found that a region in the lingual gyrus was more consistently activated in deprived smokers than in non-deprived smokers. Indeed, long-term drug use may result in the attribution of excessive incentive salience to drug cues (Robinson & Berridge, 2003), especially under conditions of deprivation (Drummond, 2000; Grimm et al., 2001; Robinson & Berridge, 2008), which leads to a perceptual bias toward these cues (Everitt & Robbins, 2005; Koob & LeMoal, 2001; Robinson & Berridge, 2008; Volkow et al., 2010). Interestingly, these theories have not explicitly argued for a role of the extended visual system in this process, focusing instead on the brain’s reward pathway. Our findings suggest that one mechanism by which an addict’s attention is biased toward visual drug cues may be via increased activation in the extended visual system in response to these cues, and these areas should thus be regions of interest in future cue reactivity studies.
We also found that the fusiform gyrus, part of the extended visual system, was more consistently activated in studies that used short stimulus durations than in studies that used long stimulus durations. A similar effect has been previously observed in a study that directly compared differences in fMRI responses to pleasant and neutral stimuli between blocked and event-related designs. Buhler and colleagues (2008) found more activation during pleasant stimuli in the inferior occipital cortex in the event-related design than in the blocked design, and attributed the greater responsiveness of these areas during event-related designs to their involvement in the immediate processing of stimuli. Thus, another role for the extended visual system in cue reactivity may be in the immediate classification of drug cues as motivationally significant, which is a phenomenon more easily detected in event-related designs that use short stimulus durations and many trials.
Another area that showed large and consistent activation in our meta-analysis, but that has received little attention in theories of the neurobiology of addiction, is the precuneus. The precuneus and adjacent posterior cingulate cortex, which was also an area where some of the largest effects were observed in our meta-analysis, have both been implicated in memory retrieval, attentional tracking of stimuli, and in the preparation of motor behaviors directed at these stimuli (Cavanna & Trimble, 2006). Thus, the strong responses to smoking cues in the precuneus may be reflective of the smokers’ attentional bias toward the smoking cues, and possibly related to preparing for the physical act of smoking in response to these stimuli. Furthermore, the precuneus is directly connected with other brain regions that we found to be consistently reactive to smoking cues in this meta-analysis — the posterior and anterior cingulate cortices, the dorsal prefrontal cortex, the superior and inferior parietal lobules, the dorsal striatum (caudate and putamen), and the claustrum/insula (Cavada & Goldman-Rakic, 1989; Goldman-Rakic, 1988; Petrides & Pandya, 1984; Selemon & Goldman-Rakic, 1988). Thus, an important role of the precuneus in cue reactivity may be to integrate information about smoking cues in the environment that are processed in the extended visual system and relay that information to areas associated with motivated behavior and choice in the anterior cingulate cortex, prefrontal cortex, and striatum. This hypothesis, though intriguing, is speculative, but suggests that the precuneus may be another important region of interest for future studies of cue reactivity.
The meta-analysis also found reliable smoking cue > neutral cue activation in the anterior cingulate cortex and dorsal and medial prefrontal cortices, and the activation in the superior frontal gyrus was more reliable and covered a larger volume in the studies of deprived smokers than in the studies of non-deprived smokers. The dorsal and medial prefrontal cortices and the anterior cingulate gyrus are thought to be important in addictive behavior for two reasons. First, they are the final projections of the mesocorticolimbic dopamine system, the brain’s central reward pathway that is directly activated by all drugs of abuse (Goldstein & Volkow, 2002; Jentsch & Taylor, 1999). Through their connections with the motor circuits of the frontal cortex, the anterior cingulate and dorsal and medial prefrontal cortices may thus be important in the initiation of drug-seeking behavior in response to drug cues. Second, the dorsal prefrontal cortex and anterior cingulate cortex are important structures in the expression of executive functions, such as the exertion of inhibitory control over behavior (Lubman et al., 2004). Reactivity of these areas to drug cues may therefore reflect a process that the smokers were using to resist their urge to smoke in the presence of the cues. Although we only included studies where the participants were not formally instructed to suppress their urge or craving to smoke, there is a chance that some of the participants were suppressing their urge, given the prohibition of immediately smoking a cigarette in response to the cues while in the MRI scanner and the finding that anterior cingulate activation in response to smoking cues increases under conditions where the smokers are instructed to suppress their craving (Brody et al., 2007; Culbertson et al., 2011; Hartwell et al., 2011). It must be noted the current meta-analysis does not allow us to distinguish between the role of the anterior cingulate and prefrontal cortices in drug seeking vs. inhibitory control over craving; both explanations are equally plausible with the included data sets. However, regardless of the processes underlying their activation, the results of the meta-analysis provide further support for the importance of the anterior cingulate and prefrontal cortex in addictive behavior.
In the pooled meta-analysis, we found a small cluster of activation located within the left insula. Recently, the insula has been implicated in several studies of cigarette addiction. First, some smokers who suffered selective damage to the insula as a result of a stroke were able to quit smoking with ease, and reported that they no longer craved cigarettes (Naqvi et al., 2007). Second, an fMRI study using the insula as a region of interest found that the degree of pre-quit smoking cue > neutral cue reactivity in the insula was predictive of “slips” during an 8-week smoking-cessation intervention (Janes et al., 2010). Third, in rats, inactivation of the insula disrupted nicotine self-administration and cue-induced reinstatement of self-administration (Forget et al., 2010). Fourth, fMRI responses in the insula during an attentional bias task were positively correlated with self-reported craving (Luijten et al., 2011). The insula has been shown to be important in interoception (Craig, 2002) and taste perception (Pritchard et al., 1999), and may thus be involved in perception of cue-evoked conditioned responses, resulting in a subjective craving for cigarettes (Naqvi & Bechara, 2009; Naqvi & Bechara, 2010). These results suggest that the insula may be an important neuroanatomical substrate of the relapse process.
Similar to our findings in the insula, we found evidence of a small cluster of activation in the dorsal striatum (i.e., putamen) in the pooled meta-analyses. The dorsal striatum is innervated by dopaminergic neurons from the substantia nigra, largely independent of the mesocorticolimbic dopamine system that projects from the ventral tegmental area to the nucleus accumbens and medial prefrontal cortex. Although the latter system has received the most attention (Koob & LeMoal, 2001; Robinson & Berridge, 2003; Volkow et al., 2010), there is also evidence of dorsal striatal involvement in addictive behavior (McClernon et al., 2009; Volkow et al., 2006; Wilson et al., 2008). Specifically, the dorsal striatum, which is involved in habit learning (Jog et al., 1999), is thought to control the “automatic” aspects of drug-taking behavior (Everitt et al., 2008) such as smoking a cigarette in the presence of cues without consciously attending to the cues. Thus, our finding of a significant activation cluster in the putamen may reflect this automatic processing of the smoking cues.
4.2. Potential Limitations
Meta-analysis of fMRI data has several limitations that must be considered. First, ALE is a localization technique — it provides information about where the most consistent patterns of activation are located in the brain, but does not provide an estimate of the magnitude of the contrast of interest. Thus, active clusters reported in this study should be interpreted as reliably showing larger responses to smoking cues than to neutral cues across studies, but the volume and number of active clusters in each region should not be interpreted in terms of that region having a larger difference in BOLD response between smoking cues and neutral cues; the magnitude of the smoking cue > neutral cue effect is independent of its spatial localization in the meta-analysis. Rather, larger volumes and greater numbers of active clusters in the meta-analysis results should be interpreted in terms of those regions being reported as significantly active across more studies than areas with smaller volumes, regardless of the size of the smoking cue > neutral cue effect. Second, the process of converting fMRI data into standard, stereotaxic coordinates varies considerably across studies, which can result in misidentification of brain regions in the meta-analysis, especially near the edges of the cerebral cortex (Lancaster et al., 2007). This is perhaps why the clusters of activation in the lingual and fusiform gyri extended into the cerebellum, even though no cerebellar activation was reported in the original studies. Thus, the anatomical locations reported here should be treated as approximations, not as an absolute. Third, there were only four studies that used deprived smokers while eight studies used non-deprived smokers, which led to unbalanced groups in the subtraction meta-analysis. The technique of ALE subtraction analysis is new (Eickhoff et al., 2011), and the effect of unbalanced groups on subtraction analysis results has not yet been determined. Thus, it would be prudent to treat the results of the subtraction analysis comparing deprived and non-deprived smokers as exploratory. It is important to note that no such caveat is needed for the results of the pooled meta-analysis, which used a well-validated technique (Eickhoff et al., 2009; Farrell et al., 2005; Laird et al., 2005; Liu et al., 2011; Price et al., 2005; Sabatinelli et al., 2011; Turkeltaub et al., 2002a; Turkeltaub et al., 2011).
In addition to the limitations posed by the meta-analytic technique, other limitations arise from the selection of studies for meta-analysis. Of the 36 studies we identified in our literature search, 25 were excluded as not being suitable for meta-analysis. Thus, the current meta-analysis does not capture a sizeable portion of the smoking cue-reactivity literature, which raises the possibility that brain areas other than those reported here may be involved in cue reactivity. Most of the exclusions came from the lack of a direct comparison between smoking cues and neutral cues (7 studies) and the use of a region-of-interest (ROI) analysis instead of a whole-brain voxelwise analysis (8 studies). The former set of inclusions is justified in terms of the common definition of cue reactivity as the difference in response between a drug cue and a neutral cue, as well as the inherent subtraction logic used in fMRI that requires a well-defined baseline (in this case, neutral cues) against which to compare the stimuli of interest (smoking cues).
Exclusion based on the use of an ROI analysis is justified because ALE meta-analysis searches all of Talairach space when estimating the likelihood that reported activations are statistically reliable across studies. If activation coordinates from studies that searched only a limited part of the brain were included in the meta-analysis, there is a strong possibility that the results would have been biased toward finding significant activation clusters within the ROIs at the expense of regions outside of the ROIs. It should be noted, however, that the pattern of activations revealed by our meta-analysis is consistent with the ROIs that were found to have significantly larger BOLD responses to smoking cues than neutral cues in the ROI studies (Due et al., 2002; Janes et al., 2010; McClernon et al., 2005; McClernon et al., 2007b; Moon & Lee, 2009; Okuyemi et al., 2006; Stippekohl et al., 2010), which mitigates the interpretational difficulty that arises from our exclusion of these studies.
The use of strict inclusion and exclusion criteria may also explain why we found a larger number of active clusters than previous meta-analyses of cue reactivity. In our pooled analysis, there were 44 significantly active clusters, whereas the previous meta-analyses, using comparable statistical thresholds, reported 8 (Chase et al., 2011) and 6 (Kuhn & Gallinat, 2011) significantly active clusters for the comparison between drug-related and control cues. The studies included in these meta-analyses varied more in methodology than the studies included in our meta-analysis. For example, Chase et al. (2011) pooled the results across different drugs of abuse and even included gambling addiction. Both of the previous meta-analyses included PET studies in addition to fMRI studies, and also included studies where the cues were not pictures or videos or where the drug-related and control cues were presented in separate sessions. Thus, there may have been greater variability among the locations of activation foci in the studies included in the previous meta-analyses compared to those included in our meta-analysis, which would lead to smaller ALE values and fewer significantly active clusters. It should be noted, however, that although we found a large number of clusters, they were confined to a limited number of anatomical regions. Most clusters were located within the extended visual system, cingulate gyrus, and prefrontal cortex. Importantly, these areas were reported as active clusters in the previous meta-analyses (Chase et al., 2011; Kuhn & Gallinat, 2011). Thus, our results are consistent with previous findings, but extend those findings by providing more detail about brain regions that show cue reactivity in a specific — but frequently used — type of paradigm that involves passive viewing of smoking-related pictures or videos.
4.3. Implications for the study of cue reactivity
Our findings have several implications for the study of smoking cue reactivity. First, the active clusters from the meta-analysis, for the most part, agree with major theories of addiction. The pooled meta-analysis revealed that some of the regions that are most reliably activated in fMRI studies of smoking cue reactivity are the same as the regions that are thought to be important in the development and maintenance of addictive behavior — the anterior cingulate cortex, the prefrontal cortex, and the insula.
But, there are two ways in which our results depart from addiction theory. First, the areas that we found to be most reliably activated across studies of smoking cue reactivity were in the precuneus and the extended visual system, which have not been the focus of neurobiological studies of addiction. In light of these results, it may be necessary to consider a greater role for the extended visual cortex in directing attention toward drug cues and the precuneus in integrating information about cues in the environment with previously learned associations involving those cues and relaying that information to the prefrontal cortex. It may also be worthwhile to examine the relationship between cue reactivity effects in these regions and factors such as nicotine dependence, withdrawal symptom severity, and the probability of relapse during quit attempts. If cue reactivity in the extended visual system and precuneus is related to relapse, a promising strategy for developing more effective therapies for nicotine dependence may be to use fMRI to determine whether new medications reduce cue reactivity in these areas.
Second, we did not find any evidence of reliable smoking cue > neutral cue activation across fMRI studies in the ventral striatum. The ventral striatum (nucleus accumbens and ventral pallidum) receives dopaminergic input from the ventral tegmental area of the midbrain. Animal models have shown that that dopamine release in the nucleus accumbens is increased in response to all drugs of abuse, including nicotine (e.g., Nisell et al., 1994), and also in response to drug cues (Phillips et al., 2003). Also, fMRI studies using the ventral striatum as a region of interest have found evidence of a significant smoking cue > neutral cue effect (David et al., 2005; David et al., 2007; Due et al., 2002; Franklin et al., 2007). Furthermore, both of the previous meta-analyses of cue reactivity found significant cue reactivity effects in the ventral striatum (Chase et al., 2011; Kuhn & Gallinat, 2011). Thus, our lack of a significant effect in the ventral striatum in this meta-analysis is not because this area is unimportant in cue reactivity, but rather likely arises for technical reasons. The ventral striatum is small and therefore does not easily survive the cluster-size threshold used for statistical inference in whole-brain fMRI analyses. Thus, a larger number of studies may have been required for us to find a significant effect in the ventral striatum. The other meta-analyses included more studies, which likely made it easier for the ventral striatum to survive the statistical thresholding procedure. Finally, the inclusion of PET studies may have increased the likelihood of finding significant effects in the ventral striatum. The ventral striatum is located near the air-tissue interface on the inferior side of the brain, which means that it is frequently contaminated by artifacts when acquiring whole-brain fMRI images. PET images are not affected by this type of artifact.
Another interesting result that emerged from our meta-analysis was the lack of major differences in active brain regions between studies of deprived smokers and non-deprived smokers. The only differences that we observed were in the lingual gyrus and the superior frontal gyrus, and the size of these effects was modest (voxelwise p-values for the peak ALE scores ranged from .019 to .009). At first glance, this might suggest that deprivation is not an important factor in determining brain responses to smoking cues. However, there were only four studies of deprived smokers in this meta-analysis, all using small sample sizes and relatively short lengths of deprivation (7–24 h), which likely made it difficult to consistently observe differences from the much larger sample of non-deprived smokers. Also, the participants in these studies were not trying to quit smoking. Thus, future studies using fMRI to examine brain responses to smoking cues in deprived smokers who are trying to quit are necessary. In fact, studies of this population are necessary for understanding the neurobiology of cue-induced relapse, because relapse occurs, by definition, under conditions of deprivation in people who are trying to quit smoking.
In addition to deprived smokers, control groups of nonsmokers appear to be understudied. A fundamental assumption of addiction theory is that cue reactivity should only be observed in addicts (Everitt & Robbins, 2005; Glautier & Tiffany, 1995; Koob & LeMoal, 2001; Robinson & Berridge, 2003; Volkow et al., 2004). We could not test this assumption using meta-analysis because only 2 of the studies that satisfied all inclusion and exclusion criteria included groups of non-smokers, and neither study reported any coordinates where nonsmokers showed more cue reactivity than smokers (David et al., 2005; Rubinstein et al., 2011). Seven of the studies that we excluded from this meta-analysis also included nonsmokers, and across these studies there was also no reliable evidence of cue reactivity in nonsmokers (Artiges et al., 2009; Due et al., 2002; Goudriaan et al., 2010; Luijten et al., 2011; Nestor et al., 2011; Okuyemi et al., 2006; Stippekohl et al., 2010). Thus, cue reactivity does appear to be specific to smokers, but inclusion of nonsmokers in future studies should be considered so that this critical assumption can be evaluated quantitatively across large populations using meta-analysis.
An important implication for the study of cue reactivity also arises from the considerable variability in cue reactivity procedures that we observed across studies when searching the literature. This variability is likely one of the reasons why hundreds of distinct brain regions have been reported to be involved in cue reactivity. By collapsing across studies, we were able to narrow this extensive list of brain regions down to the most consistently active regions, which also agreed with the regions that have been proposed by theory as being important in the expression of cue reactivity. Our meta-analysis thus demonstrates the importance of combining results across fMRI studies — these studies consist of small, homogeneous samples, and an ideal way to provide an accurate estimate of brain reactivity in the general population of smokers is via the combination of these small samples into a large sample through meta-analysis. Unfortunately, meta-analysis is not able to eliminate all of the important differences between studies (as can be seen by considering the wide range of stimulus duration, interstimulus intervals, and number of stimuli used in the studies that were included in the meta-analysis), and these differences are sometimes reflected in brain activity (as can be seen in the results of our comparison between studies that used short or long stimulus durations). Thus, researchers should consider implementing a common standard for the selection of stimuli and stimulus presentation parameters for fMRI studies of cue reactivity to facilitate further combination of results, which may offer a more complete model of cue reactivity (cf. Glautier & Tiffany, 1995). In fact, several standardized sets of smoking-related and neutral control stimuli have been developed (Carter et al., 2006; Gilbert & Rabinovich, 1999; Grusser et al., 2000), and consistent use of these stimuli across studies may increase the feasibility of future meta-analyses.
In conclusion, the results of this meta-analysis suggest that fMRI is a reliable measure of reactivity to smoking cues, producing replicable patterns of results across studies. These results can be extended by further considering the role of the extended visual system and precuneus in cue reactivity, by increasing the study of deprived smokers and nonsmokers, and by using standard procedures across fMRI studies to enable more studies to be combined in future meta-analyses.
Supplementary Material
Meta-analysis of 11 fMRI studies of cigarette cue reactivity
Compared cigarette and neutral cues, deprived and non-deprived smokers
Larger responses to cigarette cues in posterior parietal cortex and cingulate gyrus
Deprived smokers had larger responses in dorsal prefrontal cortex
These areas may be important neuroanatomical substrates of tobacco addiction
Acknowledgments
The completion of this meta-analysis was supported, in part, by a cancer prevention fellowship to Jeffrey M. Engelmann, supported by the National Cancer Institute grant R25-T CA057730, Shine Chang, Ph.D., Principal Investigator, and through MD Anderson’s Cancer Center Support Grant, CA016672. Dr. Cinciripini has served on the scientific advisory board of Pfizer Pharmaceuticals, has received grant support from Pfizer, and has conducted educational talks sponsored by Pfizer on smoking cessation for physicians.
Footnotes
The other authors declare no conflict of interest.
Publisher's Disclaimer: This is a PDF file of an unedited manuscript that has been accepted for publication. As a service to our customers we are providing this early version of the manuscript. The manuscript will undergo copyediting, typesetting, and review of the resulting proof before it is published in its final citable form. Please note that during the production process errors may be discovered which could affect the content, and all legal disclaimers that apply to the journal pertain.
References
- Artiges E, Ricalens E, Berthoz S, Krebs MO, Penttila J, Trichard C, Martinot JL. Exposure to smoking cues during an emotion recognition task can modulate limbic fMRI activation in cigarette smokers. Addictive Biology. 2009;14:469–477. doi: 10.1111/j.1369-1600.2009.00167.x. [DOI] [PubMed] [Google Scholar]
- Azizian A, Monterosso J, O’Neill J, London ED. Magnetic resonance imaging studies of cigarette smoking. Handb Exp Pharmacol. 2009:113–143. doi: 10.1007/978-3-540-69248-5_5. [DOI] [PubMed] [Google Scholar]
- Bradley MM, Sabatinelli D, Lang PJ, Fitzsimmons JR, King W, Desai P. Activation of the visual cortex in motivated attention. Behavior Neuroscience. 2003;117:369–80. doi: 10.1037/0735-7044.117.2.369. [DOI] [PubMed] [Google Scholar]
- Brody AL, Mandelkern MA, Olmstead RE, Jou J, Tiongson E, Allen V, Scheibal D, London ED, Monterosso JR, Tiffany ST, Korb A, Gan JJ, Cohen MS. Neural substrates of resisting craving during cigarette cue exposure. Biological Psychiatry. 2007;62:642–651. doi: 10.1016/j.biopsych.2006.10.026. [DOI] [PMC free article] [PubMed] [Google Scholar]
- Buhler M, Vollstadt-Klein S, Klemen J, Smolka MN. Does erotic stimulus presentation design affect brain activation patterns? Event-related vs blocked fMRI designs. Behav Brain Funct. 2008;4:30. doi: 10.1186/1744-9081-4-30. [DOI] [PMC free article] [PubMed] [Google Scholar]
- Carter BL, Robinson JD, Lam CY, Wetter DW, Day SX, Tsan JY, Cinciripini PM. A psychometric evaluation of cigarette stimuli used in a cue reactivity study. Nicotine & Tobacco Research. 2006;8:361–369. doi: 10.1080/14622200600670215. [DOI] [PubMed] [Google Scholar]
- Carter BL, Tiffany ST. Meta-analysis of cue-reactivity in addiction research. Addiction. 1999;94:327–340. [PubMed] [Google Scholar]
- Cavada C, Goldman-Rakic PS. Posterior parietal cortex in rhesus monkey: II. Evidence for segregated corticocortical networks linking sensory and limbic areas with the frontal lobe. The Journal of Comparative Neurology. 1989;287:422–445. doi: 10.1002/cne.902870403. [DOI] [PubMed] [Google Scholar]
- Cavanna AE, Trimble MR. The precuneus: a review of its functional anatomy and behavioural correlates. Brain. 2006;129:564–583. doi: 10.1093/brain/awl004. [DOI] [PubMed] [Google Scholar]
- Chase HW, Eickhoff SB, Laird AR, Hogarth L. The neural basis of drug stimulus processing and craving: an activation likelihood estimation meta-analysis. Biological Psychiatry. 2011;70:785–793. doi: 10.1016/j.biopsych.2011.05.025. [DOI] [PMC free article] [PubMed] [Google Scholar]
- Craig AD. How do you feel? Interoception: the sense of the physiological condition of the body. Nature Reviews Neuroscience. 2002;3:655–666. doi: 10.1038/nrn894. [DOI] [PubMed] [Google Scholar]
- Culbertson CS, Bramen J, Cohen MS, London ED, Olmstead RE, Gan JJ, Costello MR, Shulenberger S, Mandelkern MA, Brody AL. Effect of Bupropion Treatment on Brain Activation Induced by Cigarette-Related Cues in Smokers. Archives of General Psychiatry. 2011;68:505–515. doi: 10.1001/archgenpsychiatry.2010.193. [DOI] [PMC free article] [PubMed] [Google Scholar]
- David SP, Munafo MR, Johansen-Berg H, Mackillop J, Sweet LH, Cohen RA, Niaura R, Rogers RD, Matthews PM, Walton RT. Effects of Acute Nicotine Abstinence on Cue-elicited Ventral Striatum/Nucleus Accumbens Activation in Female Cigarette Smokers: A Functional Magnetic Resonance Imaging Study. Brain Imaging and Behavior. 2007;1:43–57. doi: 10.1007/s11682-007-9004-1. [DOI] [PMC free article] [PubMed] [Google Scholar]
- David SP, Munafo MR, Johansen-Berg H, Smith SM, Rogers RD, Matthews PM, Walton RT. Ventral striatum/nucleus accumbens activation to smoking-related pictorial cues in smokers and nonsmokers: a functional magnetic resonance imaging study. Biological Psychiatry. 2005;58:488–494. doi: 10.1016/j.biopsych.2005.04.028. [DOI] [PMC free article] [PubMed] [Google Scholar]
- Drummond DC. What does cue-reactivity have to offer clinical research? Addiction. 2000;95(Suppl 2):S129–S144. doi: 10.1080/09652140050111708. [DOI] [PubMed] [Google Scholar]
- Due DL, Huettel SA, Hall WG, Rubin DC. Activation in mesolimbic and visuospatial neural circuits elicited by smoking cues: evidence from functional magnetic resonance imaging. American Journal of Psychiatry. 2002;159:954–960. doi: 10.1176/appi.ajp.159.6.954. [DOI] [PubMed] [Google Scholar]
- Eickhoff SB, Bzdok D, Laird AR, Roski C, Caspers S, Zilles K, Fox PT. Co-activation patterns distinguish cortical modules, their connectivity and functional differentiation. Neuroimage. 2011;57:938–949. doi: 10.1016/j.neuroimage.2011.05.021. [DOI] [PMC free article] [PubMed] [Google Scholar]
- Eickhoff SB, Laird AR, Grefkes C, Wang LE, Zilles K, Fox PT. Coordinate-based activation likelihood estimation meta-analysis of neuroimaging data: a random-effects approach based on empirical estimates of spatial uncertainty. Hum Brain Mapp. 2009;30:2907–2926. doi: 10.1002/hbm.20718. [DOI] [PMC free article] [PubMed] [Google Scholar]
- Everitt BJ, Robbins TW. Neural systems of reinforcement for drug addiction: from actions to habits to compulsion. Nat Neurosci. 2005;8:1481–1489. doi: 10.1038/nn1579. [DOI] [PubMed] [Google Scholar]
- Everitt BJ, Belin D, Economidou D, Pelloux Y, Dalley JW, Robbins TW. Neural mechanisms underlying the vulnerability to develop compulsive drug-seeking habits and addiction. Philosophical Transactions of the Royal Society B: Biological Sciences. 2008;363:3125–3135. doi: 10.1098/rstb.2008.0089. [DOI] [PMC free article] [PubMed] [Google Scholar]
- Farrell MJ, Laird AR, Egan GF. Brain activity associated with painfully hot stimuli applied to the upper limb: A meta-analysis. Human Brain Mapping. 2005;25:129–139. doi: 10.1002/hbm.20125. [DOI] [PMC free article] [PubMed] [Google Scholar]
- Forget B, Pushparaj A, Le FB. Granular insular cortex inactivation as a novel therapeutic strategy for nicotine addiction. Biological Psychiatry. 2010;68:265–271. doi: 10.1016/j.biopsych.2010.01.029. [DOI] [PubMed] [Google Scholar]
- Franklin TR, Wang Z, Li Y, Suh JJ, Goldman M, Lohoff FW, Cruz J, Hazan R, Jens W, Detre JA, Berrettini W, O’Brien CP, Childress AR. Dopamine transporter genotype modulation of neural responses to smoking cues: Confirmation in a new cohort. Addictive Biology. 2011a;16:308–322. doi: 10.1111/j.1369-1600.2010.00277.x. [DOI] [PMC free article] [PubMed] [Google Scholar]
- Franklin TR, Wang Z, Wang J, Sciortino N, Harper D, Li Y, Ehrman R, Kampman K, O’Brien CP, Detre JA, Childress AR. Limbic activation to cigarette smoking cues independent of nicotine withdrawal: a perfusion fMRI study. Neuropsychopharmacology. 2007;32:2301–2309. doi: 10.1038/sj.npp.1301371. [DOI] [PubMed] [Google Scholar]
- Franklin T, Wang Z, Suh JJ, Hazan R, Cruz J, Li Y, Goldman M, Detre JA, O’Brien CP, Childress AR. Effects of Varenicline on Smoking Cue-Triggered Neural and Craving Responses. Archives of General Psychiatry. 2011b;68:516–526. doi: 10.1001/archgenpsychiatry.2010.190. [DOI] [PMC free article] [PubMed] [Google Scholar]
- Friston KJ, Worsley KJ, Frackowiak RSJ, Mazziotta JC, Evans AC. Assessing the significance of focal activations using their spatial extent. Human Brain Mapping. 1993;1:210–220. doi: 10.1002/hbm.460010306. [DOI] [PubMed] [Google Scholar]
- Genovese CR, Lazar NA, Nichols T. Thresholding of statistical maps in functional neuroimaging using the false discovery rate. Neuroimage. 2002;15:870–878. doi: 10.1006/nimg.2001.1037. [DOI] [PubMed] [Google Scholar]
- Gilbert DG, Rabinovich NE. The international smoking image series (with neutral counterparts) Vol. 1.2. Carbondale, IL: Department of Psychology, Southern Illinois University; 1999. [Google Scholar]
- Glautier S, Tiffany ST. Methodological issues in cue reactivity research. In: Drummond DC, Tiffany ST, Glautier S, Remington B, editors. Addictive behaviour: Cue exposure theory and practice. Chichester: John Wiley & Sons; 1995. pp. 75–97. [Google Scholar]
- Gloria R, Angelos L, Schaefer HS, Davis JM, Majeskie M, Richmond BS, Curtin JJ, Davidson RJ, Baker TB. An fMRI investigation of the impact of withdrawal on regional brain activity during nicotine anticipation. Psychophysiology. 2009;46:681–693. doi: 10.1111/j.1469-8986.2009.00823.x. [DOI] [PMC free article] [PubMed] [Google Scholar]
- Goldman-Rakic PS. Topography of Cognition: Parallel Distributed Networks in Primate Association Cortex. Annual Review of Neuroscience. 1988;11:137–156. doi: 10.1146/annurev.ne.11.030188.001033. [DOI] [PubMed] [Google Scholar]
- Goldstein RZ, Volkow ND. Drug addiction and its underlying neurobiological basis: Neuroimaging evidence for the involvement of the frontal cortex. American Journal of Psychiatry. 2002;159:1642–1652. doi: 10.1176/appi.ajp.159.10.1642. [DOI] [PMC free article] [PubMed] [Google Scholar]
- Goudriaan AE, de Ruiter MB, van den BW, Oosterlaan J, Veltman DJ. Brain activation patterns associated with cue reactivity and craving in abstinent problem gamblers, heavy smokers and healthy controls: an fMRI study. Addictive Biology. 2010;15:491–503. doi: 10.1111/j.1369-1600.2010.00242.x. [DOI] [PMC free article] [PubMed] [Google Scholar]
- Grimm JW, Hope BT, Wise RA, Shaham Y. Neuroadaptation: Incubation of cocaine craving after withdrawal. Nature. 2001;412:141–142. doi: 10.1038/35084134. [DOI] [PMC free article] [PubMed] [Google Scholar]
- Grusser SM, Heinz A, Flor H. Standardized stimuli to assess drug craving and drug memory in addicts. J Neural Transm. 2000;107:715–720. doi: 10.1007/s007020070072. [DOI] [PubMed] [Google Scholar]
- Hartwell KJ, Johnson KA, Li X, Myrick H, Lematty T, George MS, Brady KT. Neural correlates of craving and resisting craving for tobacco in nicotine dependent smokers. Addictive Biology. 2011 doi: 10.1111/j.1369-1600.2011.00340.x. [DOI] [PMC free article] [PubMed] [Google Scholar]
- Heatherton TF, Kozlowski LT, Frecker RC, Fagerström KO. The Fagerström Test for Nicotine Dependence: A revision of the Fagerström Tolerance Questionnaire. British Journal of Addiction. 1991;86:1119–1127. doi: 10.1111/j.1360-0443.1991.tb01879.x. [DOI] [PubMed] [Google Scholar]
- Hughes JR, Keely J, Naud S. Shape of the relapse curve and long-term abstinence among untreated smokers. Addiction. 2004;99:29–38. doi: 10.1111/j.1360-0443.2004.00540.x. [DOI] [PubMed] [Google Scholar]
- Janes AC, Frederick B, Richardt S, Burbridge C, Merlo-Pich E, Renshaw PF, Evins AE, Fava M, Kaufman MJ. Brain fMRI reactivity to smoking-related images before and during extended smoking abstinence. Experimental and Clinical Psychopharmacology. 2009;17:365–373. doi: 10.1037/a0017797. [DOI] [PMC free article] [PubMed] [Google Scholar]
- Janes AC, Pizzagalli DA, Richardt S, deB FB, Chuzi S, Pachas G, Culhane MA, Holmes AJ, Fava M, Evins AE, Kaufman MJ. Brain reactivity to smoking cues prior to smoking cessation predicts ability to maintain tobacco abstinence. Biological Psychiatry. 2010;67:722–729. doi: 10.1016/j.biopsych.2009.12.034. [DOI] [PMC free article] [PubMed] [Google Scholar]
- Jentsch JD, Taylor JR. Impulsivity resulting from frontostriatal dysfunction in drug abuse: implications for the control of behavior by reward-related stimuli. Psychopharmacology. 1999;146:373–390. doi: 10.1007/pl00005483. [DOI] [PubMed] [Google Scholar]
- Jog MS, Kubota Y, Connolly CI, Hillegaart V, Graybiel AM. Building Neural Representations of Habits. Science. 1999;286:1745–1749. doi: 10.1126/science.286.5445.1745. [DOI] [PubMed] [Google Scholar]
- Kober H, Mende-Siedlecki P, Kross EF, Weber J, Mischel W, Hart CL, Ochsner KN. PrefrontalΓ Çôstriatal pathway underlies cognitive regulation of craving. Proceedings of the National Academy of Sciences. 2010;107:14811–14816. doi: 10.1073/pnas.1007779107. [DOI] [PMC free article] [PubMed] [Google Scholar]
- Koob GF, LeMoal M. Drug addiction, dysregulation of reward, and allostasis. Neuropsychopharmacology. 2001;24:97–129. doi: 10.1016/S0893-133X(00)00195-0. [DOI] [PubMed] [Google Scholar]
- Kozink RV, Kollins SH, McClernon FJ. Smoking withdrawal modulates right inferior frontal cortex but not presupplementary motor area activation during inhibitory control. Neuropsychopharmacology. 2010;35:2600–2606. doi: 10.1038/npp.2010.154. [DOI] [PMC free article] [PubMed] [Google Scholar]
- Kuhn S, Gallinat J. Common biology of craving across legal and illegal drugs - a quantitative meta-analysis of cue-reactivity brain response. Eur J Neurosci. 2011;33:1318–1326. doi: 10.1111/j.1460-9568.2010.07590.x. [DOI] [PubMed] [Google Scholar]
- Laird AR, Fox PM, Price CJ, Glahn DC, Uecker AM, Lancaster JL, Turkeltaub PE, Kochunov P, Fox PT. ALE meta-analysis: Controlling the false discovery rate and performing statistical contrasts. Human Brain Mapping. 2005;25:155–164. doi: 10.1002/hbm.20136. [DOI] [PMC free article] [PubMed] [Google Scholar]
- Lancaster JL, Rainey LH, Summerlin JL, Freitas CS, Fox PT, Evans AC, Toga AW, Mazziotta JC. Automated labeling of the human brain: A preliminary report on the development and evaluation of a forward-transform method. Human Brain Mapping. 1997;5:238–242. doi: 10.1002/(SICI)1097-0193(1997)5:4<238::AID-HBM6>3.0.CO;2-4. [DOI] [PMC free article] [PubMed] [Google Scholar]
- Lancaster JL, Tordesillas-Gutierrez D, Martinez M, Salinas F, Evans A, Zilles K, Mazziotta JC, Fox PT. Bias between MNI and Talairach coordinates analyzed using the ICBM-152 brain template. Hum Brain Mapp. 2007;28:1194–1205. doi: 10.1002/hbm.20345. [DOI] [PMC free article] [PubMed] [Google Scholar]
- Lancaster JL, Woldorff MG, Parsons LM, Liotti M, Freitas ES, Rainey L, Kochunov PV, Nickerson D, Mikiten SA, Fox PT. Automated Talairach Atlas labels for functional brain mapping. Human Brain Mapping. 2000;10:120–131. doi: 10.1002/1097-0193(200007)10:3<120::AID-HBM30>3.0.CO;2-8. [DOI] [PMC free article] [PubMed] [Google Scholar]
- Lang PJ, Bradley MM, Fitzsimmons JR, Cuthbert BN, Scott JD, Moulder B, Nangia V. Emotional arousal and activation of the visual cortex: an fMRI analysis. Psychophysiology. 1998;35:199–210. [PubMed] [Google Scholar]
- Lee JH, Lim Y, Wiederhold BK, Graham SJ. A functional magnetic resonance imaging (FMRI) study of cue-induced smoking craving in virtual environments. Appl Psychophysiol Biofeedback. 2005;30:195–204. doi: 10.1007/s10484-005-6377-z. [DOI] [PubMed] [Google Scholar]
- Lieberman MD, Cunningham WA. Type I and Type II error concerns in fMRI research: re-balancing the scale. Soc Cogn Affect Neurosci. 2009;4:423–428. doi: 10.1093/scan/nsp052. [DOI] [PMC free article] [PubMed] [Google Scholar]
- Littel M, Franken IH. The effects of prolonged abstinence on the processing of smoking cues: an ERP study among smokers, ex-smokers and never-smokers. J Psychopharmacol. 2007;21:873–882. doi: 10.1177/0269881107078494. [DOI] [PubMed] [Google Scholar]
- Liu X, Hairston J, Schrier M, Fan J. Common and distinct networks underlying reward valence and processing stages: A meta-analysis of functional neuroimaging studies. Neuroscience & Biobehavioral Reviews. 2011;35:1219–1236. doi: 10.1016/j.neubiorev.2010.12.012. [DOI] [PMC free article] [PubMed] [Google Scholar]
- Lubman DI, Yucel M, Pantelis C. Addiction, a condition of compulsive behaviour? Neuroimaging and neuropsychological evidence of inhibitory dysregulation. Addiction. 2004;99:1491–1502. doi: 10.1111/j.1360-0443.2004.00808.x. [DOI] [PubMed] [Google Scholar]
- Luijten M, Veltman DJ, van den BW, Hester R, Field M, Smits M, Franken IH. Neurobiological substrate of smoking-related attentional bias. Neuroimage. 2011;54:2374–2381. doi: 10.1016/j.neuroimage.2010.09.064. [DOI] [PubMed] [Google Scholar]
- McBride D, Barrett SP, Kelly JT, Aw A, Dagher A. Effects of expectancy and abstinence on the neural response to smoking cues in cigarette smokers: An fMRI study. Neuropsychopharmacology. 2006;31:2728–2738. doi: 10.1038/sj.npp.1301075. [DOI] [PubMed] [Google Scholar]
- McClernon FJ, Gilbert DG. Human functional neuroimaging in nicotine and tobacco research: basics, background, and beyond. Nicotine & Tobacco Research. 2004;6:941–959. doi: 10.1080/14622200412331337394. [DOI] [PubMed] [Google Scholar]
- McClernon FJ, Hiott FB, Huettel SA, Rose JE. Abstinence-induced changes in self-report craving correlate with event-related FMRI responses to smoking cues. Neuropsychopharmacology. 2005;30:1940–1947. doi: 10.1038/sj.npp.1300780. [DOI] [PMC free article] [PubMed] [Google Scholar]
- McClernon FJ, Hiott FB, Liu J, Salley AN, Behm FM, Rose JE. Selectively reduced responses to smoking cues in amygdala following extinction-based smoking cessation: results of a preliminary functional magnetic resonance imaging study. Addictive Biology. 2007a;12:503–512. doi: 10.1111/j.1369-1600.2007.00075.x. [DOI] [PubMed] [Google Scholar]
- McClernon FJ, Hutchison KE, Rose JE, Kozink RV. DRD4 VNTR polymorphism is associated with transient fMRI-BOLD responses to smoking cues. Psychopharmacology. 2007b;194:433–441. doi: 10.1007/s00213-007-0860-6. [DOI] [PubMed] [Google Scholar]
- McClernon FJ, Kozink RV, Lutz AM, Rose JE. 24-h smoking abstinence potentiates fMRI-BOLD activation to smoking cues in cerebral cortex and dorsal striatum. Psychopharmacology. 2009;204:25–35. doi: 10.1007/s00213-008-1436-9. [DOI] [PMC free article] [PubMed] [Google Scholar]
- McClernon FJ, Kozink RV, Rose JE. Individual differences in nicotine dependence, withdrawal symptoms, and sex predict transient fMRI-BOLD responses to smoking cues. Neuropsychopharmacology. 2008;33:2148–2157. doi: 10.1038/sj.npp.1301618. [DOI] [PubMed] [Google Scholar]
- Moon J, Lee J. Cue exposure treatment in a virtual environment to reduce nicotine craving: A functional MRI study. CyberPsychology & Behavior. 2009;12:43–45. doi: 10.1089/cpb.2008.0032. [DOI] [PubMed] [Google Scholar]
- Naqvi NH, Bechara A. The hidden island of addiction: the insula. Trends in Neurosciences. 2009;32:56–67. doi: 10.1016/j.tins.2008.09.009. [DOI] [PMC free article] [PubMed] [Google Scholar]
- Naqvi NH, Bechara A. The insula and drug addiction: an interoceptive view of pleasure, urges, and decision-making. Brain Struct Funct. 2010;214:435–450. doi: 10.1007/s00429-010-0268-7. [DOI] [PMC free article] [PubMed] [Google Scholar]
- Naqvi NH, Rudrauf D, Damasio H, Bechara A. Damage to the Insula Disrupts Addiction to Cigarette Smoking. Science. 2007;315:531–534. doi: 10.1126/science.1135926. [DOI] [PMC free article] [PubMed] [Google Scholar]
- Nestor L, McCabe E, Jones J, Clancy L, Garavan H. Differences in “bottom-up” and “top-down” neural activity in current and former cigarette smokers: Evidence for neural substrates which may promote nicotine abstinence through increased cognitive control. Neuroimage. 2011;56:2258–2275. doi: 10.1016/j.neuroimage.2011.03.054. [DOI] [PubMed] [Google Scholar]
- NIDA. Tobacco Addiction (Research Report Series Rep No NIH Publication Number 09-4342) 2009. [Google Scholar]
- Nisell M, Nomikos GG, Svensson TH. Systemic nicotine-induced dopamine release in the rat nucleus accumbens is regulated by nicotinic receptors in the ventral tegmental area. Synapse. 1994;16:36–44. doi: 10.1002/syn.890160105. [DOI] [PubMed] [Google Scholar]
- Okuyemi KS, Powell JN, Savage CR, Hall SB, Nollen N, Holsen LM, McClernon FJ, Ahluwalia JS. Enhanced cue-elicited brain activation in African American compared with Caucasian smokers: an fMRI study. Addictive Biology. 2006;11:97–106. doi: 10.1111/j.1369-1600.2006.00007.x. [DOI] [PubMed] [Google Scholar]
- Petrides M, Pandya DN. Projections to the frontal cortex from the posterior parietal region in the rhesus monkey. The Journal of Comparative Neurology. 1984;228:105–116. doi: 10.1002/cne.902280110. [DOI] [PubMed] [Google Scholar]
- Phillips PEM, Stuber GD, Heien MLAV, Wightman RM, Carelli RM. Subsecond dopamine release promotes cocaine seeking. Nature. 2003;422:614–618. doi: 10.1038/nature01476. [DOI] [PubMed] [Google Scholar]
- Price CJ, Devlin JT, Moore CJ, Morton C, Laird AR. Meta-analyses of object naming: Effect of baseline. Human Brain Mapping. 2005;25:70–82. doi: 10.1002/hbm.20132. [DOI] [PMC free article] [PubMed] [Google Scholar]
- Pritchard TC, Macaluso DA, Eslinger PJ. Taste Perception in Patients With Insular Cortex Lesions. Behavioral Neuroscience. 1999;113:663–671. [PubMed] [Google Scholar]
- Robinson TE, Berridge KC. Addiction. Annu Rev Psychol. 2003;54:25–53. doi: 10.1146/annurev.psych.54.101601.145237. [DOI] [PubMed] [Google Scholar]
- Robinson TE, Berridge KC. The incentive sensitization theory of addiction: some current issues. Philos Trans R Soc Lond B Biol Sci. 2008;363:3137–3146. doi: 10.1098/rstb.2008.0093. [DOI] [PMC free article] [PubMed] [Google Scholar]
- Rubinstein ML, Luks TL, Moscicki AB, Dryden W, Rait MA, Simpson GV. Smoking-related cue-induced brain activation in adolescent light smokers. J Adolesc Health. 2011;48:7–12. doi: 10.1016/j.jadohealth.2010.09.016. [DOI] [PMC free article] [PubMed] [Google Scholar]
- Sabatinelli D, Fortune EE, Li Q, Siddiqui A, Krafft C, Oliver WT, Beck S, Jeffries J. Emotional perception: meta-analyses of face and natural scene processing. Neuroimage. 2011;54:2524–2533. doi: 10.1016/j.neuroimage.2010.10.011. [DOI] [PubMed] [Google Scholar]
- Sabatinelli D, Lang PJ, Keil A, Bradley MM. Emotional perception: correlation of functional MRI and event-related potentials. Cereb Cortex. 2007;17:1085–1091. doi: 10.1093/cercor/bhl017. [DOI] [PubMed] [Google Scholar]
- Selemon LD, Goldman-Rakic PS. Common cortical and subcortical targets of the dorsolateral prefrontal and posterior parietal cortices in the rhesus monkey: evidence for a distributed neural network subserving spatially guided behavior. The Journal of Neuroscience. 1988;8:4049–4068. doi: 10.1523/JNEUROSCI.08-11-04049.1988. [DOI] [PMC free article] [PubMed] [Google Scholar]
- Sharma A, Brody AL. In vivo brain imaging of human exposure to nicotine and tobacco. Handb Exp Pharmacol. 2009:145–171. doi: 10.1007/978-3-540-69248-5_6. [DOI] [PMC free article] [PubMed] [Google Scholar]
- Shiffman S, Balabanis MH, Gwaltney CJ, Paty JA, Gnys M, Kassel JD, Hickcox M, Paton SM. Prediction of lapse from associations between smoking and situational antecedents assessed by ecological momentary assessment. Drug and Alcohol Dependence. 2007;91:159–168. doi: 10.1016/j.drugalcdep.2007.05.017. [DOI] [PMC free article] [PubMed] [Google Scholar]
- Stippekohl B, Winkler M, Mucha RF, Pauli P, Walter B, Vaitl D, Stark R. Neural Responses to BEGIN- and END-Stimuli of the Smoking Ritual in Nonsmokers, Nondeprived Smokers, and Deprived Smokers. Neuropsychopharmacology. 2010;35:1209–1225. doi: 10.1038/npp.2009.227. [DOI] [PMC free article] [PubMed] [Google Scholar]
- Turkeltaub PE, Eden GF, Jones KM, Zeffiro TA. Meta-Analysis of the Functional Neuroanatomy of Single-Word Reading: Method and Validation. Neuroimage. 2002b;16:765–780. doi: 10.1006/nimg.2002.1131. [DOI] [PubMed] [Google Scholar]
- Turkeltaub PE, Eden GF, Jones KM, Zeffiro TA. Meta-Analysis of the Functional Neuroanatomy of Single-Word Reading: Method and Validation. Neuroimage. 2002a;16:765–780. doi: 10.1006/nimg.2002.1131. [DOI] [PubMed] [Google Scholar]
- Turkeltaub PE, Eickhoff SB, Laird AR, Fox M, Wiener M, Fox P. Minimizing within-experiment and within-group effects in activation likelihood estimation meta-analyses. Human Brain Mapping. 2011 doi: 10.1002/hbm.21186. 00. [DOI] [PMC free article] [PubMed] [Google Scholar]
- US Department of Health and Human Services. How tobacco smoke causes disease: The biology and behavioral basis for smoking-attributable disease: A report of the surgeon general. Atlanta, GA: U.S. Department of Health and Human Services, Centers for Disease Control and Prevention, National Center for Chronic Disease Prevention and Health Promotion, Office on Smoking and Health; 2010. [PubMed] [Google Scholar]
- Versace F, Minnix JA, Robinson JD, Lam CY, Brown VL, Cinciripini PM. Brain reactivity to emotional, neutral and cigarette-related stimuli in smokers. Addiction Biology. 2011;16:296–307. doi: 10.1111/j.1369-1600.2010.00273.x. [DOI] [PMC free article] [PubMed] [Google Scholar]
- Volkow ND, Fowler JS, Wang GJ. The addicted human brain viewed in the light of imaging studies: Brain circuits and treatment strategies. Neuropharmacology. 2004;47(Suppl 1):3–13. doi: 10.1016/j.neuropharm.2004.07.019. [DOI] [PubMed] [Google Scholar]
- Volkow ND, Wang GJ, Fowler JS, Tomasi D, Telang F, Baler R. Addiction: decreased reward sensitivity and increased expectation sensitivity conspire to overwhelm the brain’s control circuit. Bioessays. 2010;32:748–755. doi: 10.1002/bies.201000042. [DOI] [PMC free article] [PubMed] [Google Scholar]
- Volkow ND, Wang GJ, Telang F, Fowler JS, Logan J, Childress AR, Jayne M, Ma Y, Wong C. Cocaine cues and dopamine in dorsal striatum: mechanism of craving in cocaine addiction. Journal of Neuroscience. 2006;26:6583. doi: 10.1523/JNEUROSCI.1544-06.2006. [DOI] [PMC free article] [PubMed] [Google Scholar]
- Wang Z, Faith M, Patterson F, Tang K, Kerrin K, Wileyto EP, Detre JA, Lerman C. Neural substrates of abstinence-induced cigarette cravings in chronic smokers. Journal of Neuroscience. 2007;27:14035–14040. doi: 10.1523/JNEUROSCI.2966-07.2007. [DOI] [PMC free article] [PubMed] [Google Scholar]
- Wilson SJ, Sayette MA, Delgado MR, Fiez JA. Instructed smoking expectancy modulates cue-elicited neural activity: A preliminary study. Nicotine & Tobacco Research. 2005;7:637–645. doi: 10.1080/14622200500185520. [DOI] [PMC free article] [PubMed] [Google Scholar]
- Wilson SJ, Sayette MA, Delgado MR, Fiez JA. Effect of smoking opportunity on responses to monetary gain and loss in the caudate nucleus. Journal of Abnormal Psychology. 2008;117:428–434. doi: 10.1037/0021-843X.117.2.428. [DOI] [PMC free article] [PubMed] [Google Scholar]
- Worsley KJ, Evans AC, Marrett S, Neelin P. A three-dimensional statistical analysis for CBF activation studies in human brain. J Cereb Blood Flow Metab. 1992;12:900–918. doi: 10.1038/jcbfm.1992.127. [DOI] [PubMed] [Google Scholar]
Associated Data
This section collects any data citations, data availability statements, or supplementary materials included in this article.