

Abstract
Most models assessing relative transmissions during different progressive stages of human immunodeficiency virus (HIV) infection assume that infections are transmitted through instantaneous sexual contacts. In reality, however, HIV will often be transmitted through repeated sex acts during partnerships that form and dissolve at varying rates. We sought to understand how dynamic sexual partnerships would influence transmissions during different progression stages of HIV infection: primary HIV infection (PHI) and chronic stage. Using a system of ordinary differential equations with a pair approximation technique, we constructed a model of HIV transmission in a homogeneous population in which sexual partnerships form and dissolve. We derived analytical expressions for useful epidemiological quantities such as basic reproduction number and also did simulation runs of the model. Partnership dynamics strongly influence transmissions during progressive stages of HIV infection. The fraction of transmissions during PHI has a U-shaped relationship with respect to the rate of partnership change, where the minimum and maximum occur given partnerships of about 100 days and fixed partnerships, respectively. Models that assume instantaneous contacts may overestimate transmissions during PHI for real, dynamic sexual partnerships with varying (non-zero) durations.
Keywords: primary HIV infection, transmission model, network, pair approximation
1. Introduction
Despite its decreasing incidence since late 1990s (Joint United Nations Programme on HIV/AIDS, 2010), human immunodeficiency virus (HIV) infection causes a major burden in global health (5th leading cause of the burden of disease globally in 2004) (World Health Organization, 2008). The number of people living with HIV continues to grow reaching an estimated 33.3 million in 2009 and 2.6 million people became newly infected with HIV in 2009 alone (Joint United Nations Programme on HIV/AIDS, 2010). Characterization of HIV infection in the individual typically includes three stages (which we will call primary, latent, and late stages) with significantly different serum viral load (Cohen et al., 2011; Fiebig et al., 2003; Pantaleo et al., 1993). The probability of transmission correlates with the serum viral load (Gray et al., 2001; Quinn et al., 2000) and thus varies over the course of HIV infection (Hollingsworth et al., 2008; Pinkerton, 2008; Wawer et al., 2005).
Since the identification of HIV as the etiological agent of AIDS in 1984 (Gallo, 2002; Montagnier, 2002), analyses of mathematical and computer models of HIV transmission have provided insights on the importance of various issues of HIV transmission including the rate of acquiring new sexual partners (Anderson and May, 1988; May and Anderson, 1987), social mixing patterns (Anderson et al., 1990; Anderson et al., 1989; Gupta et al., 1989; Hyman and Stanley, 1988; Hyman and Stanley, 1989; Jacquez et al., 1988; Koopman et al., 1988; Stigum et al., 1994; Stigum et al., 1997), and concurrent sexual partnerships (Goodreau et al., 2010; Morris and Kretzschmar, 1997; Watts and May, 1992). Some studies focus on the relative role of the different stages of HIV infection. A couple of studies emphasize the importance of the primary stage of HIV infection (PHI) on the overall transmission of HIV in the early stages of the epidemic (Jacquez et al., 1994) and also at endemic state with certain assumptions on mixing patterns (Koopman et al., 1997). On the other hand, model fitting to San Francisco City Clinic Cohort data produced the highest probability of transmission during the late stage of HIV infection implying the late stage played a leading role (augmented by a longer duration of late stage of HIV infection compared to PHI), especially during the late period of the epidemic (Rapatski et al., 2005b). Another study suggests that no HIV stage is dominant with primary and late stages of HIV infection playing increased roles during the early and the later stages of the epidemic, respectively, using examples of African cities (Abu-Raddad and Longini, 2008). These analyses are potentially useful because effectiveness of some control programs for HIV transmission will vary by the relative contributions of different stages of HIV infection. For example, identifying HIV-positive people and reducing transmissions from them will miss transmissions during PHI since patients are usually detected after PHI has already passed (Pilcher et al., 2004a; Pilcher et al., 2004b). On the other hand, a partially effective vaccine that reduces virus level (and thus infectivity) mostly during PHI (Johnston and Fauci, 2007) will have little effect on reducing transmissions occurring after PHI.
This paper examines a similar issue of relative role of the different stages of HIV infection in the transmission of HIV in a homosexual population using a mathematical model, but assumes sexual partnerships can be long-term and concurrent. Prior studies (Abu-Raddad and Longini, 2008; Jacquez et al., 1994; Koopman et al., 1997; Rapatski et al., 2005b) assumed that HIV transmits through instantaneous sexual contacts although in reality, HIV will likely transmit through repeated sex acts during partnerships that form and dissolve over time. One study (Kretzschmar and Dietz, 1998) examined a similar issue, but assumed sexual partnerships are monogamous while several studies suggest that concurrent sexual partnership may play an important role in transmissions of HIV in the overall population (Morris and Kretzschmar, 1997; Morris et al., 2010; Morris et al., 2009) and, especially, in transmissions during PHI (Goodreau et al., 2010). Our prior work (Kim et al., 2010) also addressed a similar issue, but in the context of individual-based (IB) model. The present study uses a system of ordinary differential equations with a pair approximation technique (Rand, 1997) to bypass extensive simulations required for the IB model. In doing so, we can also provide analytical expressions for important epidemiological quantities such as basic reproduction number (R0) and explore the relationship between dynamics of sexual partnerships and transmissions during different stages of HIV infection across a wide range of parameter values.
In the Methods section, we discuss model parameters and formulation including a pair approximation technique. In the Results section, we derive R0 and also graphically show how the rate of partnership change influences the fraction of transmissions during PHI. Finally, in the Discussion section, we discuss the implications of our study and real-world complexities that may influence our inferences.
2. Methods
2.1. Compartmental flows
The typical compartmental model categorizes a population by disease status (e.g., susceptible or infected) and assigns a specific compartment to the population in each category. Then, one defines the flows into, out of, and between compartments using differential equations. Our model categorizes population by partnership status as well as disease status. Figure 1 illustrates the difference between the typical compartmental model and the one in this paper in the context of a simple susceptible (S) - infected (I) model. A box with a letter (S or I) within indicates the population in the state and arrows indicate the flows for each population. Figure 1(a) shows the typical compartmental model, where the flow from S to I indicating the new infection is determined by β[S][I]/N, where [S] and [I] indicates the number of susceptible and infected people, respectively, and β defines the transmission rate per infected person per unit of time. This formulation assumes that susceptible people may be infected from any infected person in the population with equal chance. On the other hand, Figure 1(b) shows that new infections arise through explicit partnerships between susceptible and infected people; λ[SI]. Here, [SI] indicates the number of pairs (or partnerships) and λ defines the transmission rate of the infected person in the partnership per unit of time. This formulation assumes that a susceptible person may be infected only by infected people that are already connected to that susceptible person. In this model, infection may be constrained to one partnership unless the infected person is already connected with or forms new connections with other susceptible people.
Figure 1.

Comparison of the typical compartmental model (a) and our partnership model (b).
We use two models to explore the effects of partnership dynamics on the transmissions during different stages of HIV infection in a homosexual population. One model assumes a single compartment for the infectious period (SI model) whereas the other model divides the infectious period into two compartments (SI1I2 model). Our model comprises parameters (see Table 1) indicating transmission between susceptible and infected people (β), death from infection (γ), partnership formation (ρ), and partnership dissolution (σ), where β and γ are used without subscripts in SI model and with subscripts in SI1I2 model. We provide our rationale for the parameter values in the following section.
Table 1.
Model parameters.
| Symbol | Description |
|---|---|
| βi* | Transmission rate per infected person per day during stage i for i = 1, 2 (1=primary HIV infection (PHI), 2=latent stage) |
| γi* | Death rate per day from infection. In SI1I2 model, γ1 represents the progression rate from PHI to the latent stage |
| σ | Partnership dissolution rate per day |
| ρ | Partnership formation rate per day |
In the SI model, β and γ are used without the subscript.
2.2. Duration of infectiousness (1/γ) and transmission rate (β)
In the SI model, we arbitrarily choose the duration of infectiousness (1/γ) and the transmission rate (β) to illustrate the interaction among partnership dynamics, the transmission rate, and the duration of infectiousness whereas in the SI1I2 model, we choose them to reflect the course of HIV infection (i.e., PHI and latent stage). In the SI1I2 model, the durations of infection are 49 days (1/γ1) and 10 years (1/γ2) for PHI and latent stage, respectively. Transmission rates are 45 times higher during PHI (β1=0.036) than latent stage (β2=0.00084), based on analyses of a Rakai study (Pinkerton, 2007). We omitted the late peak in infectivity including AIDS because we assume that people get treatment and do not experience AIDS while they are sexually active. We assume that people have a fixed frequency of sex acts per unit of time independent of the number of partners, based on the sex budget argument (Blower and Boe, 1993). In this formulation the frequency of sex acts per partnership drops as the number of partnerships rises. At a given transmission rate per infected person per unit of time, β (or βi for i=1,2 in SI1I2 model), we compute the transmission rate per partnership, λ (or λi for i=1,2 in SI1I2 model) by dividing β with the expected number of partners per person, n (which we will call “mean degree”), i.e., λ =β/n. When partnerships are at equilibrium and transmission conditions are near threshold such that infection frequency is negligible, n is derived from Nρ = 2Pσ, where N and P denote the number of people and partnerships, respectively. Then by definition n=2P/N=ρ/σ, the ratio of partnership formation to dissolution rates. In the case where the influence of infection dynamics on partnership dynamics becomes significant (because partnerships of people dying from infection dissolve), we can compute the mean degree by ([SS]+2[SI]+[II]) / N.
2.3. The SI model
In the SI model, we use the following notations. We use [X] to denote the number of people in a state X. For example, [S] indicates the number of susceptible people regardless of whether or not they have partnerships. Similarly, [SI] represents the number of partnerships between a susceptible and an infected person. By convention, we count the number of partnerships in both directions, which implies that [SI]=[IS], and [SS] indicates twice the number of SS partnerships.
We express the time evolution of the number of susceptible people, d[S]/dt, as
| (1) |
The first term on the right hand side of Equation (1) captures infection transmission in SI partnerships. The second term indicates that new susceptible people are recruited every time death from infection occurs, which keeps the population size constant. Although this assumption of a constant population size may be unrealistic, we retain this assumption to simplify model analyses.
Time evolution of the number of SI partnerships is
| (2) |
where N represents the total population size (i.e., N = [I] + [S]). The first term on the right hand side captures partnership formation between the susceptible and infected people. The next term captures partnership dissolution and death of the infected people in SI partnerships. The last term captures infection transmissions. HIV transmission in an SI partnership is captured by λ[SI]. The case where the susceptible person is concurrently connected to another infected person is captured by λ[ISI]. Although two SI partnerships exist in an ISI triple, we do not need a factor of two because [ISI] indicates twice the number of ISI triples. The term λ[SSI], captures transmissions in the case where the susceptible person is connected to both infected and susceptible people. This transmission turns an SS into an SI partnership (i.e., increases the number of SI partnerships). It also turns an SI into an II partnership, which the earlier term, λ[SI], already captures. In Equations (1) and (2), we assume that new susceptible people enter the population at risk as singles whereas dying people may have one or more partners. Therefore, the time evolution equation of SI partnerships does not include the inflow from II partnerships that comes from instantaneously replacing infected deaths with susceptible people.
To close the system, we express triples with lower-order terms by using the following approximation:
| (3) |
This approximation assumes that people in states X and Z have partnership formation and dissolution dynamics that are independent of their being partnered to people in state Y. Error associated with the approximation may be assessed by comparing the model of pair approximation with a stochastic IB model, which we show in Figure 2 as an example.
Figure 2.


Results from pair approximation (solid line) and the average and one standard deviation of 100 stochastic simulation runs (triangle with error bar). (a) shows the fraction of population infected, (b) shows the correlation between susceptible and infected people (CSI) over time. β=0.04, 1/γ=100, ρ=0.02, σ=0.01, N=10000.
To express the [SSI] with lower-order terms, we need [SS], of which time evolution is given as
| (4) |
Again, [SS] means twice the number of SS partnerships and thus the equation has a factor of two in the term −2λ[SSI]. The SI1I2 model is a straightforward extension of the SI model. Time evolution equations for the SI1I2 model appear in the Appendix A2.
2.4. Correlation
The correlation measure is useful for understanding infection transmission in models of partnerships. We define the correlation between people in states X and Y (CXY) as
| (5) |
where n indicates the mean degree (Rand, 1997). If CXY = 1, then the expected number of XY partnerships under random mixing (denominator) and the observed number of XY partnerships (numerator) are the same. Since transmission occurs only in SI partnerships, we are only interested in the correlation between the susceptible and infected people; CSI (CSI1 and CSI2 in the SI1I2 model). This correlation can also be thought of as the observed fraction of susceptible people surrounding infected people (by stage, in the SI1I2 model) relative to the expected fraction under random mixing;
| (6) |
3. Results
Basic reproduction number (R0) is a fundamental quantity in infection transmission (Anderson and May, 1992). In a homogenously mixing population it is the expected number of secondary infections produced by a single infected person in an entirely susceptible population. It is also an epidemic threshold; an epidemic is impossible if R0 < 1.
3.1. R0 for SI model
Derivation of R0 follows the procedure described elsewhere (Keeling, 1999). Briefly, from the time evolution equation of the number of infected people,
| (7) |
The condition that d[I]/dt > 0 gives nλCSI −γ > 0. This leads to R0 = nCSIλ/γ > 1 assuming [S] equals N.
Figure 2 shows the dynamics of the number of infected people and the correlation between infected and susceptible people (CSI) during the initial 2000 days. CSI is initially at one, but quickly converges to a “quasi-equilibrium”’ while the number of infected people grows exponentially. Because of the fast time scale of the dynamics of CSI, we assume that CSI is at quasi-equilibrium instead of being equal to one during the initial stages of the epidemic as in prior studies (Bauch and Rand, 2000; Keeling, 1999).
We now determine the quasi-equilibrium value of CSI (i.e., ). Under the assumption of the initial period of the epidemic (i.e., [S ] N →1and[I ] N →0 ) and random mixing of the population (i.e., CSS →1) (see Appendix A.1 for details),
| (8) |
Under the assumption of an equilibrium (i.e., ),
| (9) |
given that .
We examine in two limiting cases: instantaneous and fixed partnerships. We then explore how transmission rate and the rate of partnership change influence between the two extremes of partnership duration. For instantaneous partnerships, we consider the limit where σ goes to infinity. To keep the mean degree constant if we don’t account for death (i.e., ρ/σ = some constant), we take ρ to infinity at the same rate. Replacing σ and ρ by εσ and ερ and letting ε go to infinity gives
| (10) |
This shows, if partnerships change rapidly, R0 in the model of partnerships is the same as in the model assuming mass action (Altmann, 1995).
For fixed partnerships, we consider the limit where σ goes to zero. Again, we keep the mean degree constant by replacing σ and ρ by εσ and ερ. Letting ε go to zero gives
| (11) |
This shows R0 in the model of fixed partnerships is smaller than in the mass action model by a factor of 1−1/n. This also shows in the limit of large mean degree (i.e., n → N → infinity), goes to one and so R0 in the model with partnerships is again the same as in the mass action model. One study showed that R0 is (1−2/n)β/γ in the regular fixed networks (Keeling, 1999). The difference—(1−1/n) versus (1−2/n)—comes from different assumptions regarding expressing the number of triples with lower order terms. The prior work (Keeling, 1999) used [XYZ]=ξ[XY][YZ]/[Y] for ξ =(n−1)/n whereas we use [XYZ]=[XY][YZ]/[Y]. The former is appropriate for a regular, fixed network, but our assumption is more suitable for a dynamic random network (Rand, 1997).
Figure 3 illustrates CSI* monotonically decreases as transmission rate (β) increases if partnerships are neither fixed nor instantaneous. For simplicity, we present partnership duration (1/σ) as a proxy for the rate of partnership change, but note that partnership formation rate decreases as partnership duration increases such that the mean degree (ρ/σ) remains constant. Figure 3 implies that R0 will be lower for an infection with higher transmissibility and shorter duration of infectiousness compared to an infection with lower transmissibility and longer duration of infectiousness if partnerships are ongoing and dynamic even when both infections have the same R0 under instantaneous or fixed partnerships.
Figure 3.
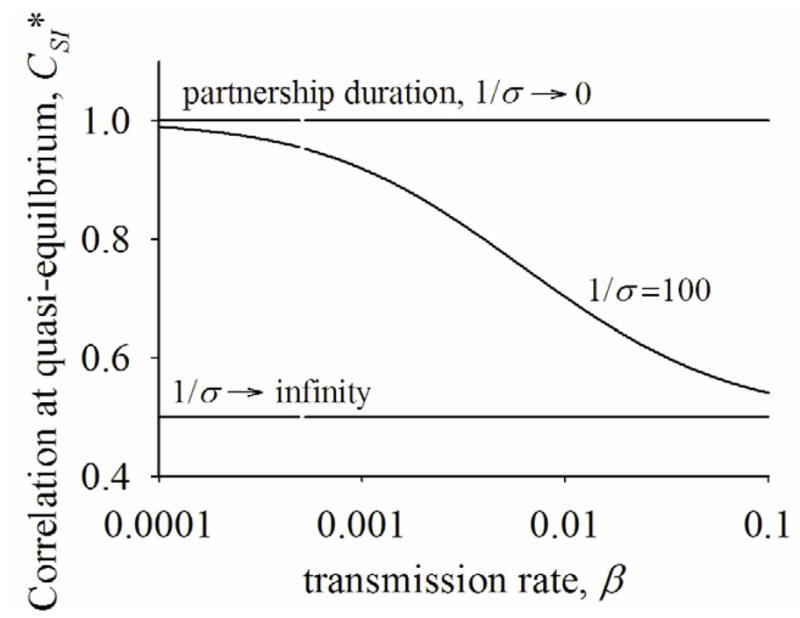
Correlation at quasi-equilibrium (CSI*) across transmission rate at instantaneous, fixed, and ongoing/dynamic partnerships. ρ/σ = 2.
To illustrate the effects of the rate of partnership change and transmission rate over the course of HIV infection on transmissions at endemic equilibrium, we simulate the following two scenarios by numerically solving the equations. In one scenario (labeled high β), 1/γ and β are set at 50 days and 0.036 per day, respectively. In the other (labeled low β), both β and γ is decreased by 45 fold each. Thus, the transmission potential (β/γ) is the same for both scenarios. We then vary σ and ρ such that partnership duration (1/σ) varies from 0.1 to 1000 days while the mean degree (ρ/σ) remains constant. Figure 4 shows endemic fraction of infected people is the same for both scenarios if 1/σ = 0.1. As the rate of partnership change decreases, however, endemic fraction of infected people is markedly different between the two scenarios. As partnership duration increases, transmissions occur more from an infection with longer duration and lower transmission rate than an infection with shorter duration and higher transmission rate. For HIV infection, this implies dynamic, ongoing partnerships will likely reduce transmissions more during PHI with higher transmissibility than later infections with lower transmissibility at endemic equilibrium.
Figure 4.

Fraction of population infected over time. ρ/σ=2. For “high β”, β=0.036, 1/γ=50 and for “low β”, β=0.0008, 1/γ=2250.
3.2. R0 for SI1I2 model
The procedure for deriving R0 for the SI1I2 model is the same as in the SI model. From the time-evolution equation of I1 (see Appendix A.2 for details),
| (12) |
We now derive quasi-equilibrium values for CSI1 and CSI2 (i.e., CSI1* and CSI2*). At quasi-equilibrium, we also assume that [I1*]γ1=[I2*]γ2, where [X*] indicate the number of people in state X at quasi-equilibrium. CSIi* are computed as in the SI model and letting CSIi* = 0 for i=1,2 gives two equations for two variables (see Appendix A.3 for details).
For instantaneous partnerships, we consider the limit where σ goes to infinity. As in the SI model, we keep the mean degree constant by taking ρ to infinity at the same rate as σ. Replacing ρ and σ by ερ and εσ and letting ε go to infinity gives
| (13) |
This gives
| (14) |
As in the SI model, if partnerships change rapidly, R0 in the model with partnerships is the same as in the mass action model.
For fixed partnerships, we consider the limit where σ goes to zero. Replacing σ and ρ by εσ and ερ and letting ε go to zero gives
| (15) |
We see that CSI2* is always less than CSI1* for a nonzero, finite n and β2 in fixed partnerships. This means that the fraction of susceptible people surrounding the infected people with latent stage (I2) is always smaller than the one for infected people with PHI (I1). This is because, under fixed partnerships, some of the initially susceptible partners are infected during the index case’s PHI, but are not replaced with susceptible people, which may happen if partnerships are dynamic.
Figure 5a shows how CSI1* and CSI2* change by the rate of partnership change between the two extremes of instantaneous and fixed partnerships. As the average duration of the partnership starts to increase, the fraction of susceptible partners becomes lower for the infected people with PHI than those with latent stage (i.e., CSI1* < CSI2*). This is mainly because transmission rate is higher during PHI than the latent stage. As the average duration of the partnership increases further, however, the fraction of susceptible partners becomes lower for infected people with latent stage than infected people with PHI (i.e., CSI1* > CSI2*). This reversion occurs mainly because as the rate of partnership change slows, infected partners are not replaced by new partners while infected people progress from PHI to the latent stage, as we have discussed for the case of fixed partnerships. Additional transmissions during the latent stage cause the fraction of susceptible partners to go even lower during I2 than during I1. Figures 5(b) and 5(c) show that the fractional contribution to R0 of PHI and the fraction of transmissions during PHI at endemic state reflect the change of CSI1* and CSI2*—they initially drop, but rise as partnership duration increases.
Figure 5.


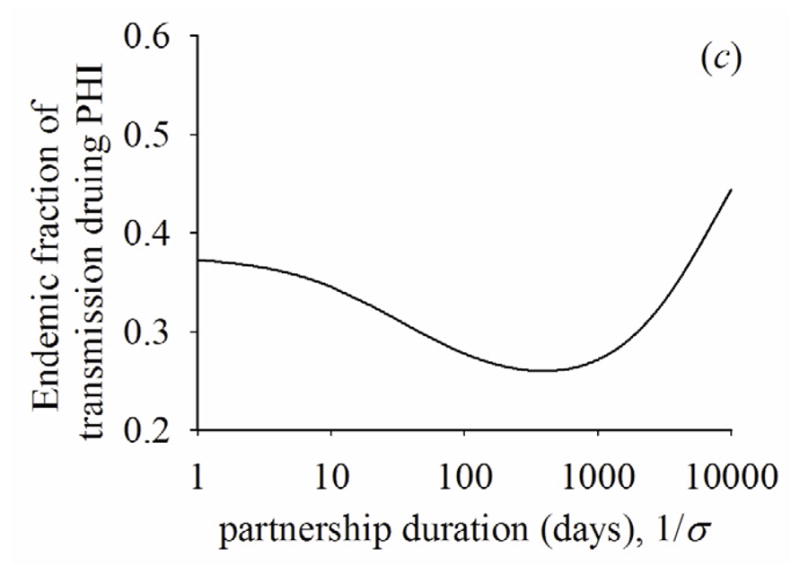
(a) Quasi-equilibrium values of the correlation with susceptible people during PHI, (CSI1*) or latent stage (CSI2*). (b) fractional contribution to R0 of PHI across partnership duration. (c) fraction of transmissions during PHI at endemic state across partnership duration. β1=0.036, β2=0.00084, 1/γ1=49, 1/γ2=3650, ρ/σ=2.
4. Discussion
We have derived analytical expressions for the correlation between susceptible and infected people and the R0 for the transmission of HIV on networks of dynamic sexual partnerships. These expressions provide clear explanations for the interaction between partnership dynamics and the transmissions during different stages of HIV infection. Due to its simplicity and consequent explanatory power, this model assuming concurrent partnerships provides a valuable addition to the study done in the context of the IB model (Kim et al., 2010) and to the study that assumes monogamous partnerships (Kretzschmar and Dietz, 1998). The analytic framework used makes clear that there are contrasting forces affecting the role of acute (i.e., PHI) and chronic (i.e., latent) infection as the duration of the partnership rises. These forces affect both the contribution of acute infection to the basic reproduction number (R0) and to the endemic level of infection. As partnership duration first rises through time periods in the same order of magnitude as the duration of acute infection, the contribution of acute infection decreases because higher transmission probability per act during acute infection leaves progressively more partnerships with dually infected individuals. But then as partnership duration becomes much longer than the duration of acute infection, the contributions from chronic infection decrease much more because acute infections progress to chronic infections while keeping their partners that may have already been infected during acute infection. This increases the likelihood that the partners during chronic infection are already infected and thus decreases the chance of transmission during chronic infection. Our study implies that interactions between transmissions during the course of HIV infection and partnership dynamics are strong and thus models that assume instantaneous partnerships (Abu-Raddad and Longini Jr, 2008; Koopman et al., 1997; Rapatski et al., 2005a) may not be adequate for assessing the role of different stages of HIV infection.
The fixed network model (Keeling, 2005; Keeling, 1997; Meyers et al., 2005; Newman, 2002) has often been used to relax the assumption of instantaneous contacts of the typical compartmental model. Although these studies of fixed network models have produced valuable results and a recent work presents a framework that can account for the growth of the network (Guerra and Gómez-Gardeñes, 2010), they are usually suited for modeling short-lived epidemics. The transmission of HIV is better represented as endemic infection in a population with ongoing and dynamic partnerships. Our study could serve as an important starting point for future models of HIV transmission on dynamic networks.
One study (Kretzschmar and Dietz, 1998) showed that the relative contribution of the early stage of HIV infection to the spread of HIV would be smaller when sexual partnerships change slowly than when sexual partnerships change rapidly in the context of monogamous sexual partnerships. The present shows that if sexual partnerships are concurrent, the relative contribution of PHI may be even higher when sexual partnerships change very slowly than when partnerships change rapidly.
Volz and others (Volz, 2008; Volz and Meyers, 2007) have introduced a method that uses the predefined distribution of the number of partners across the population while partnerships are dynamic. Our model assumes random partnership formation and dissolution, which leads to Poisson-distributed partnerships. It would be worth examining how our inferences on the fraction of transmissions during PHI will be influenced by the distribution of partnerships, which may significantly influence infection levels (Eames and Keeling, 2002; Volz and Meyers, 2007).
We have assumed a homosexual population with equal contributions of insertive and receptive sex acts on both sides of the relation. This assumption keeps the model simple such that we can focus on the interaction between the partnership dynamics and varying transmissibility during progression stages of HIV infection. However, per-act relative risk for acquisition of HIV differs between insertive and receptive acts both for vaginal and anal sex (Varghese et al., 2002) and thus it would be of interest to see how the directional assumption of sex would change our inference. We are currently pursuing this question and our preliminary work shows that increasing difference in the insertive and receptive transmission rates decreases the contribution of transmissions during PHI, which is not observed unless partnerships are long-term. This implies that we need to account for both long-term, concurrent sexual partnerships, and directionality of sex acts at the same time to address the question of relative role of different stages of HIV infection. Likewise we have assumed homogenous mixing and homogeneous partnership formation dynamics. Another real world complexity that will influence the fraction of transmissions is that people have a combination of short term encounters and ongoing partnerships, which one prior work (Xiridou et al., 2004) addressed in the context of monogamous partnerships. While all these aspects of reality will further modify the relative contribution of different stages of HIV infection to the overall transmission, by isolating the effects of partnership duration on R0 and endemic transmissions, we provide a basis for intuition about what will act in the real world. These intuitions will be important both in devising new methods to estimate transmission rates by stage of HIV infection and for evaluating the potential effects of intervention programs.
JSK and J-HK designed the experiments and wrote the paper. J-HK constructed and simulated the model. The authors thank Rick Riolo and the Center for the Study of Complex Systems at the University of Michigan, Ann Arbor for allowing us to use their computing resources. J-HK was supported by NIH R01-AI078752, University of Michigan, Blue Cross Blue Shield of Michigan Foundation, and Korea Science and Engineering Foundation. JSK was supported by NIH R01-AI078752.
Highlights.
We model HIV transmissions in a population where sexual partnerships form and dissolve over time.
We use a combination of analytical and numerical methods.
The role of primary HIV infection is lowest when sexual partnerships last around 100 days.
Standard models of HIV transmission may not be adequate to study the role of primary HIV infection.
Appendix
A.1 Time evolution equations for the correlation between S and I (CSI)
| (A.1) |
| (A.2) |
| (A.3) |
| (A.4) |
Plugging Equations (A.2)-(A.4) to Equation (A.1) gives
A.2 Equations for SI1I2 model
In the SI1I2 model, the state of people is represented as Xj, where X = S, I and j = 1, 2 indicate infection category and the stage of infection, respectively. The number of people in state Xj is denoted by [Xj]. Similarly, λj denotes the transmission rate per unit of time of the infected person in stage j in a partnership. The following equations describes the SI1I2 model:
| (A.5) |
A.3 Time evolution equations for CSI1 and CSI2
| (A.6) |
| (A.7) |
Letting both Equations (A.6) and (A.7) equal zero gives two equations for two variables.
Footnotes
Publisher's Disclaimer: This is a PDF file of an unedited manuscript that has been accepted for publication. As a service to our customers we are providing this early version of the manuscript. The manuscript will undergo copyediting, typesetting, and review of the resulting proof before it is published in its final citable form. Please note that during the production process errors may be discovered which could affect the content, and all legal disclaimers that apply to the journal pertain.
Contributor Information
Jong-Hoon Kim, Email: kimfinale@gmail.com, 2 Seaport Lane, 11th Floor, Boston, Massachusetts 02210, Fax: 1-617-385-3295, Tel: 1-734-657-8127.
James S. Koopman, Email: jkoopman@umich.edu, M5053 SPH II, 1415 Washington Heights, Ann Arbor, Michigan 48109-2029, Tel: 1-734-763-5629, Fax:1-734-998-6837
References
- Abu-Raddad LJ, Longini IM., Jr No HIV stage is dominant in driving the HIV epidemic in sub-Saharan Africa. AIDS. 2008;22:1055. doi: 10.1097/QAD.0b013e3282f8af84. [DOI] [PubMed] [Google Scholar]
- Abu-Raddad LJ, Longini IM., Jr No HIV stage is dominant in driving the HIV epidemic in sub-Saharan Africa. AIDS. 2008;22:1055–61. doi: 10.1097/QAD.0b013e3282f8af84. 00002030-200805310-00007 [pii] [DOI] [PubMed] [Google Scholar]
- Altmann M. Susceptible-infected-removed epidemic models with dynamic partnerships. Journal of Mathematical Biology. 1995;33:661–675. doi: 10.1007/BF00298647. [DOI] [PubMed] [Google Scholar]
- Anderson RM, May RM. Epidemiological parameters of HIV transmission. Nature. 1988;333:514–9. doi: 10.1038/333514a0. [DOI] [PubMed] [Google Scholar]
- Anderson RM, May RM. Infectious Diseases of Humans: Dynamics and Control 1992 [Google Scholar]
- Anderson RM, Gupta S, Ng W. The significance of sexual partner contact networks for the transmission dynamics of HIV. J Acquir Immune Defic Syndr. 1990;3:417–29. [PubMed] [Google Scholar]
- Anderson RM, Blythe SP, Gupta S, Konings E. The transmission dynamics of the human immunodeficiency virus type 1 in the male homosexual community in the United Kingdom: the influence of changes in sexual behaviour. Philos Trans R Soc Lond B Biol Sci. 1989;325:45–98. doi: 10.1098/rstb.1989.0074. [DOI] [PubMed] [Google Scholar]
- Bauch C, Rand DA. A moment closure model for sexually transmitted disease transmission through a concurrent partnership network. Proc Biol Sci. 2000;267:2019–27. doi: 10.1098/rspb.2000.1244. [DOI] [PMC free article] [PubMed] [Google Scholar]
- Blower SM, Boe C. Sex acts, sex partners, and sex budgets: implications for risk factor analysis and estimation of HIV transmission probabilities. J Acquir Immune Defic Syndr. 1993;6:1347–52. [PubMed] [Google Scholar]
- Cohen MS, Shaw GM, McMichael AJ, Haynes BF. Acute HIV-1 Infection. N Engl J Med. 2011;364:1943–54. doi: 10.1056/NEJMra1011874. [DOI] [PMC free article] [PubMed] [Google Scholar]
- Eames KTD, Keeling MJ. Modeling dynamic and network heterogeneities in the spread of sexually transmitted diseases. Proceedings of the National Academy of Sciences. 2002;99:13330–13335. doi: 10.1073/pnas.202244299. [DOI] [PMC free article] [PubMed] [Google Scholar]
- Fiebig EW, Wright DJ, Rawal BD, Garrett PE, Schumacher RT, Peddada L, Heldebrant C, Smith R, Conrad A, Kleinman SH, Busch MP. Dynamics of HIV viremia and antibody seroconversion in plasma donors: implications for diagnosis and staging of primary HIV infection. AIDS. 2003;17:1871–9. doi: 10.1097/01.aids.0000076308.76477.b8. [DOI] [PubMed] [Google Scholar]
- Gallo RC. Historical essay. The early years of HIV/AIDS. Science. 2002;298:1728–30. doi: 10.1126/science.1078050. 298/5599/1728 [pii] [DOI] [PubMed] [Google Scholar]
- Goodreau SM, Cassels S, Kasprzyk D, Montano DE, Greek A, Morris M. Concurrent Partnerships, Acute Infection and HIV Epidemic Dynamics Among Young Adults in Zimbabwe. AIDS Behav. 2010 doi: 10.1007/s10461-010-9858-x.. [DOI] [PMC free article] [PubMed] [Google Scholar]
- Gray RH, Wawer MJ, Brookmeyer R, Sewankambo NK, Serwadda D, Wabwire-Mangen F, Lutalo T, Li X, vanCott T, Quinn TC. Probability of HIV-1 transmission per coital act in monogamous, heterosexual, HIV-1-discordant couples in Rakai, Uganda. Lancet. 2001;357:1149–53. doi: 10.1016/S0140-6736(00)04331-2. S0140-6736(00)04331-2 [pii] [DOI] [PubMed] [Google Scholar]
- Guerra B, Gomez-Gardenes J. Annealed and mean-field formulations of disease dynamics on static and adaptive networks. Physical Review E. 2010;82:035101. doi: 10.1103/PhysRevE.82.035101. [DOI] [PubMed] [Google Scholar]
- Gupta S, Anderson RM, May RM. Networks of sexual contacts: implications for the pattern of spread of HIV. AIDS. 1989;3:807–17. [PubMed] [Google Scholar]
- Hollingsworth TD, Anderson RM, Fraser C. HIV-1 transmission, by stage of infection. J Infect Dis. 2008;198:687–93. doi: 10.1086/590501. [DOI] [PubMed] [Google Scholar]
- Hyman JM, Stanley E. Using mathematical models to understand the AIDS epidemic. Mathematical Biosciences. 1988;90:415–473. [Google Scholar]
- Hyman JM, Stanley EA. The effect of social mixing patterns on the spread of AIDS. Mathematical Approaches to Problems in Resource Management and Epidemiology. 1989;81:190–219. [Google Scholar]
- Jacquez JA, Koopman JS, Simon CP, Longini IM., Jr Role of the primary infection in epidemics of HIV infection in gay cohorts. J Acquir Immune Defic Syndr. 1994;7:1169–84. [PubMed] [Google Scholar]
- Jacquez JA, Simon CP, Koopman J, Sattenspiel L, Perry T. Modeling and analyzing HIV transmission: the effect of contact patterns. Mathematical Biosciences. 1988;92:119–199. [Google Scholar]
- Johnston MI, Fauci AS. An HIV vaccine--evolving concepts. N Engl J Med. 2007;356:207381. doi: 10.1056/NEJMra066267. 356/20/2073 [pii] [DOI] [PubMed] [Google Scholar]
- Joint United Nations Programme on HIV/AIDS. Report on the global AIDS epidemic. UNAIDS; 2010. [Google Scholar]
- Keeling M. The implications of network structure for epidemic dynamics. Theor Popul Biol. 2005;67:1–8. doi: 10.1016/j.tpb.2004.08.002. [DOI] [PubMed] [Google Scholar]
- Keeling MJ. Correlation models for childhood epidemics. Proceedings: Biological Sciences. 1997;264:1149–1156. doi: 10.1098/rspb.1997.0159. [DOI] [PMC free article] [PubMed] [Google Scholar]
- Keeling MJ. The effects of local spatial structure on epidemiological invasions. Proc Biol Sci. 1999;266:859–67. doi: 10.1098/rspb.1999.0716. [DOI] [PMC free article] [PubMed] [Google Scholar]
- Kim JH, Riolo RL, Koopman JS. HIV transmission by stage of infection and pattern of sexual partnerships. Epidemiology. 2010;21:676–84. doi: 10.1097/EDE.0b013e3181e6639f. [DOI] [PMC free article] [PubMed] [Google Scholar]
- Koopman J, Simon C, Jacquez J, Joseph J, Sattenspiel L, Park T. Sexual partner selectiveness effects on homosexual HIV transmission dynamics. JAIDS Journal of Acquired Immune Deficiency Syndromes. 1988;1:486. [PubMed] [Google Scholar]
- Koopman JS, Jacquez JA, Welch GW, Simon CP, Foxman B, Pollock SM, Barth-Jones D, Adams AL, Lange K. The role of early HIV infection in the spread of HIV through populations. J Acquir Immune Defic Syndr Hum Retrovirol. 1997;14:249–58. doi: 10.1097/00042560-199703010-00009. [DOI] [PubMed] [Google Scholar]
- Kretzschmar M, Dietz K. The effect of pair formation and variable infectivity on the spread of an infection without recovery. Mathematical Biosciences. 1998;148:83–113. doi: 10.1016/s0025-5564(97)10008-6. [DOI] [PubMed] [Google Scholar]
- May RM, Anderson RM. Transmission dynamics of HIV infection. Nature. 1987;326:137–42. doi: 10.1038/326137a0. [DOI] [PubMed] [Google Scholar]
- Meyers LA, Pourbohloul B, Newman MEJ, Skowronski DM, Brunham RC. Network theory and SARS: predicting outbreak diversity. Journal of Theoretical Biology. 2005;232:71–81. doi: 10.1016/j.jtbi.2004.07.026. [DOI] [PMC free article] [PubMed] [Google Scholar]
- Montagnier L. A history of HIV discovery. Science. 2002;298:1727. doi: 10.1126/science.1079027. [DOI] [PubMed] [Google Scholar]
- Morris M, Kretzschmar M. Concurrent partnerships and the spread of HIV. AIDS. 1997;11:641. doi: 10.1097/00002030-199705000-00012. [DOI] [PubMed] [Google Scholar]
- Morris M, Epstein H, Wawer M. Timing is everything: international variations in historical sexual partnership concurrency and HIV prevalence. PLoS One. 2010;5:e14092. doi: 10.1371/journal.pone.0014092. [DOI] [PMC free article] [PubMed] [Google Scholar]
- Morris M, Kurth AE, Hamilton DT, Moody J, Wakefield S. Concurrent partnerships and HIV prevalence disparities by race: linking science and public health practice. Am J Public Health. 2009;99:1023–31. doi: 10.2105/AJPH.2008.147835. AJPH.2008.147835 [pii] [DOI] [PMC free article] [PubMed] [Google Scholar]
- Newman MEJ. Spread of epidemic disease on networks. Physical Review E. 2002;66:016128. doi: 10.1103/PhysRevE.66.016128. [DOI] [PubMed] [Google Scholar]
- Pantaleo G, Graziosi C, Fauci AS. New concepts in the immunopathogenesis of human immunodeficiency virus infection. N Engl J Med. 1993;328:327–35. doi: 10.1056/NEJM199302043280508. [DOI] [PubMed] [Google Scholar]
- Pilcher CD, Eron JJ, Galvin S, Gay C, Cohen MS. Acute HIV revisited: new opportunities for treatment and prevention. 2004a doi: 10.1172/JCI21540. [DOI] [PMC free article] [PubMed] [Google Scholar]
- Pilcher CD, Tien HC, Eron JJ, Jr, Vernazza PL, Leu SY, Stewart PW, Goh LE, Cohen MS. Brief but Efficient: Acute HIV Infection and the Sexual Transmission of HIV. Journal of Infectious Diseases. 2004b;189:1785–1792. doi: 10.1086/386333. [DOI] [PubMed] [Google Scholar]
- Pinkerton SD. AIDS Behav. 2007. Probability of HIV Transmission During Acute Infection in Rakai, Uganda. [DOI] [PMC free article] [PubMed] [Google Scholar]
- Pinkerton SD. Probability of HIV transmission during acute infection in Rakai, Uganda. AIDS and Behavior. 2008;12:677–684. doi: 10.1007/s10461-007-9329-1. [DOI] [PMC free article] [PubMed] [Google Scholar]
- Quinn TC, Wawer MJ, Sewankambo N, Serwadda D, Li C, Wabwire-Mangen F, Meehan MO, Lutalo T, Gray RH. Viral load and heterosexual transmission of human immunodeficiency virus type 1. Rakai Project Study Group. New England Journal of Medicine. 2000;342:921–9. doi: 10.1056/NEJM200003303421303. [DOI] [PubMed] [Google Scholar]
- Rand DA. Correlation equations and pair approximations for spatial ecologies. Theoretical Ecology. 1997;2 [Google Scholar]
- Rapatski BL, Suppe FPD, Yorke JA. HIV Epidemics Driven by Late Disease Stage Transmission. JAIDS Journal of Acquired Immune Deficiency Syndromes. 2005a;38:241–253. [PubMed] [Google Scholar]
- Rapatski BL, Suppe F, Yorke JA. HIV Epidemics Driven by Late Disease Stage Transmission. JAIDS Journal of Acquired Immune Deficiency Syndromes. 2005b;38:241. [PubMed] [Google Scholar]
- Stigum H, Falck W, Magnus P. The core group revisited: the effect of partner mixing and migration on the spread of gonorrhea, Chlamydia, and HIV. Math Biosci. 1994;120:1–23. doi: 10.1016/0025-5564(94)90036-1. [pii] [DOI] [PubMed] [Google Scholar]
- Stigum H, Magnus P, Bakketeig LS. Effect of changing partnership formation rates on the spread of sexually transmitted diseases and human immunodeficiency virus. Am J Epidemiol. 1997;145:644–52. doi: 10.1093/oxfordjournals.aje.a009162. [DOI] [PubMed] [Google Scholar]
- Varghese B, Maher JE, Peterman TA, Branson BM, Steketee RW. Reducing the risk of sexual HIV transmission: quantifying the per-act risk for HIV on the basis of choice of partner, sex act, and condom use. Sex Transm Dis. 2002;29:38–43. doi: 10.1097/00007435-200201000-00007. [pii] [DOI] [PubMed] [Google Scholar]
- Volz E. SIR dynamics in random networks with heterogeneous connectivity. J Math Biol. 2008;56:293–310. doi: 10.1007/s00285-007-0116-4. [DOI] [PMC free article] [PubMed] [Google Scholar]
- Volz E, Meyers LA. Susceptible-infected-recovered epidemics in dynamic contact networks. Proc Biol Sci. 2007;274:2925–33. doi: 10.1098/rspb.2007.1159. MR21H6565423M055 [pii] [DOI] [PMC free article] [PubMed] [Google Scholar]
- Watts CH, May RM. The influence of concurrent partnerships on the dynamics of HIV/AIDS. Mathematical Biosciences. 1992;108:89–104. doi: 10.1016/0025-5564(92)90006-i. [DOI] [PubMed] [Google Scholar]
- Wawer MJ, Gray RH, Sewankambo NK, Serwadda D, Li X, Laeyendecker O, Kiwanuka N, Kigozi G, Kiddugavu M, Lutalo T, et al. Rates of HIV-1 Transmission per Coital Act, by Stage of HIV-1 infection, in Rakai, Uganda. The Journal of Infectious Diseases. 2005;191:1403–9. doi: 10.1086/429411. [DOI] [PubMed] [Google Scholar]
- World Health Organization. The global burden of disease: 2004 update. World Health Organization; 2008. [Google Scholar]
- Xiridou M, Geskus R, de Wit J, Coutinho R, Kretzschmar M. Primary HIV infection as source of HIV transmission within steady and casual partnerships among homosexual men. AIDS. 2004;18:1311. doi: 10.1097/00002030-200406180-00010. [DOI] [PubMed] [Google Scholar]