Abstract
Intramolecular electron transfer (IET) between the molybdenum and heme centers of vertebrate sulfite oxidase (SO) is proposed to be a key step in the catalytic cycle of the enzyme. However, the X-ray crystallographic distance between these centers, RMoFe = 32.3 Å, appears to be too long for the rapid IET rates observed in liquid solution. The Mo and heme domains are linked by a flexible tether, and it has been proposed that dynamic interdomain motion brings the two metal centers closer together and thereby facilitates rapid IET. To date there have been no direct distance measurements for SO in solution that would support or contradict this model. In this work, pulsed electron-electron double resonance (ELDOR) and relaxation induced dipolar modulation enhancement (RIDME) techniques were used to obtain information about RMoFe in the Mo(V)Fe(III) state of wild type recombinant human SO in frozen glassy solution. Surprisingly, the data obtained suggest a fixed structure with RMoFe = 32 Å, similar to that determined by X-ray crystallography for chicken SO, although the orientation of the RMoFe radius-vector with respect to the heme center was found to be somewhat different. The implications of these findings for the flexible tether model are discussed.
Keywords: Sulfite oxidase, ELDOR, RIDME, Pulsed EPR
Introduction
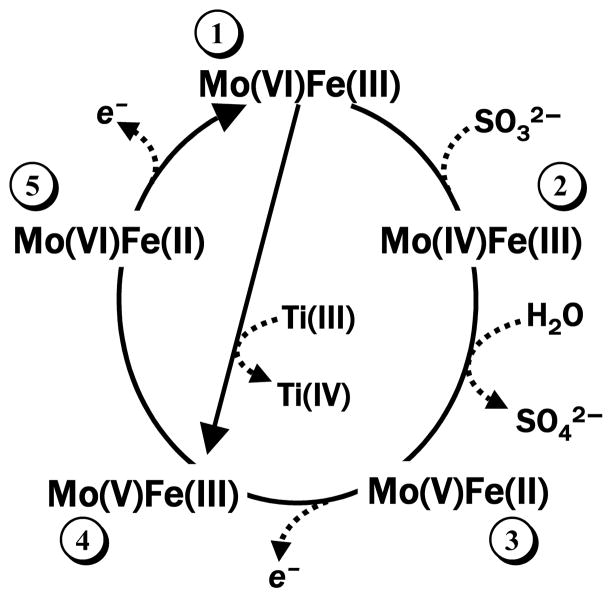
Sulfite oxidase (SO) catalyzes the conversion of harmful sulfite to benign sulfate and is an essential enzyme for normal neonatal neurological development.1,2 The oxidation of sulfite takes place at the molybdenum active center, but the proposed overall catalytic cycle critically depends on the intramolecular electron transfer (IET) steps between the Mo center and the heme electron acceptor (steps 2→3 and 4→5 in the simplified catalytic cycle in Figure 1).3 Generally, the distance between ET cofactors is a key parameter determining ET rates and affecting the overall efficiency of catalysis.4–7 Therefore, knowledge of the distance between the Mo and heme centers, RMoFe, is necessary for better understanding of the SO mechanism. Structurally, the SO enzyme is a homodimer, with each monomer consisting of Mo and heme domains connected by a flexible interdomain tether.8 The specific conformation of the chicken SO (cSO) enzyme obtained by X-ray crystallography8 (see Figure 2) gives a distance between the Mo and heme centers of RMoFe = 32.3 Å. This distance, however, appears to be in contradiction with the rapid IET rates of up to 1400 s−1 observed in liquid solution.9,10 From the analyses of biological ET based on simple Marcus theory,11,12 it has been predicted that ket for cSO should be less than 100 s−1,13 given the observed large interdomain distance and small driving force (10 mV at pH 6).14
Figure 1.
A simplified catalytic cycle of SO. The Mo(VI)Fe(III) state numbered as 1 is the resting state of the enzyme. The Mo(V)Fe(III) state (number 4) is the only state with both of the metal centers being paramagnetic. This state is used in this work for the EPR distance measurements. The straight arrow connecting states 1 and 4 shows the preparation of the Mo(V)Fe(III) state from the resting state by Ti(III) citrate reduction of the Mo center.
Figure 2.
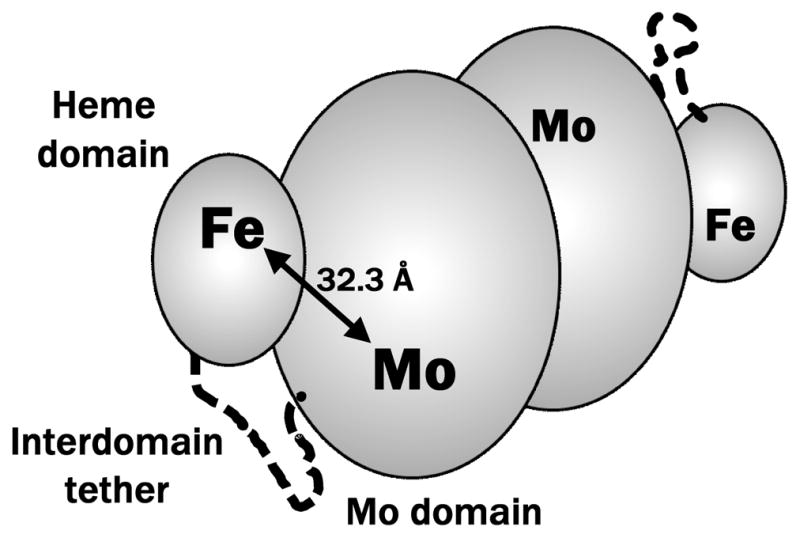
Schematic representation of the vertebrate SO enzyme. The protein is homodimeric, with each monomer consisting of Mo and heme domains connected by a flexible interdomain tether (these elements are indicated for one of the monomers). The specific conformation shown in the Figure and the distance between the Mo and Fe atoms, RMoFe = 32.3 Å, correspond to the published X-ray structure of the chicken SO (pdb 1SOX).8
The IET kinetics for SO were rationalized by suggesting that dynamic relative motion of the Mo and heme domains, which are joined by a flexible polypeptide tether, can bring the domains closer together and allow for faster IET.10 This hypothesis was supported by the observation of viscosity dependence of the IET rates15 and by recent molecular dynamics calculations.16,17 Based on this hypothesis, the relative positions of the heme and Mo centers in an ensemble of SO proteins are expected to be statistically distributed at any moment in time, and a snapshot of this distribution should be realized in a frozen sample. However, no direct experimental evidence for these expectations has ever been obtained.
One of possible approaches to obtain the information about the distance between the Mo and heme centers in frozen solutions is based on measuring the magnetic dipole interaction between the paramagnetic Fe(III) heme and Mo(V) centers using the pulsed electron paramagnetic resonance (EPR) techniques of electron-electron double resonance (ELDOR)18 and relaxation-induced dipolar modulation enhancement (RIDME).19 These and other20–23 pulsed EPR techniques based on the same principle have been successfully used to measure distances between paramagnetic centers in biological systems.24–33 In our previous work on this subject34 we have undertaken a pulsed ELDOR study of cSO, where the Mo(V)Fe(III) state was obtained from the resting Mo(VI)Fe(III) state by reduction of Mo with Ti(III) citrate (see Figure 1). Unfortunately, the formation of a crystalline powder (rather than glassy) state of the frozen sample in that work resulted in aggregation of the SO protein. This made the distance measurements for the Fe(III)-Mo(V) pair impossible because the intraprotein distances became comparable with the interprotein distances.
In this work we have revisited the problem of distance measurements between the Mo(V) and Fe(III) heme centers of SO. Special care was taken to prepare glassy frozen samples of wild type (wt) recombinant human SO (hSO), which prevented protein aggregation and provided the optimal conditions for intraprotein distance measurements. Surprisingly, the dipole interaction spectra obtained by pulsed ELDOR show a strong dependence on the observation position within the Fe(III) heme EPR spectrum. This result indicates that the disorder in the relative arrangement of the Fe(III) and Mo(V) centers is actually minimal, at least in the Mo(V)Fe(III) state of wt hSO, and may require the development of a new structural model for describing the interaction between the heme and molybdenum domains in SO.
Materials and Methods
The Mo(V)Fe(III) state of wt hSO was prepared by reduction with Ti(III) citrate, as described in the previous work34 and schematically illustrated by Figure 1. Specifically, recombinant wt hSO was expressed and purified according to previously described methods.35 A stock solution of Ti(III) citrate was prepared anaerobically based on a literature method, 36 from 1 mL of Ti(III)Cl3 (30% w/v in 2 M HCl) and 9 mL of an aqueous trisodium citrate solution (0.5 M). The Ti(III) citrate stock solution had a final concentration of 55 mM (ξ340 = 730 M−1 cm−1).36 A more dilute Ti(III) citrate solution (5 mM, pH 6.0) was prepared by 10-fold dilution of the stock solution in Bis-Tris buffer. The wt hSO was exchanged into 20 mM Bis-Tris acetate buffer, pH 6.0 and made anaerobic. The final enzyme solution (700 μM hSO, 100 μL) contained 50% glycerol. Ti(III) citrate (70 μM) was added to the enzyme sample and transferred to an EPR tube, which was immediately frozen in liquid N2.
The electron spin echo (ESE) experiments were performed on the homebuilt broadband pulsed EPR spectrometer operating in the X and Ku microwave (mw) frequency bands (8 – 18 GHz).37 The ELDOR and RIDME pulse sequences used in this work are shown in Figure 3. The detailed experimental parameters are given in the Figure captions.
Figure 3.
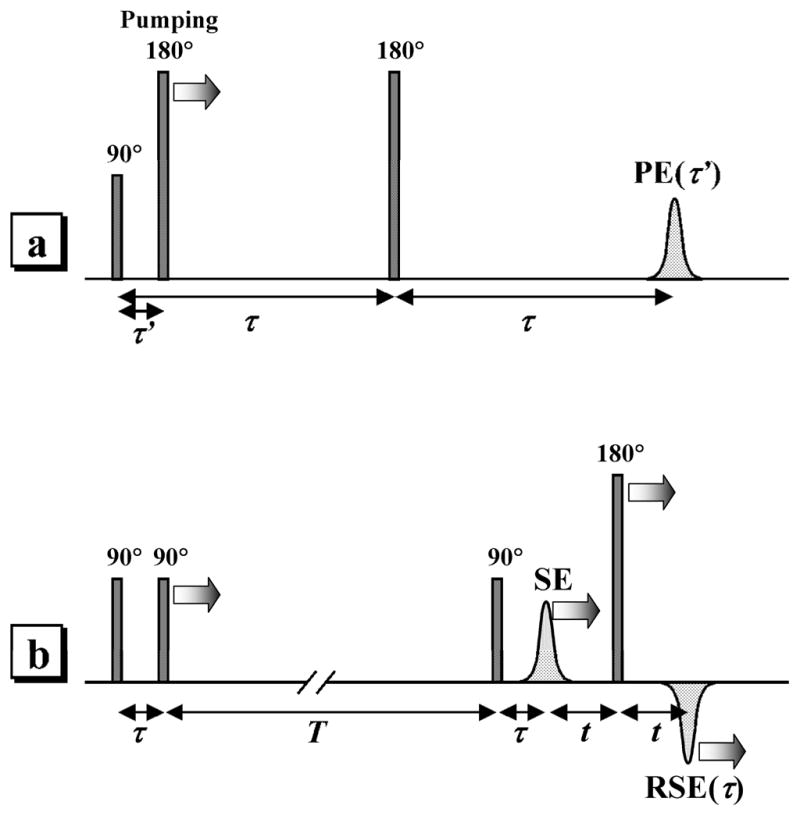
a) Three-pulse ELDOR sequence used in this work. The pumping pulse is in resonance with Mo(V). The observation pulses are in resonance with Fe(III). “PE” is the primary ESE signal of Fe(III). b) Refocused stimulated ESE sequence used for RIDME measurements. All pulses are in resonance with Mo(V). “SE” and “RSE” are, respectively, stimulated and refocused stimulated ESE signals of Mo(V). The longitudinal relaxation of Fe(III) serves as a natural “pumping”, flipping the Fe(III) spins.
Results and Discussion
1. Field-sweep ESE spectra
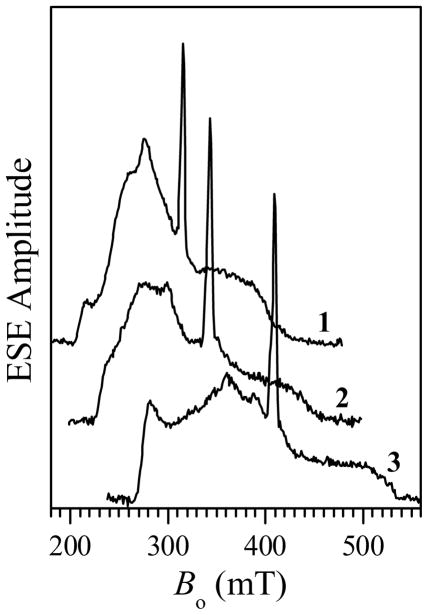
The pulsed ELDOR experiments were performed at X-band, using three resonance mw frequencies, νmw, available in our dielectric X-band resonator (ca. 8.7, 9.5, and 11.3 GHz). The two-pulse field sweep spectra of wt hSO in the Mo(V)Fe(III) state obtained at these mw frequencies are shown in Figure 4. The broad low-amplitude spectrum with turning points at (gX, gY, gZ) ≈ (1.45, 2.25, 3.0) belongs to the low-spin Fe(III) heme center. The narrow peak at g ~ 2 originates from the low-pH (lpH) Mo(V) species. The solid line in Figure 5 shows the expanded view of the field sweep spectrum of the Mo(V) species obtained at νmw = 9.45 GHz. At the other two resonance frequencies the spectra are very similar: slightly narrower at νmw = 8.681 GHz (short-dashed line) and slightly wider at νmw = 11.291 GHz (long-dashed line).
Figure 4.
Traces 1 – 3, two-pulse ESE field sweeps at the mw frequencies of 8.681, 9.450, and 11.291 GHz, respectively. The narrow signal belongs to Mo(V), while the broad low-amplitude signal comes from the Fe(III) heme center. Other experimental conditions: mw pulses, 10 and 15 ns; time intervals between the mw pulses, τ = 240–260 ns; temperature, 10 K.
Figure 5.
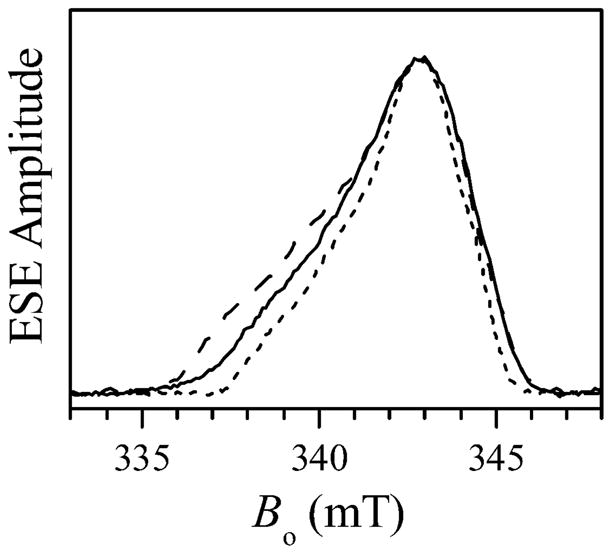
Two-pulse field sweep ESE spectra of the Mo(V) center obtained at the mw frequencies of 9.450 GHz (solid line), 11.291 GHz (long-dashed line), and 8.681 GHz (short-dashed line). The Bo scale corresponds to the solid line spectrum (νmw = 9.450 GHz). The other two spectra are only presented to show the linewidth variation with νmw. The true Bo positions for the long-dashed (νmw = 11.291 GHz) and short-dashed (νmw = 8.681 GHz) spectra are, respectively, about 66.5 mT higher and 28 mT lower that those shown in the Figure. Other experimental conditions: mw pulses, 10 and 15 ns; time interval between the mw pulses, τ = 410 ns; temperature, 10 K.
Although the g-tensor of the Mo(V) lpH species is slightly rhombic ((g1, g2, g3) ≈ (1.966, 1,972, 2.004),38 this rhombicity is not resolved in the X-band field sweep spectra obtained under low-resolution conditions (short mw pulses and short boxcar integration gate: see Figure 5). The strong hyperfine interaction (hfi) of the hydroxyl ligand proton is also responsible for the lack of resolution between the g1 and g2 turning points because the 1H hfi splittings of about 1 mT38 are comparable with the difference in resonance magnetic field between the g1 and g2 EPR turning points: from 1 mT at νmw = 8.7 GHz to 1.3 mT at νmw = 11.3 GHz. Therefore, for the purposes of this work, it is an adequate approximation to consider the EPR spectrum of Mo(V) as axial, with the principal g-values (g⊥, g||) ≈ (1.969, 2.004).
2. Pulsed ELDOR experiments
In the pulsed ELDOR experiments, the pumping mw frequency, νpmp, was in resonance with g⊥ of the Mo(V) center (corresponds to the maximum of the Mo(V) signal). The observation mw frequency, νobs, was in resonance with the Fe(III) heme center. The experiments were performed with νpmp and νobs corresponding to different modes of the resonator. The EPR positions within the Fe(III) heme spectrum corresponding to each of the possible combinations of (νpmp, νobs) are easily understandable from Figure 4, and the corresponding observation magnetic fields and g-values are listed in Table 1.
Table 1.
Combinations of νpmp (in resonance with g⊥ of Mo(V)) and νobs (in resonance with Fe(III)) used in pulsed ELDOR experiments, and the corresponding magnetic fields and observation g-values of the Fe(III) signal.
| νpmp (GHz) | νobs (GHz) | Bo (mT) | g |
|---|---|---|---|
| 8.681 | 11.291 | 315 | 2.56 |
| 9.450 | 11.291 | 342.9 | 2.35 |
| 8.681 | 9.450 | 315 | 2.14 |
| 9.450 | 8.681 | 342.9 | 1.81 |
| 11.291 | 9.450 | 409.7 | 1.65 |
In our experiments, the three-pulse ELDOR technique (see Figure 3a)18 was used. This choice was determined by the following factors. First, because of the strong electron spin echo envelope modulation (ESEEM) caused by the hfi and nuclear quadrupole interaction (nqi) of 14N nuclei in the heme pyrrole rings and axial histidine ligands, the ESE signal amplitude in the four-pulse ELDOR technique was significantly smaller than in the three-pulse one, which complicated the setup procedure and reduced the signal/noise ratio. In addition, the initial trial measurements have shown that the frequencies of the dipolar oscillations were low (the oscillation period of several hundred ns was much longer than the characteristic dead time of about 20 ns determined by the mw pulse durations), and therefore the necessity to implement the four-pulse ELDOR technique did not even arise.
Regarding the strong 14N ESEEM in the context of the three-pulse ELDOR experiments, it is of note that the presence of this ESEEM limits the choice of the time intervals τ between the observation pulses to just a few discrete values where the primary ESE signal of the heme center is essentially non-zero (see examples of two-pulse ESEEM in Supporting Information (SI), Figure S1). Therefore, the typical time interval τ was about 1.2 – 1.5 μs, and it varied depending on the pumping and observation frequencies used in a given experiment.
When the pumping and observation frequencies correspond to different modes of the resonator, there is always a question of spatial overlap of the mw field distributions corresponding to these modes. In an extreme situation of the absence of any overlap, the pumping pulse will flip spins in one part of the sample, while the observation pulses will affect the spins in another part of the sample. Obviously, no ELDOR effect is possible in such a case. A practical measure of the spatial overlap of these field distributions is the ELDOR effect due to the uniformly distributed spins (matrix ELDOR effect), which has the form of an exponential (or nearly exponential34) decay, i.e., V(τ′) ∝ exp(−kmatτ′), where V is the ESE amplitude and kmat is the characteristic decay constant. Figure S2 of the SI shows that the decay constants kmat vary from about 0.04/μs to 0.1/μs, depending on the specific choice of νobs and νpmp. A similar situation was observed in our previous work on this subject, where a C-band resonator was used.34
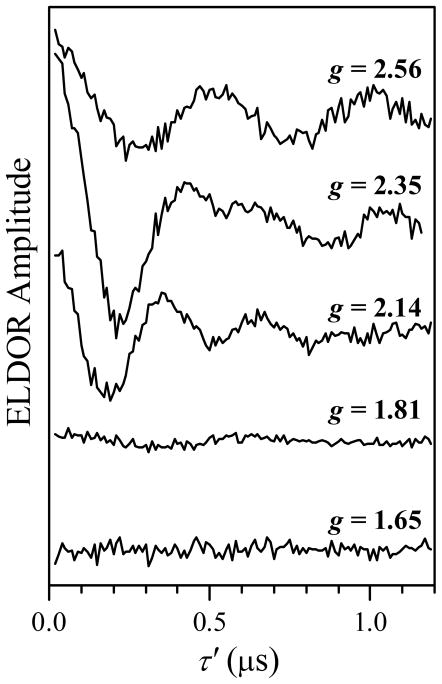
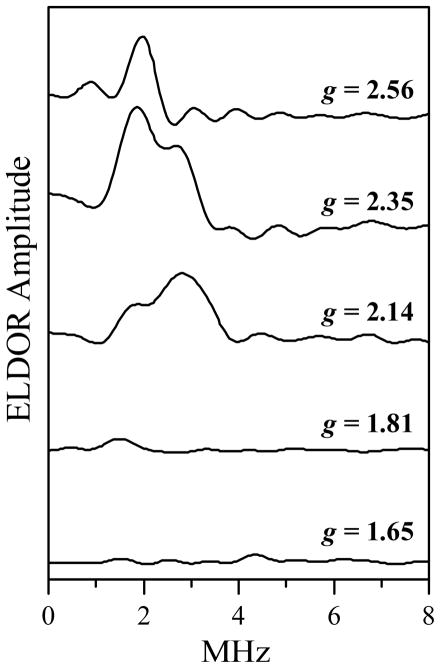
In addition to the mode overlap, kmat is proportional to the observation g-value, gobs, and the excitation range of the pumping pulse.34 The ELDOR effect from the pair also scales with the pumping excitation range. Therefore, in order to enable a comparison of the intrapair ELDOR amplitudes obtained for different combinations of νpmp and νobs, the experimental ELDOR traces were normalized by the initial ESE amplitudes (at τ′ → 0) and by the (kmat/gobs) values, and then the non-oscillating matrix contributions were subtracted from them. The resulting pulsed ELDOR traces are shown in Figure 6. The corresponding observation g-values of the Fe(III) heme center, gobs, are indicated at each trace. Figure 7 shows the cosine Fourier transform (FT) spectra of the traces shown in Figure 6. One can see a very strong orientation dependence of the ELDOR effect, which indicates a significant degree of conformational order in the system, specifically, in the orientation of the radius-vector RMoFe joining the Mo(V) and Fe(III) centers, and in the orientation of the Mo(V) g-frame with respect to the Fe(III) g-frame.
Figure 6.
ELDOR traces obtained at various EPR positions across the Fe(III) EPR spectrum (as indicated by the g-values). The ELDOR pulse sequence is shown in Figure 3a. The traces have been normalized by the ESE amplitude at τ′ → 0 and by (kmat/gobs), as explained in the text, and then the non-oscillating component was subtracted from them. The Mo(V) signal was used for pumping, and Fe(III) for observation. The mw frequencies and magnetic fields are listed in Table 1. Other experimental conditions: observation mw pulses, 10 and 15 ns; pumping mw pulse, 9 ns; τ = 1270, 1170, 1500, 1240, and 1400 ns for the traces obtained at g = 2.56, 2.35, 2.14, 1.81, and 1.65, respectively; temperature, 10 K.
Figure 7.
Cosine FT spectra of the ELDOR traces shown in Figure 6.
3. RIDME experiments
While the pulsed ELDOR data shown in Figures 6 and 7 already contain all the structural information about the relative spatial arrangement of the heme and Mo centers, extracting this information is not a simple task because the strong g-anisotropy of the heme center leads to a noticeable rescaling of the dipole interaction (see below). As a result, the dipole interaction depends not only on the distance RMoFe, but also on the orientation of RMoFe with respect to the heme g-frame.
In order to simplify the interpretation of the orientation-dependent pulsed ELDOR spectra, additional information can be obtained from Mo(V) RIDME measurements. In RIDME, all of the Fe(III) spins contribute to the dipolar spectra, regardless of the orientation of Fe(III) g-frame with respect to the magnetic field, Bo. The overall approach to the RIDME experiment was described in detail in an earlier work, where the distance between Fe(III) heme center and flavin mononucleotide semiquinone radical (FMNH•) in nitric oxide synthase (NOS) was determined.39 In that study, the g-anisotropy of FMNH• was completely negligible, even under the conditions of the Ka band experiment, whereas the g-anisotropy of the Mo(V) center of SO is well-resolved already at X-band. However, this does not lead to complications due to the rescaling of the dipole interaction as a function of the orientation of RMoFe with respect to the Mo(V) g-frame because the g-factor remains very close (with 1.5% accuracy) to 2. Nonetheless, the orientational selectivity resulting from the Mo(V) g-anisotropy has to be taken into account.
In the RIDME experiments, the refocused stimulated ESE sequence of Figure 3b was utilized, and the amplitude of the refocused stimulated ESE signal (“RSE” in Figure 3b) of the Mo(V) center was measured as a function of the time interval τ between the first and second mw pulses, while the time intervals T (between the second and third mw pulses) and t (between the stimulated ESE signal and the refocusing fourth pulse) were kept fixed. The specific value for the time interval t is not very important, and it is usually selected to be as small as possible in order to maximize the RSE signal. The choice of the time interval T, however, is related to the measurement temperatures, as explained below.
The RIDME measurements were performed at two temperatures, Tlow and Thigh (Thigh > Tlow). At the temperature Tlow, the Fe(III) spins practically do not flip during the time interval T, and the contribution of the dipole interaction between the Mo(V) and heme centers to the Mo(V) ESEEM is small. At the temperature Thigh, the rapid longitudinal relaxation of the Fe(III) spins causes a significant proportion of them to flip during the time interval T. The reorientation of the Fe(III) spin changes the local magnetic field for the neighboring Mo(V) spin by Do/gβ (where Do is the dipole interaction constant and β is the Bohr magneton), and results in the dipolar ESEEM with the frequency Do. In order to separate the dipolar ESEEM from the ESEEM caused by the hfi and nqi of magnetic nuclei, the RIDME trace recorded at Thigh is divided by the trace recorded at Tlow:
| (1) |
The two measurement temperatures, Tlow and Thigh, were selected from the following considerations. The temperature Tlow was selected to ensure that the longitudinal relaxation time of the Fe(III) heme center, T1Fe, was possibly long: T1Fe ≫ T, while the longitudinal relaxation time of Mo(V), T1Mo, was still sufficiently short (although T1Mo ≫ T1Fe) to enable the measurements of the Mo(V) ESE signal at reasonable repetition rates of at least ten Hz. The temperature Thigh was chosen in such a way as to provide T > T1Fe ≫ τ. The inversion recovery experiments with the heme center (see Figure S3 of the SI) have resulted in Tlow = 10 K and Thigh = 15 K as optimal temperatures for the RIDME measurements. At Tlow the longitudinal relaxation time of the heme center was rather long, T1Fe = 100 μs, while at Thigh it was only about 8 μs. Accordingly, the time interval T = 50 μs was chosen to ensure the complete relaxation of the Fe(III) spins at the temperature Thigh, which corresponded to the spin flip probability of 50%.
Since the EPR spectrum of Mo(V) overlaps with the spectrum of the Fe(III) heme center, the ESE signal measured at the temperature Tlow actually represents a sum of the Mo(V) and Fe(III) ESE signals. In order to separate the Mo(V) contribution, the RSE traces have been recorded with the repetition rates of 10 Hz and 1000 Hz, and then the second trace was subtracted from the first one. At Tlow = 10 K and the repetition rate of 1000 Hz, the Fe(III) ESE signal does not saturate, while the Mo(V) signal saturates very strongly and practically disappears. Therefore, the difference RSE signal is contributed to by the Mo(V) center only, and it this signal, which is denoted as RSE(τ, Tlow) in eq 1.
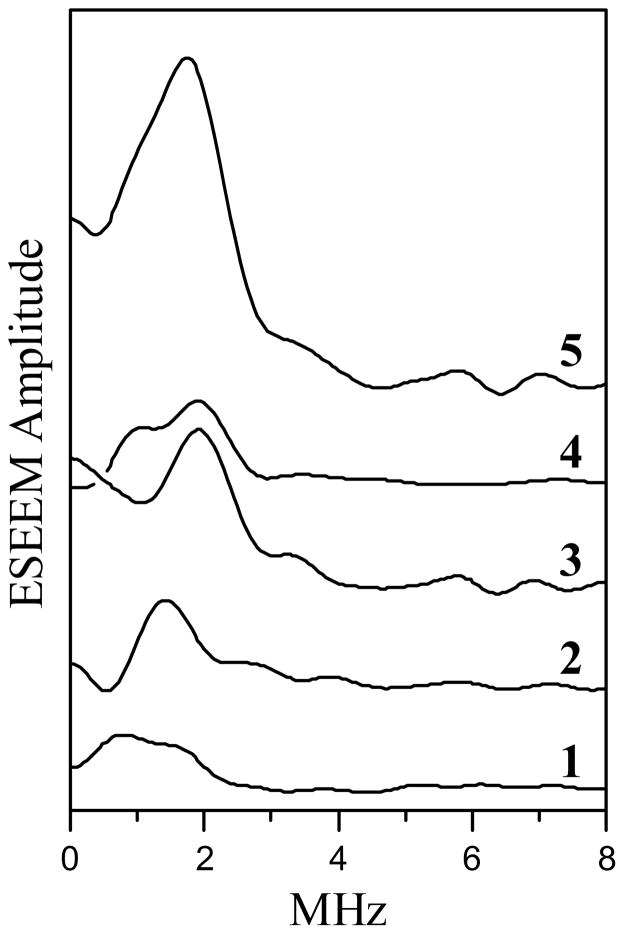
Traces 1 through 4 in Figure 8 show the RIDME spectra obtained at several Mo(V) EPR positions approximately uniformly spaced between g// and g⊥ turning points. These spectra were obtained as cosine FT of the quotient RIDME trace described by eq 1 and scaled vertically in proportion with the relative amplitude of the Mo(V) ESE field sweep at the measurement magnetic field. Trace 5 in Figure 8 is a field-integrated (FI) RIDME spectrum obtained as a sum of traces 1 through 4. The FI RIDME spectrum thus approximates a dipolar spectrum corresponding to the situation of complete orientational disorder.
Figure 8.
RIDME spectra (cosine FT of RIDME ESEEM) of Mo(V) obtained using the refocused stimulated ESE pulse sequence shown in Figure 3b. Traces 1 – 4 are obtained at various EPR positions from g// to g⊥. The shown relative amplitudes of these traces reflect the relative amplitudes of the Mo(V) field sweep spectrum at the measurement magnetic fields. Trace 5, field-integrated (FI) RIDME spectrum obtained as a sum of traces 1–4. Trace 5 thus approximately corresponds to a situation of complete orientational disorder. Experimental conditions: νmw = 9.431 GHz; Bo = 338.4, 341.2, 342.2, and 343.9 mT for traces 1–4, respectively; mw pulses, 7, 7, 7, and 12 ns; T = 50 μs; t = 250 ns; temperatures, Tlow = 10 K and Thigh = 15 K.
4. Numerical simulations of the RIDME spectra
In order to obtain information about RMoFe and the orientation( s) of RMoFe with respect to the heme g-frame, numerical simulations of dipolar spectra obtained by pulsed ELDOR and RIDME techniques were performed. The dipole interaction was described by the following expression appropriate for the interaction between the centers with strong g-anisotropy (heme center) and weak g-anisotropy (Mo(V), g ≈ 2):39
| (2) |
where X, Y, and Z are the principal axes and gj are the principal components of the heme iron g-tensor, gFe = [(gXbX)2+(gYbY)2+(gZbZ)2]1/2, bk are the direction cosines describing the orientation of Bo in the heme g-frame. are the components of a reference dipole interaction tensor defined for two spins with isotropic g = 2, i.e., with the dipole interaction constant , where β is the Bohr magneton, h is the Planck constant, and rk are the direction cosines describing the orientation of RMoFe in the heme g-frame. From eq 2 it follows that the anisotropic g-factor of Fe(III) results in effective elongation or shortening of with the factor of , which leads to the observable ratio |D///D⊥| in the dipolar spectra being generally different from 2.
As mentioned above, the orientation-dependent ELDOR spectra of wt hSO suggest that the degree of disorder in the orientation and length of RMoFe is insignificant. Based on this qualitative conclusion, the model used in our numerical simulations will assume both the orientation and length of RMoFe to be fixed.
The RIDME spectra were calculated first. The orientation of RMoFe in the heme g-frame was defined by the polar and azimuthal angles, θR and ϕR, respectively. These angles were varied systematically within their standard definition limits, and for each set of the angles the dipole interaction constant Do was selected in such a way that the maximum of the calculated RIDME spectrum coincided with that in the experimental spectrum. The selection criterion for the acceptable structural parameters was the absence in the simulated spectra of the pronounced D// shoulder extending to the higher frequencies beyond the limits of the experimental spectrum.
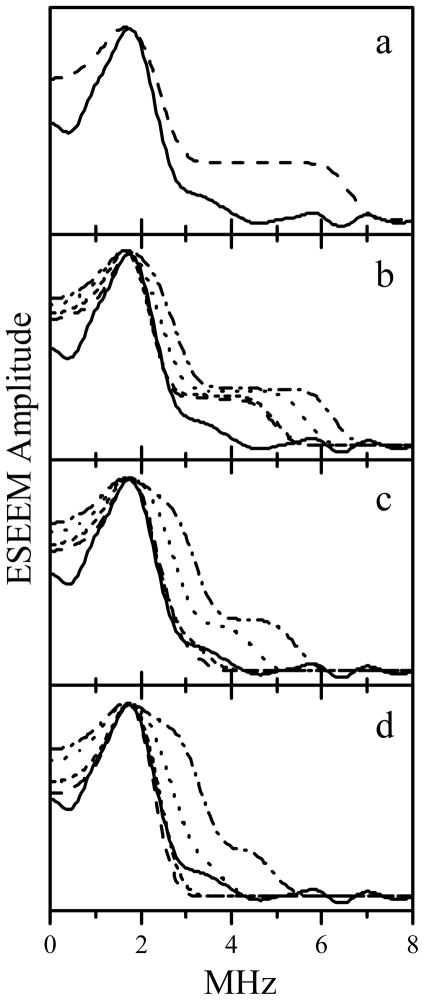
Examples of calculated spectra are shown in Figure 9. The solid trace in each panel is the experimental FI RIDME spectrum. Dashed, short-dashed, dotted, and dash-dotted spectra correspond to the azimuthal angles ϕR = 0°, 30°, 60°, and 90°, respectively. Depending on the choice of θR and ϕR, the optimal Do varies from 1.55 to 2.2 MHz. The complete set of simulation parameters is given in Table 2. The approximate fit of the total spectrum shape is achieved at θR = 50°– 90°, and ϕR = 0° – 30°. These angles correspond to Do = 1.55 – 1.6 MHz, and RMoFe ≈ 32.3 – 32.6 Å.
Figure 9.
Comparison of experimental FI RIDME spectrum of Mo(V) with the simulated dipole interaction spectra. The solid trace in each panel is the experimental FI RIDME spectrum, the same as trace 5 in Figure 8. Dashed, short-dashed, dotted, and dash-dotted traces in all panels are simulated with parameters described in Table 2. To emulate the experimental line width, the simulated “ideal” spectra were Fourier-transformed, truncated to a 1 μs time interval, apodized using a cosine window, and Fourier-transformed back to the frequency domain.
Table 2.
Reference dipole interaction tensors (D(2) = (Do, Do, −2Do)) and their orientations used for simulating the dipole interaction spectra in Figure 9.
| Panel in Fig. 9 | Dashed trace Do (MHz), θR, ϕR | Shortdashed trace Do (MHz), θR, ϕR | Dotted trace Do (MHz), θR, ϕR | Dashdotted trace Do (MHz), θR, ϕR |
|---|---|---|---|---|
| a | 2.2, 0°, 0° | - | - | - |
| b | 1.8, 30°, 0° | 1.8, 30°, 30° | 2.0, 30°, 60° | 2.2, 30°, 90° |
| c | 1.6, 60°, 0° | 1.6, 60°, 30° | 1.9, 60°, 60° | 2.2, 60°, 90° |
| d | 1.55, 90°, 0° | 1.6, 90°, 30° | 1.8, 90°, 60° | 2.15, 90°, 90° |
5. Numerical simulations of pulsed ELDOR spectra
The RIDME simulations described above have resulted in a well-defined RMoFe of 32.3 – 32.6 Å, while the limits of possible orientations of RMoFe were still rather broad. In order to further refine the structural information, numerical simulations of the pulsed ELDOR spectra were performed. An important factor to take into account in these simulations is the limited range of orientations of Bo with respect to the Mo(V) g-frame corresponding to the excitation range of the pumping pulse in resonance with g⊥. Approximating the mw excitation profile by a rectangular function of the characteristic width Δνmw ~ 1/tp, one can estimate Δνmw ~ 110 MHz for the 180° pumping pulse with tp = 9 ns used in our experiments (the actual excitation profile is shown in Figure S4 of the SI). This frequency range corresponds to the magnetic field range of 4 mT and to the range of angles between the Mo(V) g// axis and Bo contributing to the ELDOR effect, θMoB, from about 60° to 90°. This estimate and the fact that the ELDOR effect amplitude dramatically decreases for the high-field observation positions (see Figures 6 and 7) allow us to conclude that the Mo(V) g// axis should point in a general direction of the heme gX.
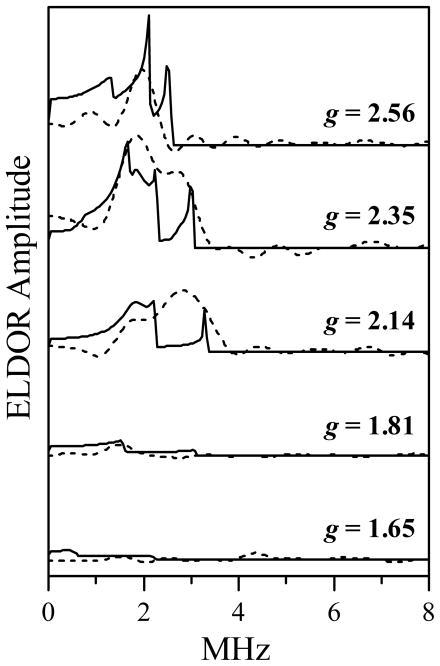
The simulations of pulsed ELDOR spectra reasonably reproducing the overall range, structure, and the amplitude dependence of the experimental spectra on the observation position were obtained for the following structural parameters: RMoFe = 32.3 Å (Do = 1.6 MHz), θR = 55°, ϕR = 0°, θMo = 55°, and ϕMo = 150°, where θMo and ϕMo are the polar and azimuthal angles of the Mo(V) g// axis in the Fe(III) g-frame. The error limits for the orientation angles are ±5°, and the error limits for RMoFe are ±0.15 Å. The results of the simulations are shown in Figure 10 by solid traces.
Figure 10.
Simulations of pulsed ELDOR spectra of wt hSO. The experimental spectra (dashed lines) are reproduced from Figure 7. The simulated spectra (solid lines) are calculated for a fixed orientation of RMoFe and a fixed orientation of the Mo(V) g-frame with respect to the Fe(III) heme g-frame. The simulation parameters: Do = 1.6 MHz (RMoFe = 32.3 Å); polar and azimuthal angles describing the orientation of RMoFe, (θR, ϕR) = (55°, 0°); polar and azimuthal angles describing the orientation of the Mo(V) g// axis, (θMo, ϕMo) = (80°, 150°). The angles are with respect to the heme g-frame.
The simulated spectra in Figure 10 are much sharper than the experimental ones because (a) the simulation did not account for the finite length of the experimental ELDOR trace and (b) all of the structural parameters were fixed (i.e., their distribution functions had zero width). Introducing a uniform broadening in the spectra (by accounting for the finite data acquisition interval) resulted in decrease of the relative amplitude of the sharp spectral features (in particular, the peak at ~3 MHz) and worsening of the agreement in relative amplitudes of the low-and high-frequency features of the spectra. The systematic variation of the structural parameters within the allowed limits (estimated from RIDME) did not result in better agreement between the broadened simulated and experimental spectra. A possible reason for this is a somewhat oversimplified structural model. While it is obvious from the observed orientational selectivity that the structural disorder is very limited, its complete neglect leads to noticeable differences in appearance of the experimental and simulated spectra. The changes of the structural variables (the angles and the distance) associated with this disorder are, most likely, interrelated. Given the large number of structural variables, we currently consider it unrealistic to investigate a large number of plausible correlations of structural parameters in order to arrive at a better agreement between the simulated and experimental ELDOR spectra. In addition, the possible improvement would largely be of cosmetic value and would not change the main qualitative conclusion about the fairly well-defined geometry of the relative spatial arrangement of the Mo and heme domains. Therefore, we did not undertake here the simulations with a correlated disorder of the structural parameters.
Given the limited accuracy of the pulsed ELDOR simulations, it appears that the formal accuracy of determination of RMoFe (32.3 ± 0.15 Å) is probably overestimated. A somewhat more realistic error limits may be obtained from the RIDME simulations of Figure 9, where only the shape of the prominent peak at 1.6 MHz is taken into consideration, while the pronounced D// shoulder is assumed to be wiped out by the structural distribution. This leads to an extended range of the dipole interaction constants of Do = 1.5 – 1.8 MHz and RMoFe ≈ 32 ± 1 Å. The structural information obtained is summarized in Figure S5 of the SI.
6. Relation of the solution structure to the kinetic and crystallographic data
It is tempting to compare the structural information obtained here from a frozen solution of hSO with the X-ray crystallographic data for cSO (pdb 1SOX8), the only X-ray structure presently available for an intact vertebrate SO. The amino acid sequences of the cSO and hSO show a high identity (68%).8 However, in comparing the hSO structure in frozen solution with the cSO crystal structure, it is also important to note that the two studies are initiated from different oxidation states. The crystals for the X-ray structure of cSO were obtained from the resting Mo(VI)Fe(III) state (1 in Figure 1).8 Exposure to the intense X-ray beam during data collection at cryogenic temperatures (95 K) resulted in photoreduction of the Mo(VI) center in the frozen crystals.40 However, this photoreduction will not change the Mo-Fe distance, which is fixed by the frozen crystal structure. The Mo-Fe distance measurements described in the present work were initiated by first preparing the Mo(V)Fe(III) state (4 in Figure 1) by reduction of state 1 with Ti(III) citrate and then freezing the solution for pulsed EPR measurements.
Comparison of the pulsed EPR and X-ray data shows that the distances between the Mo and Fe centers in both cases are similar, RMoFe ≈ 32 Å. The angles (θR, ϕR) ≈ (55°, 0°) obtained here, however, differ significantly from (θR, ϕR) ≈ (74°, 70°) that can be estimated from the X-ray structure, assigning gZ of the heme center to the heme plane normal41 and estimating the direction of the axis of gX from the average direction of the imidazole planes and using the principle of counter-rotation.42 One possible reason for this difference in the orientation of RMoFe is that the differences between the amino acid sequences of cSO and hSO might result in a somewhat different position of Mo with respect to the heme molecular frame and a somewhat different orientation of the His ligands of the heme center, which will result in a change of orientation of the axis of gX. Consistent with this suggestion, changes in the tether sequence of hSO can dramatically alter the IET rate between states 4 and 5 in Figure 1. For example, changing the conserved proline that is adjacent to the heme domain to alanine resulted in a three-fold decrease in the IET rate.43 This Pro to Ala mutation would be expected to increase the flexibility of the tether and hence the orientations accessible to the heme domain. Replacement of the tether sequence of hSO with that of cSO unexpectedly gave slower IET,44 even though wt cSO has faster IET than wt hSO.15
The fixed relative position of the heme and Mo centers in hSO observed in this work is an unexpected result. From the dynamic motion model developed to explain the fast IET kinetics between 4 and 5 (Figure 1), we anticipated that in a glassy sample of hSO the relative positions of these centers should either be disordered or the Mo and Fe centers should be closer together than in the X-ray crystal structure.10 Indeed, the molecular dynamics (MD) simulations of cSO have shown a dynamic distribution of conformations with RMoFe ranging from about 27 to 57 Å,16 while the catalytically active conformation calculated using the steered MD simulations is predicted to have RMoFe ≈ 19 Å.17 The seeming contradiction between these predictions and our experimental results (large fixed distance of 32 Å in frozen solution) may possibly be rationalized as follows: (1) the unique fixed conformation of SO observed by pulsed EPR may represent a preferential conformation of SO that is achieved when the temperature is lowered and the glycerol-containing solution is frozen; (2) the conformation of SO observed by pulsed EPR is the preferential conformation in liquid solution, and the IET kinetics reflect transient solution conformations of SO which “gate” electron transfer; (3) the structural/dynamic properties of the SO protein in the Mo(VI)Fe(II) state (5 in Figure 1), which is generated photochemically from Mo(VI)Fe(III) (1 in Figure 1), may be different from the Mo(V)Fe(III) state (4) generated by chemical reduction by Ti(III) and studied by pulsed EPR in frozen solution in this work.
Conclusion
In this work we have used the spectroscopic techniques of pulsed ELDOR and RIDME to conduct the first experimental investigation of the structure of Mo(V)Fe(III) state of wt hSO in frozen glassy solution. Based on the dynamic structural model rationalizing the rapid IET rates between the Mo and heme centers in vertebrate SO, the Mo – Fe distance in a frozen glassy sample was expected to be distributed over wide limits. Unexpectedly, however, a well-defined structural situation was observed, with the fixed distance RMoFe ≈ 32 Å being similar to that determined earlier for cSO by X-ray crystallography. The observed structural situation probably requires specific interactions between some of the amino acid residues on the surface of the Mo and heme domains. Such interactions can be disrupted by mutations of the amino acid residues on the surface of the domains45 and in the interdomain tether (e.g., the mutations that shorten the tether length).43,46 Investigations of the effects of such mutations on the interdomain distances in frozen solution are currently in progress.
Supplementary Material
Acknowledgments
We gratefully acknowledge support of this research by the NIH (GM-37773 to J.H.E.) and by grants from the NSF (DBI-0139459, DBI-9604939, BIR-9224431) and the NIH (S10RR020959 and 1S10RR026416-01) for development of the EPR facility. Dr. Johnson-Winters thanks the NIH for a Ruth L. Kirschstein National Service Award. We acknowledge Dr. A. Raitsimring for helpful discussions. We thank Prof. K. V. Rajagopalan for providing the pTG918 plasmid containing the gene for preparing recombinant hSO and the protocols for purifying the enzyme. We are grateful to Prof. F. Ann Walker for the use of equipment and for helpful discussions.
ABBREVIATIONS
- cSO
chicken sulfite oxidase
- ELDOR
electron-electron double resonance
- EPR
electron paramagnetic resonance
- ESEEM
electron spin echo envelope modulation
- ET
electron transfer
- FI
field-integrated
- FMNH•
flavin mononucleotide semiquinone radical
- FT
Fourier transform
- hSO
human sulfite oxidase
- IET
intramolecular electron transfer
- mw
microwave
- RIDME
relaxation- induced dipolar modulation enhancement
- SO
sulfite oxidase
- wt
wild type
Footnotes
Author Contributions
The manuscript was written through contributions of all authors.
ASSOCIATED CONTENT
Two-pulse ESEEM of the heme center, natural logarithms of the ELDOR traces, inversion recovery traces for the heme center at different temperatures, pumping pulse excitation profile, graphical summary of the structural information obtained.
References
- 1.Rajagopalan KV, Coughlan MP, editors. In Molybdenum and Molybdenum-Containing Enzymes. Pergamon; 1980. p. 242. [Google Scholar]
- 2.Hille R. Chem Rev. 1996;96:2757. doi: 10.1021/cr950061t. [DOI] [PubMed] [Google Scholar]
- 3.Rajagopalan KV, Johnson JL, Creighton TE, editors. Wiley Encyclopedia of Molecular Medicine. Wiley; New York: 2002. p. 3048. [Google Scholar]
- 4.Cowan JA, Upmacis RK, Beratan DN, Onuchic JN, Gray HB. Ann N Y Acad Sci. 1988;550:68. doi: 10.1111/j.1749-6632.1988.tb35324.x. [DOI] [PubMed] [Google Scholar]
- 5.Beratan DN, Onuchic JN, Winkler JR, Gray HB. Science. 1992;258:1740. doi: 10.1126/science.1334572. [DOI] [PubMed] [Google Scholar]
- 6.Gray HB, Winkler JR. Annu Rev Biochem. 1996;65:537. doi: 10.1146/annurev.bi.65.070196.002541. [DOI] [PubMed] [Google Scholar]
- 7.Marcus RA, Sutin N. Biochim Biophys Acta, Rev Bioenerg. 1985;811:265. [Google Scholar]
- 8.Kisker C, Schindelin H, Pacheco A, Wehbi W, Garrett RM, Rajagopalan KV, Enemark JH, Rees DC. Cell. 1997;91:973. doi: 10.1016/s0092-8674(00)80488-2. [DOI] [PubMed] [Google Scholar]
- 9.Sullivan EP, Hazzard JT, Tollin G, Enemark JH. Biochemistry. 1993;32:12465. doi: 10.1021/bi00097a026. [DOI] [PubMed] [Google Scholar]
- 10.Pacheco A, Hazzard JT, Tollin G, Enemark JH. J Biol Inorg Chem. 1999;4:390. doi: 10.1007/s007750050325. [DOI] [PubMed] [Google Scholar]
- 11.Page CC, Moser CC, Chen X, Dutton PL. Nature. 1999;402:47. doi: 10.1038/46972. [DOI] [PubMed] [Google Scholar]
- 12.Marcus RA, Suttin N. Biochim Biophys Acta. 1985;811:265. [Google Scholar]
- 13.Feng C, Tollin G, Enemark JH. Biochim Biophys Acta. 2007;1774:527. doi: 10.1016/j.bbapap.2007.03.006. [DOI] [PMC free article] [PubMed] [Google Scholar]
- 14.Spence JT, Kipke CA, Enemark JH, Sunde RH. Inorg Chem. 1991;30:3011. [Google Scholar]
- 15.Feng CJ, Kedia RV, Hazzard JT, Hurley JK, Tollin G, Enemark JH. Biochemistry. 2002;41:5816. doi: 10.1021/bi016059f. [DOI] [PubMed] [Google Scholar]
- 16.Pushie MJ, George GN. J Phys Chem B. 2010;114:3266. doi: 10.1021/jp908731f. [DOI] [PubMed] [Google Scholar]
- 17.Utesch T, Mroginski MA. J Phys Chem Lett. 2010;1:2159. [Google Scholar]
- 18.Milov AD, Salikoh KM, Shirov MD. Fiz Tverd Tela. 1981;23:975. [Google Scholar]
- 19.Kulik LV, Dzuba SA, Grigoryev IA, Tsvetkov YD. Chem Phys Lett. 2001;343:315. [Google Scholar]
- 20.Kurshev VV, Raitsimring AM, Tsvetkov Yu D. J Magn Reson. 1989;81:441. [Google Scholar]
- 21.Wacker T, Sierra GA, Schweiger A. Isr J Chem. 1992;32:305. [Google Scholar]
- 22.Tang J, Thurnauer MC, Norris JR. Chem Phys Lett. 1994;219:283. [Google Scholar]
- 23.Borbat PP, Freed JH. Chem Phys Lett. 1999;313:145. [Google Scholar]
- 24.Schiemann O, Prisner TF. Rev Biophys. 2007;40:1. doi: 10.1017/S003358350700460X. [DOI] [PubMed] [Google Scholar]
- 25.Astashkin AV, Kawamori A. In: Adv Photosynth Respir. Aartsma TJ, Matysik J, editors. Vol. 26. Springer; Dordrecht: 2008. p. 325. [Google Scholar]
- 26.Borbat PP, Freed JH. In: Biol Magn Reson. Berliner LJ, Eaton GR, editors. Vol. 19. Kluwer Academic/Plenum Publishers; New York: 2000. p. 383. [Google Scholar]
- 27.Jeschke G, Pannier M, Spiess HW. Biological Magnetic Resonance, v. 19: Distance Measurements in Biological Systems by EPR. Kluver; New York: 2000. Double Electron-electron Resonance; pp. 493–512. [Google Scholar]
- 28.Astashkin AV, Seravalli J, Mansoorabadi SO, Reed GH, Ragsdale SW. J Am Chem Soc. 2006;128:3888. doi: 10.1021/ja0585275. [DOI] [PMC free article] [PubMed] [Google Scholar]
- 29.Elsässer C, Brecht M, Bittl R. J Am Chem Soc. 2002;124:12606. doi: 10.1021/ja027348+. [DOI] [PubMed] [Google Scholar]
- 30.Swanson MA, Kathirvelu V, Majtan T, Frerman FE, Eaton GR, Eaton SS. J Am Chem Soc. 2009;131:15978. doi: 10.1021/ja9059816. [DOI] [PMC free article] [PubMed] [Google Scholar]
- 31.Sen KI, Wu H, Backer JM, Gerfen GJ. Biochemistry. 2010;49:2159. doi: 10.1021/bi902171d. [DOI] [PMC free article] [PubMed] [Google Scholar]
- 32.Gordon-Grossman M, Kaminker I, Gofman Y, Shai Y, Goldfarb D. Phys Chem Chem Phys. 2011;13:10771. doi: 10.1039/c1cp00011j. [DOI] [PubMed] [Google Scholar]
- 33.Lovett JE, Bowen AM, Timmel CR, Jones MW, Dilworth JR, Caprotti D, Bell SG, Wong LL, Harmer J. 2009;11:6840. doi: 10.1039/b907010a. [DOI] [PubMed] [Google Scholar]
- 34.Codd R, Astashkin AV, Pacheco A, Raitsimring AM, Enemark JH. J Biol Inorg Chem. 2002;7:338. doi: 10.1007/s00775-001-0303-5. [DOI] [PubMed] [Google Scholar]
- 35.Dublin AB, Hald JK, Wootton-Gorges SL. Am J Neuroradiol. 2002;23:484. [PMC free article] [PubMed] [Google Scholar]
- 36.Seefeldt LC, Ensign SA. Anal Biochem. 1994;221:379. doi: 10.1006/abio.1994.1429. [DOI] [PubMed] [Google Scholar]
- 37.Astashkin AV, Enemark JH, Raitsimring A. Concepts Magn Reson Part B. 2006;29B:125. [Google Scholar]
- 38.Lamy MT, Gutteridge S, Bray RC. Biochem J. 1980;185:397. doi: 10.1042/bj1850397. [DOI] [PMC free article] [PubMed] [Google Scholar]
- 39.Astashkin AV, Elmore BO, Fan WH, Guillemette JG, Feng CJ. J Am Chem Soc. 2010;132:12059. doi: 10.1021/ja104461p. [DOI] [PMC free article] [PubMed] [Google Scholar]
- 40.George GN, Pickering IJ, Kisker C. Inorg Chem. 1999;38:2539. [Google Scholar]
- 41.Quinn R, Valentine JS, Byrn MP, Strouse CE. J Am Chem Soc. 1987;190:3301. [Google Scholar]
- 42.Shokhirev NV, Walker FA. J Am Chem Soc. 1998;120:981. [Google Scholar]
- 43.Johnson-Winters K, Nordstrom AR, Emesh S, Astashkin AV, Rajapakshe A, Berry RE, Tollin G, Enemark JH. Biochemistry. 2010;49:1290. doi: 10.1021/bi9020296. [DOI] [PMC free article] [PubMed] [Google Scholar]
- 44.Johnson-Winters K, Nordstrom AR, Davis AC, Tollin G, Enemark JH. Metallomics. 2010;2:766. doi: 10.1039/c0mt00021c. [DOI] [PubMed] [Google Scholar]
- 45.Rajapakshe A, Meyers KT, Berry RE, Tollin G, Enemark JH. J Biol Inorg Chem. 2012 doi: 10.1007/s00775-011-0856-x. Published Online. [DOI] [PubMed] [Google Scholar]
- 46.Johnson-Winters K, Tollin G, Enemark JH. Biochemistry. 2010;49:7242. doi: 10.1021/bi1008485. [DOI] [PMC free article] [PubMed] [Google Scholar]
Associated Data
This section collects any data citations, data availability statements, or supplementary materials included in this article.


