

Abstract
Objective
To examine the disparity in delaying seeing a doctor due to cost between older adults with and without disabilities, and whether the disparity could be explained by health and financial variables.
Data Sources
Nationally representative sample of community-dwelling adults aged ≥65 who have health insurance and a usual source of care from the 2006 Behavioral Risk Factor Surveillance System (n = 85,015).
Study Design
This cross-sectional study used sequential logistic regression models to examine the associations of delaying seeing a doctor due to cost with disability status, including demographic, health, and financial variables.
Principal Findings
Older adults with disabilities had significantly higher odds of delaying seeing a doctor due to cost compared to older adults without disabilities after controlling for demographic, health, and financial factors. Although health and financial variables collectively attenuated the disparity, they did not fully explain the disparity.
Conclusions
Despite having health insurance and a usual source of care, older adults with disabilities encountered greater economic difficulties in seeing a doctor than their counterparts without disabilities. Policy makers should continue addressing the economic burden to improve timely visits to health care providers.
Keywords: Elderly, disability, disparities, delaying doctor visits, BRFSS
The number of adults aged 65 and older in the United States is projected to be 72 million in 2030, representing approximately 20 percent of the total population (Administration on Aging, 2008). Accompanying this demographic shift and increased longevity is the high prevalence of chronic diseases and debilitating conditions (National Center for Health Statistics, 2006). Consequently, policy makers need to ensure adequate access to health services and long-term care for the growing older population.
Providing coverage for over 97 percent of older Americans aged 65 and older (Clark et al. 2004), Medicare plays an important role in addressing disparities in accessing health care among older adults (U.S. Department of Health and Human Services [DHHS] 2009). However, one aspect of Medicare coverage that has not yet been adequately examined is whether older adults with disabilities experience disparities in health care access compared to their counterparts without disabilities. Various forms and severities of disability are associated with high health care expenditures for individuals with disabilities and Medicare (Rice and LaPlante 1992; Foote and Hogan 2001; Chan et al. 2002; Iezzoni and O'Day 2006; Yelin, Cisternas, and Trupin 2006), and these expenditures grow with age (Rice and LaPlante 1992; Iezzoni and O'Day 2006; Yelin, Cisternas, and Trupin 2006). High health care costs, coupled with Medicare's cost-sharing requirements, may hinder timely doctor visits for older persons with disabilities.
Cost-related barriers to health care access can be further compounded by the unique challenges people with disabilities encounter in navigating the health care system. Although these individuals use health care services more frequently than those without disabilities (Hanson, Neuman, and Voris 2003; Hanson et al. 2003; Reis et al. 2004), they often experience difficulty obtaining sufficient health insurance coverage (Millman 1993; DeJong et al. 2002; Moon 2005). Access to health care is a serious problem for many individuals in the United States, but it may be more pronounced for persons with disabilities because of structural barriers, such as inaccessible doctors’ offices and medical diagnostic equipment, as well as interpersonal barriers, such as health care providers’ lack of training and competence in caring for those with disabilities (DHHS 2002; Reis et al. 2004; Iezzoni and O'Day 2006).
Despite the importance of timely health care access in maintaining health and managing chronic diseases for older adults with disabilities, there is a paucity of empirical research investigating disparities in health care access in this population. Several studies have focused on specific disabilities, such as those that are developmental (Havercamp, Scandlin, and Roth 2004; Parish and Saville 2006), or on specific service utilization, such as prevention or treatment services (Chan et al. 1999; Iezzoni et al. 2000, 2008; McCarthy et al. 2006). Although some of these studies focused on older adults, they did not examine those with a broad spectrum of disabilities and focus on financial challenges in accessing health care.
Given the almost universal coverage of Medicare and the greater health needs among older adults with disabilities, this study examines disparities in health care access between older adults with and without disabilities who have health insurance and a usual source of care. Because health insurance and a usual source of care have independent and protective associations with accessing health care (DeVoe et al. 2003; Phillips et al. 2004; DeVoe, Tilotson, and Wallace 2009), we assume that if older adults with disabilities in our study population, who have these protections, face difficulties in accessing health care, those with disabilities that do not have the two advantages will experience even greater difficulties. This study examines (1) whether there is a disparity in delaying seeing a doctor due to cost between older adults with and without disabilities after controlling for demographic, health, and financial variables; and (2) whether the disparity could be explained by health and financial variables.
Methods
Conceptual Framework
Several studies examined a delay in needed medical care or prescription due to cost using national surveys (Klein, Turvey, and Wallace 2004; Shi and Stevens 2005; Weaver et al. 2010). These studies found that delayed care was significantly associated with demographic characteristics, health status, and financial variables. Given the prior findings, this study examines a disparity in delayed medical care due to cost between older adults with and without disabilities controlling for demographic, health, and financial factors. Demographic variables are not amenable to policy interventions; therefore, this study focuses on health and financial variables. Health variables are examined after controlling for demographic variables assuming a higher prevalence of health needs and secondary health conditions for those with disabilities compared to their counterparts without disabilities (Campbell, Sheets, and Strong 1999; Kinne, Patrick, and Doyle 2004; Rasch et al. 2008). Financial variables are examined after controlling for demographic and health variables because these are more amenable to policy interventions (Dunlop et al. 2002; Shi and Stevens 2005).
Data Source and Study Population
This study used data from the 2006 Behavioral Risk Factor Surveillance System (BRFSS), an ongoing, annual, cross-sectional survey of a nationally representative sample of community-dwelling civilians aged 18 and older in the United States and territories (Centers for Disease Control and Prevention [CDC] 2006a). The survey recruited one adult per household as the key informant and did not employ a proxy respondent in computer-assisted telephone interviews. Data collected in the survey included access to health care, preventive health services use, health status and conditions, and health risk behaviors (CDC 2006a,b).
Figure 1 illustrates the selection process and number of the study sample after multiple imputation (MI). The study sample consisted of 85,015 older adults aged 65 and older, with or without disability, who reported having health insurance and a usual source of care. MI was performed for all variables to account for item nonresponse (see Data Imputation section).
Figure 1.
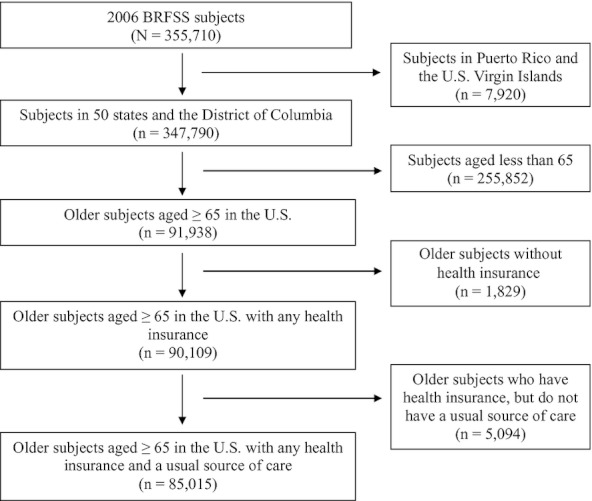
Selection Process and Number of Study Sample after Multiple Imputation
Disability status, health insurance, and a usual source of care were all part of the inclusion criteria in this study. For disability, BRFSS contained the following two questions: (1) “Are you limited in any way in any activities because of physical, mental, or emotional problems?” and (2) “Do you now have any health problem that requires you to use special equipment, such as a cane, a wheelchair, a special bed, or a special telephone?” (CDC 2006b, p. 10). This study categorized individuals who responded “yes” to either question as having disabilities and individuals who responded “no” to both questions as not having any disabilities. The BRFSS disability measures which focus on activity limitation and special equipment use are broader than disability measures of other national surveys, such as National Health Interview Survey or Survey of Income and Program Participation (Erickson and Dumoulin-Smith 2009). Yet activity limitation is independently associated with increased health care costs among elderly Medicare beneficiaries aged ≥65 (Chan et al. 2002). In addition, BRFSS was one of several data sources used in Healthy People 2010 to track its objectives in disability and secondary conditions (DHHS 2000). BRFSS contained a single item asking respondents whether they had any health insurance: “Do you have any kind of health care coverage, including health insurance, prepaid plans such as HMOs, or government plans such as Medicare?” (CDC 2006b, p. 6). BRFSS asked respondents about their usual source of care with the following question: “Do you have one person you think of as your personal doctor or health care provider?” (CDC 2006b, p. 6).
Outcome Variable
To determine whether a person experienced delay in seeing a doctor due to cost, a binary variable (yes or no) was constructed based on the following question: “Was there a time in the past 12 months when you needed to see a doctor but could not because of cost?” (CDC 2006b, p. 6).
Independent Variables
Demographic Variables
Demographic variables included sex, age, race, marital status, education level, region, and urban/rural residence. Age was grouped into (1) 65–74 years, (2) 75–84 years, or (3) ≥85 years. Race was grouped into four categories: (1) Non-Hispanic white; (2) Non-Hispanic African American; (3) Hispanic; and (4) other races or multiracial. Marital status was collapsed into three categories: (1) married; (2) divorced, widowed, or separated; and (3) never married. Education level was grouped into four categories of highest education attainment: (1) less than high school; (2) high school degree or general equivalency diploma; (3) some college or technical school; and (4) college degree or more. Region was grouped into (1) Northeast, (2) Midwest, (3) South, or (4) West according to State Federal Information Processing Standards Code used in the BRFSS dataset. Urban/rural residence was determined using Metropolitan Status Code in the BRFSS dataset, and was then dichotomized as urban or rural. Although urban/rural residence is not a direct measure to examine neighborhood-level resources, it is documented that living in rural areas poses a challenge to people with disabilities due to fewer and poor resources (Lishner et al. 1996; Iezzoni, Killeen, and O'Day 2006).
Health Variables
Health variables included self-reported general health status, physical health, mental health, and five chronic diseases. Respondents’ self-reported general health status was based on the following question: “Would you say that in general your health is—” (CDC 2006b, p. 5). The answers were dichotomized as (1) excellent, very good, or good; or (2) fair or poor. Respondents’ physical health was measured with the following question: “Now thinking about your physical health, which includes physical illness and injury, for how many days during the past 30 days was your physical health not good?” (CDC 2006b, p. 6). Mental health was measured with the following question: “Now thinking about your mental health, which includes stress, depression, and problems with emotions, for how many days during the past 30 days was your mental health not good?” (CDC 2006b, p. 6). Prior studies have shown that these questions on healthy days have moderate to high validity and reliability (Andresen et al. 2003; CDC 2000). For physical and mental health, the number of days the respondents said their health was not good was grouped into two categories: (a) <14 days and (b) 14–30 days. This cutoff is often used as a clinical indicator of depression and anxiety disorders (American Psychiatric Association, 2000; CDC 2004). We used the same cutoff value for physical health for consistency. This categorization for physical and mental health is consistent with other studies, using BRFSS (Brown et al. 2003; Strine et al. 2004, 2005; Jiang and Hesser 2006). BRFSS included information on the presence or absence of five chronic diseases (diabetes, asthma, heart attack, coronary heart disease, and stroke) that were predetermined and non-sex-specific. The survey asked respondents whether they had been told by a health care provider that they had any of the diseases.
Financial Variables
Financial variables included annual household income, last dental visit, lost phone service, and number of children in a household. Income was collapsed into five categories: (1) less than $15,000; (2) $15,000 to less than $25,000; (3) $25,000 to less than $35,000; (4) $35,000 to less than $50,000; and (5) $50,000 or more. Last dental visit was defined as last dental visit to a dentist or a dental clinic for any reason, including visits to dental specialists. This variable was dichotomized as (1) within the past year, or (2) >1 year ago or never. Last dental visit can serve as a proxy measure for private health insurance or economic resources. Lost phone service was defined as phone service lost for 1 week or more during the last 12 months not because of weather or national disasters, and it was dichotomized as Yes or No. The number of children in a household was dichotomized as (1) 0 or (2) ≥1. The number of children in a household can be a measure of financial burden in a household.
Statistical Analysis
Weighted descriptive statistics for older adults with disabilities were compared to those for older adults without disabilities using chi-square tests. Four logistic regression models were sequentially performed with “delay in seeing a doctor due to cost” as the outcome: Model 1 included only disability status; Model 2 included disability status and demographic variables; Model 3 included disability status, demographic variables, and health variables; and Model 4 included financial variables, as well as all previously entered variables. All statistical analyses were conducted using SAS-callable SUDAAN 10.0.1 (Research Triangle Institute, Triangle Park, NC, USA) to account for the complex survey design of BRFSS, and a Taylor series linearization method was employed for variance estimation. A significance level of .05 and 95% confidence intervals (CI) were used.
Data Imputation
Complete-case analyses, using only observed data, assume that missing data are not associated with either missing data or observed data (Little and Rubin 2002; Raghunathan 2004). Thus, these analyses assume that missing data are completely missing at random and that the observed cases are a random sample of the study population (Little and Rubin 2002; Raghunathan 2004). In this study, we did not assume that missing data were completely missing at random because this assumption is seldom true in complex surveys. Therefore, the answers—“Don't Know/Not Sure” and “Refused”—were treated as missing data to avoid biased results in statistical analysis (Rubin 1987; Little and Rubin 2002). We employed MI to impute missing data for all variables used in this study. According to MI theory, all available variables related to missing data should be included for imputations (Little and Raghunathan 1997). Dependent and independent variables as well as 22 auxiliary variables were used in the imputation. All variables of interest in this study had missing data except for sex, age, region, and urban/rural residence. All these variables had less than four weighted percent missing data except for annual household income (22.1 weighted percent). These missing data would significantly reduce the number of observations for analysis due to sequential logistic regression models with multiple variables in the complete-case analyses (n = 58,354 in the last sequential logistic regression model). MI was performed using IVEware software package (Institute of Social Research, University of Michigan). Five multiply imputed datasets were obtained through 10 iterations for each dataset. The results of a separate analysis of each imputed dataset were combined for five datasets, using Rubin's rules (Rubin 1987). A sensitivity analysis yielded comparable findings between complete-case analyses and MI analyses.
Results
Sample Characteristics
Table 1 shows characteristics of the study sample by disability status. Approximately 6 percent of older people with disabilities experienced a delay in seeing a doctor due to cost. This percentage may seem small, but this indicates that approximately 800,000 older adults with disabilities encountered this access issue because of financial reason. Compared to subjects without disabilities, a significantly higher proportion of subjects with disabilities were female, older, less educated, and lived in rural areas. More subjects with disabilities reported their general health status as “fair or poor,” having more unhealthy days for both physical and mental health, and having any of the five chronic diseases. A greater percentage of subjects with disabilities reported having lower annual household incomes, having no dental visit or last dental visit one more years ago, and having telephone service lost over 1 week within the last year.
Table 1.
Characteristics of Older Adults Aged ≥65 with Health Insurance and a Usual Source of Care by Disability Status
| Variables | Disability N = 33,385 (38.3%) % (95% CI) | No Disability N = 53,225 (61.7%) % (95% CI) | p-Value | |||
|---|---|---|---|---|---|---|
| Dependent variable | ||||||
| Delay medical care due to cost | 5.84 (5.27, 6.48) | 2.57 (2.32, 2.84) | <.001 | |||
| Independent variables | ||||||
| Demographic variables | ||||||
| Sex | ||||||
| Male | 38.49 (37.41, 39.58) | 42.71 (41.85, 43.58) | <.001 | |||
| Female | 61.51 (60.42, 62.59) | 57.29 (56.42, 58.15) | ||||
| Age (years) | ||||||
| 65–74 | 45.13 (44.04, 46.23) | 55.26 (54.40, 56.13) | <.001 | |||
| 75–84 | 42.71 (41.62, 43.81) | 38.09 (37.24, 38.96) | ||||
| 85 or more | 12.16 (11.44, 12.92) | 6.64 (6.26, 7.04) | ||||
| Race | ||||||
| Non-Hispanic white | 83.04 (81.93, 84.10) | 81.89 (80.95, 82.79) | .079 | |||
| Non-Hispanic African American | 7.79 (7.10, 8.55) | 7.34 (6.86, 7.85) | ||||
| Hispanic | 5.00 (4.23, 5.90) | 6.31 (5.60, 7.11) | ||||
| Other race or multiracial | 4.17 (3.70, 4.68) | 4.46 (3.99, 4.99) | ||||
| Marital status | ||||||
| Married | 51.32 (50.22, 52.41) | 62.10 (61.28, 62.92) | <.001 | |||
| Divorced/widowed/separated | 45.55 (44.47, 46.64) | 34.68 (33.89, 35.48) | ||||
| Never married | 3.13 (2.80, 3.51) | 3.22 (2.91, 3.55) | ||||
| Education level | ||||||
| College or more | 24.19 (23.27, 25.14) | 28.16 (27.35, 28.99) | <.001 | |||
| Some college or technical school | 23.25 (22.35, 24.17) | 22.37 (21.65, 23.09) | ||||
| High school or GED | 33.77 (32.77, 34.79) | 35.63 (34.82, 36.46) | ||||
| Less than high school | 18.79 (17.83, 19.78) | 13.84 (13.15, 14.56) | ||||
| Region | ||||||
| Northeast | 18.12 (17.40, 18.87) | 21.96 (21.35, 22.59) | <.001 | |||
| Midwest | 24.04 (23.18, 24.92) | 22.37 (21.75, 23.00) | ||||
| South | 36.43 (35.46, 37.42) | 35.68 (34.95, 36.42) | ||||
| West | 21.40 (20.35, 22.50) | 19.98 (19.14, 20.85) | ||||
| Urban/rural residence | ||||||
| Urban | 77.64 (76.91, 78.35) | 79.05 (78.49, 79.59) | .003 | |||
| Rural | 22.36 (21.65, 23.09) | 20.95 (20.41, 21.51) | ||||
| Health variables | ||||||
| General health status | ||||||
| Excellent, very good, or good | 50.63 (49.53, 51.74) | 83.72 (82.98, 84.44) | <.001 | |||
| Fair or poor | 49.37 (48.26, 50.47) | 16.28 (15.56, 17.02) | ||||
| Physical health | ||||||
| <14 days | 63.29 (62.21, 64.35) | 92.46 (91.99, 92.91) | <.001 | |||
| 14–30 days | 36.71 (35.65, 37.79) | 7.54 (7.09, 8.01) | ||||
| Mental health <14 days | 88.51 (87.69, 89.29) | 96.43 (96.06, 96.76) | <.001 | |||
| 14–30 days | 11.49 (10.71, 12.31) | 3.57 (3.24, 3.94) | ||||
| Diabetes | 24.23 (23.27, 25.21) | 15.67 (15.03, 16.33) | <.001 | |||
| Asthma | 16.08 (15.25, 16.95) | 7.94 (7.50, 8.41) | <.001 | |||
| Heart attack | 19.79 (18.93, 20.68) | 10.56 (10.03, 11.11) | <.001 | |||
| Coronary heart disease | 21.49 (20.60, 22.42) | 10.90 (10.37, 11.44) | <.001 | |||
| Stroke | 13.58 (12.87, 14.32) | 5.37 (5.03, 5.72) | <.001 | |||
| Financial variables | ||||||
| Annual household income | ||||||
| $50,000 or more | 20.51 (19.57, 21.47) | 28.34 (27.26, 29.46) | <.001 | |||
| $35,000 to less than $50,000 | 14.16 (13.37, 14.98) | 17.99 (17.29, 18.70) | ||||
| $25,000 to less than $35,000 | 16.62 (15.70, 17.59) | 17.30 (16.54, 18.10) | ||||
| $15,000 to less than $25,000 | 27.96 (26.93, 29.02) | 23.78 (22.98, 24.60) | ||||
| <$15,000 | 20.75 (19.72, 21.82) | 12.58 (11.92, 13.27) | ||||
| Last dental visit | ||||||
| Within 1 year | 61.31 (60.13, 62.47) | 69.77 (68.93, 70.61) | <.001 | |||
| >1 year ago or never | 38.69 (37.53, 39.87) | 30.23 (29.39, 31.07) | ||||
| Lost telephone service | ||||||
| No | 97.72 (97.33, 98.06) | 98.35 (98.08, 98.58) | .005 | |||
| Yes | 2.28 (1.94, 2.67) | 1.65 (1.42, 1.92) | ||||
| Number of children in a household | ||||||
| 0 | 95.61 (94.96, 96.18) | 96.13 (95.66, 96.55) | .175 | |||
| 1 or more | 4.39 (3.82, 5.04) | 3.87 (3.45, 4.34) | ||||
Note. GED, general equivalency diploma.
Delay Seeing a Doctor Due to Cost
Model 1 in Table 2 shows that older adults with disabilities were more likely than those without disabilities to delay seeing a doctor due to cost without adjusting for any factors (unadjusted odds ratio [OR] = 2.35, 95% CI = 2.02, 2.74). In Model 2, such disparity remained after controlling for demographic variables (adjusted odds ratio [AOR] = 2.28, 95% CI = 1.96, 2.65). All demographic variables except for sex were independently associated with the delay in seeing a doctor. Compared to the reference group, minority status, marital status (divorced, widowed, or separated), less education (<college), living in Midwest region and rural areas increased the odds of delaying doctor visits. Compared to older adults aged 65–74, those aged 75–84 were less likely to experience the risk of the delay, controlling for other demographic variables; those aged 85 and older were not associated with the risk. Model 3 shows that health factors were associated with the lower odds of the delay in doctor visits due to cost after adjusting for demographic variables (AOR = 1.62, 95% CI = 1.37, 1.92). All demographic variables that were significant in Model 2 remained significant in Model 3. General health status, mental health, and stroke significantly predicted the risk of delaying seeing a doctor. Of the five chronic diseases, only stroke was significantly associated with the risk (AOR = 1.36, 95% CI = 1.11, 1.67).
Table 2.
Adjusted Odds Ratios of Delaying Seeing a Doctor Due to Cost for Older Adults Aged ≥65 with Health Insurance and a Usual Source of Care
| Independent Variables | Model 1 † Disability OR (95% CI) | Model 2 ‡+Demographic AOR (95% CI) | Model 3 §+Health AOR (95% CI) | Model 4 ¶+Financial AOR (95% CI) |
|---|---|---|---|---|
| Disability status | ||||
| No disability | 1.00 | 1.00 | 1.00 | 1.00 |
| Disability | 2.35** (2.02, 2.74) | 2.28** (1.96, 2.65) | 1.62** (1.37, 1.92) | 1.56** (1.32, 1.85) |
| Demographic variables | ||||
| Sex [male] | ||||
| Female | 1.08 (0.93, 1.25) | 1.10 (0.94, 1.27) | 1.07 (0.92, 1.25) | |
| Age [65–74] | ||||
| 75–84 | 0.76** (0.65, 0.89) | 0.76** (0.65, 0.89) | 0.76** (0.65, 0.89) | |
| 85 and more | 0.72 (0.46, 1.10) | 0.73 (0.49, 1.09) | 0.75 (0.49, 1.13) | |
| Race [Non-Hispanic white] | ||||
| Non-Hispanic African American | 1.77** (1.43, 2.21) | 1.78** (1.43, 2.23) | 1.58** (1.26, 1.98) | |
| Hispanic | 2.50** (1.74, 3.59) | 2.34** (1.63, 3.36) | 2.09** (1.41, 3.10) | |
| Other race or multiracial | 1.79** (1.29, 2.49) | 1.70** (1.22, 2.37) | 1.52* (1.09, 2.12) | |
| Marital status [married] | ||||
| Divorced/widowed/separated | 1.29** (1.11, 1.51) | 1.23** (1.06, 1.44) | 0.95 (0.79, 1.13) | |
| Never married | 1.08 (0.77, 1.51) | 1.02 (0.71, 1.46) | 0.75 (0.49, 1.14) | |
| Education level [college or more] | ||||
| Some college or technical school | 1.63** (1.27, 2.10) | 1.54** (1.19, 1.98) | 1.21 (0.94, 1.55) | |
| High school or GED | 1.71** (1.35, 2.17) | 1.54** (1.21, 1.95) | 1.05 (0.82, 1.34) | |
| Less than high school | 3.07** (2.42, 3.89) | 2.41** (1.88, 3.10) | 1.38* (1.04, 1.83) | |
| Region [Northeast] | ||||
| Midwest | 0.74** (0.60, 0.91) | 0.73** (0.59, 0.90) | 0.73** (0.59, 0.90) | |
| South | 1.10 (0.91, 1.33) | 1.06 (0.88, 1.29) | 1.04 (0.85, 1.26) | |
| West | 0.81 (0.61, 1.08) | 0.78 (0.58, 1.03) | 0.78 (0.58, 1.05) | |
| Urban/rural residence [urban] | ||||
| Rural | 1.25** (1.09, 1.44) | 1.25** (1.09, 1.44) | 1.18* (1.03, 1.36) | |
| Health variables | ||||
| General health status [excellent, very good, or good] | ||||
| Fair or poor | 1.41** (1.17, 1.70) | 1.30** (1.08, 1.57) | ||
| Physical health [<14 days] | ||||
| 14–30 days | 1.21 (0.99, 1.47) | 1.20 (0.98, 1.46) | ||
| Mental health [<14 days] | ||||
| 14–30 days | 2.24** (1.76, 2.85) | 2.12** (1.63, 2.75) | ||
| Diabetes | 0.96 (0.80, 1.15) | 0.90 (0.75, 1.09) | ||
| Asthma | 1.14 (0.93, 1.40) | 1.13 (0.91, 1.38) | ||
| Heart attack | 1.17 (0.96, 1.44) | 1.12 (0.91, 1.38) | ||
| Coronary heart disease | 1.11 (0.91, 1.36) | 1.10 (0.90, 1.36) | ||
| Stroke | 1.36** (1.11, 1.67) | 1.30* (1.06, 1.60) | ||
| Financial variables | ||||
| Annual household income [$50,000 or more] | ||||
| $35,000 to less than $50,000 | 1.17 (0.74, 1.85) | |||
| $25,000 to less than $35,000 | 1.46* (1.06, 2.00) | |||
| $15,000 to less than $25,000 | 2.31** (1.71, 3.13) | |||
| Less than $15,000 | 2.79** (1.98, 3.93) | |||
| Last dental visit [within 1 year] | ||||
| >1 year ago or never | 1.42** (1.19, 1.69) | |||
| Lost telephone service [no] | ||||
| Yes | 2.22** (1.55, 3.20) | |||
| Number of children in a household [none] | ||||
| 1 or more | 1.03 (0.69, 1.53) | |||
Notes:
Disability status.
Adjusted for demographic variables (sex + age + race + marital status + education level + region + urban/rural residence).
Adjusted for demographic and health variables (general health status + physical health + mental health + diabetes + asthma + heart attack + coronary heart disease + stroke).
Adjusted for demographic, health, and financial variables (annual household income + last dental visit + lost phone service + number of children in a household).
p < .05;
p < .01.
AOR, adjusted odds ratio; GED, general equivalency diploma; OR, unadjusted odds ratio; [ ], reference category. The reference category for chronic diseases was “no” disease.
The addition of financial variables in Model 4 further attenuated the odds of delaying doctor visits (AOR = 1.56, 95% CI = 1.32, 1.85). In Model 4 controlling for demographic, health, and financial variables, most demographic and health variables that were significant in Model 3 remained significant. Marital status and education level except less than high school became nonsignificant. All financial variables except for the number of children in a household are associated with the delay in seeing a doctor due to cost (low annual household income less than $35,000, having no dental visit or the last dental visit one more years ago, and having telephone service lost over 1 week). Number of children in a household was not associated with the delay with physician visits (AOR = 1.03, 95% CI = 0.69, 1.53). The findings suggest that the disparity in delaying physician visits between older adults with and without disabilities persists after controlling for demographic, health, and financial variables. Although health and financial variables reduced the odds of delaying physician visits, those variables had little impact on the disparity in the delay between those with and without disabilities.
Discussion
This study found that among older adults who reported having health insurance and a usual source of care, those with disabilities were more likely to delay seeing a doctor due to cost as compared to older adults without disabilities, after controlling for demographic, health, and financial variables. This finding suggests that having health insurance and a usual source of care may not be adequate indicators of the ability to see a doctor in a timely manner among older adults with disabilities. Even though having health insurance and a usual source of care may have independent and protective effects on health care access (DeVoe et al. 2003; Phillips et al. 2004; DeVoe, Tilotson, and Wallace 2009), our findings indicate that, despite having both, older adults with disabilities are still likely to face financial hardship in seeing their doctors. Although Medicare Part B covers physician visits, Medicare's basic coverage may not be adequate for the great health care needs of older adults with disabilities. A 20 percent coinsurance payment is required for most medical and physician services under Medicare Part B (Kaiser Family Foundation, 2010a). Coupled with no annual cap on out-of-pocket spending in Medicare, this cost-sharing requirement may deter timely physician visits.
This study did not account for a lack of supplemental health insurance, which might contribute to older adults with disabilities delaying physician visits due to cost. Compared to those with supplemental insurance, individuals who have only Medicare may be more likely to delay care due to cost (Gluck and Hanson 2001). As of 2006, 11 percent of Medicare beneficiaries did not have any source of supplemental health coverage (Cubanski et al. 2008). These beneficiaries may face economic difficulty with services not covered by Medicare, as well as challenge due to Medicare's cost-sharing requirements. In addition, because unemployment is prevalent among working-age individuals with disabilities (Stapleton and Burkhauser 2003; Erickson, Lee, and von Schrader 2010), older adults who have become disabled at younger ages may be less likely to have employer-sponsored retiree insurance. They also may have great financial burdens hindering them from purchasing private supplemental coverage, such as Medigap.
In contrast, when people with disabilities are eligible for both Medicare and Medicaid, their Medicare health benefits generally are supplemented by state Medicaid wrap-around policies (Clark et al. 2004; Moon 2006; Kaiser Family Foundation 2010a). Cubanski et al. (2008) show that 56 percent of Medicare beneficiaries with the lowest income, “$10,000 or less,” are provided supplemental health coverage through Medicaid. However, the comprehensive benefits for dual eligibles may be offset by much greater health care needs among older adults with disabilities in great poverty. Community-dwelling Medicare beneficiaries with lower incomes are more likely than those with higher income to be in poor or fair health (Cubanski et al. 2008). Dual eligibles aged ≥65 have greater disability and chronic diseases, including diabetes, heart disease, lung disease, mental illness, and Alzheimer's disease (Coughlin, Waidmann, and O'Malley Watts 2009).
Collectively, health variables played a greater role than financial variables in attenuating the disparity in delaying doctor visits due to economic burden, although these health and financial variables did not eliminate the disparity. The greater health care needs of older adults with disabilities, as well as insufficient coverage by Medicare and a lack of supplemental insurance, may have elevated the risk of forgoing doctor visits among those with disabilities. The fact that this study targeted only older adults who had both health insurance (Medicare) and a usual source of care may have led to the small impact of financial variables on the disparity. Future research needs to consider other factors, including more direct indicators of financial factors and coordination of health care. Given the high prevalence of chronic health conditions among those with disabilities and the significant complexity of coordinated care (Bodenheimer 2008; Wiener 2010; Gulley, Rasch, and Chan 2011), the coordination of health care should be considered in the financial difficulty older adults with disabilities encounter.
Our study suggests that policy makers need to judiciously address the economic burden that older adults with disabilities face in maintaining timely doctor visits. Given that health care expenditures increase with disability and age (Rice and LaPlante 1992; Chan et al. 2002; Iezzoni and O'Day 2006; Yelin, Cisternas, and Trupin 2006), older adults with disabilities may experience great financial burdens in health care access. Policy makers should address the health care needs of this population to improve timely visits to health care providers, especially within the context of the recent health care reform act (Kaiser Family Foundation, 2010b). Before the passage of the Affordable Care Act, people with disabilities were more likely to be precluded or denied coverage by private insurers. They could face challenges in paying prohibitively high premiums and copayments due to their health conditions if they were enrolled in private health insurance (Williams et al. 2004; Moon 2005). The new health care reform law prohibits health insurance companies from discriminating based on preexisting health conditions (Kaiser Family Foundation, 2010b). However, the Act does not guarantee the elimination of disparities among vulnerable groups with disabilities. The findings of our study might indicate that merely providing the universal coverage of health care is not sufficient to address disparities among older adults with disabilities and that the financial impact of the health care reform on the disparity among older adults with disabilities should be closely monitored.
Although our study provides important information regarding the burden that older adults with disabilities face in timely access to health care, our findings need to be viewed in light of several limitations. First, given that BRFSS is a telephone survey, older adults with disabilities could encounter obstacles to participation in the survey. However, Kinne and Topolski (2005) demonstrated that adults with disabilities in Washington State were not underrepresented in BRFSS as compared to the Census Supplemental Survey. It is well documented that BRFSS is valid and reliable data source, compared to other national household surveys (CDC 2000; Erickson and Dumoulin-Smith 2009; Mokdad 2009; Nelson et al. 2001, 2003). Yet we recognize that a different population of people with disabilities may be represented, or people with disabilities may be underrepresented in BRFSS (Erickson and Dumoulin-Smith 2009). Older adults aged 65 and older with disabilities account for 38.3 percent for 2006 in BRFSS, whereas the same population with disabilities represents 41.0 percent for the same year in American Community Survey (Brault 2008). However, the potential underrepresentation of persons with disabilities should serve as a conservative estimation of the disparity reported in this study.
Second, this study included a limited number of covariates in the models, including five chronic diseases. It is possible, however, that other unobserved chronic and acute diseases may be associated with disability status and influence economic difficulty with doctor visits, for which we could not account. In addition, structural indicators, such as transportation, were not accounted for in this study. Some older adults with disabilities, who have low socioeconomic status, especially in rural areas, may have difficulty using public transportation to access health care (Iezzoni, Killeen, and O'Day 2006). Furthermore, although this study used such factors as last dental visit, lost telephone service, or number of children in a household as indicators of economic resources, other financial measures affecting the delay in medical care due to cost may not have been captured in this study. Given that older adults in the United States are almost universally covered by Medicare, this study targeted those who have health insurance and a usual source of care. Coupled with this study design, types and sources of health insurance, household wealth, savings, and out-of-pocket expenditure are not available in BRFSS.
Finally, because BRFSS uses a cross-sectional design, interpretation of causation should not be inferred in our findings. For example, although chronic diseases may lead to the delay in seeing a doctor as hypothesized in this study, delaying doctor visits in turn can result in the development of chronic diseases. Future studies are needed to examine the causal mechanisms underlying these findings.
Conclusion
Older adults with disabilities who had health insurance and a usual source of care were more likely than those without disabilities to delay seeing a doctor due to cost. This economic difficulty in accessing health care among older adults with disabilities needs to be addressed to improve timely visits to health care providers. Collectively, health variables played a greater role than financial variables in attenuating the disparity in delaying doctor visits, but health and financial variables did not fully explain the disparity. Further research considering other factors (e.g., more direct indicators of financial factors and coordination of health care) is warranted.
Acknowledgments
Joint Acknowledgment/Disclosure Statement: All authors do not have any interests that may be interpreted as affecting this study. During this study, Dr. Lee was supported in part by an Advanced Rehabilitation Research Training Fellowship under a grant from the National Institute on Disability and Rehabilitation (grant no. H133P080006; PI: Allen Heinemann, Ph.D.). However, the content presented in the study does not represent the policy of the NIDRR, and no endorsement by the Federal Government should be assumed. During this study, Dr. Denys Lau was supported in part by Award Number K01AG027295 (PI: D. T. Lau) from the National Institute on Aging.
Disclosures: None.
Disclaimers: None.
SUPPORTING INFORMATION
Additional supporting information may be found in the online version of this article:
Appendix SA1: Author Matrix.
Please note: Wiley-Blackwell is not responsible for the content or functionality of any supporting materials supplied by the authors. Any queries (other than missing material) should be directed to the corresponding author for the article.
References
- Administration on Aging. A Profile of Older Americans: 2008. Washington, DC: U.S. Department of Health and Human Services; 2008. [accessed on May 20, 2011]. Available at http://www.aoa.gov/AoAroot/Aging_Statistics/Profile/2008/docs/2008profile.pdf. [Google Scholar]
- American Psychiatric Association. Diagnostic and Statistical Manual of Mental Disorders. Washington, DC: American Psychiatric Association; 2000. [Google Scholar]
- Andresen EM, Catlin TK, Wyrwich KW, Jackson-Thompson J. Retest Reliability of Surveillance Questions on Health-Related Quality of Life. Journal of Epidemiology and Community Health. 2003;57(5):339–43. doi: 10.1136/jech.57.5.339. [DOI] [PMC free article] [PubMed] [Google Scholar]
- Bodenheimer T. Coordinating Care—A Perilous Journey through the Health Care System. New England Journal of Medicine. 2008;358(10):1064–71. doi: 10.1056/NEJMhpr0706165. [DOI] [PubMed] [Google Scholar]
- Brault B. 2008. Disability Status and the Characteristics of People in Group Quarters: A Brief Analysis of Disability Prevalence among the Civilian Noninstitutionalized and Total Populations in the American Community Survey [accessed on May 20, 2011]. Available at http://www.census.gov/hhes/www/disability/GQdisability.pdf.
- Brown DW, Balluz LS, Heath GW, Moriarty DG, Ford ES, Giles WH, Mokdad AH. Associations between Recommended Levels of Physical Activity and Health-Related Quality of Life. Findings from the 2001 Behavioral Risk Factor Surveillance System (BRFSS) Survey. Preventive Medicine. 2003;37(5):520–8. doi: 10.1016/s0091-7435(03)00179-8. [DOI] [PubMed] [Google Scholar]
- Campbell ML, Sheets D, Strong PS. Secondary Health Conditions among Middle-Aged Individuals with Chronic Physical Disabilities: Implications for Unmet Needs for Services. Assistive Technology. 1999;11(2):105–22. doi: 10.1080/10400435.1999.10131995. [DOI] [PubMed] [Google Scholar]
- Centers for Disease Control and Prevention (CDC) Behavioral Risk Factor Surveillance System: Operational and User's Guide Version 3.0. 2006a. [accessed on May 20, 2011]. Available at http://ftp.cdc.gov/pub/Data/Brfss/userguide.pdf.
- Centers for Disease Control and Prevention (CDC) Behavioral Risk Factor Surveillance System: 2006 Questionnaire. 2006b. [accessed on May 20, 2011]. Available at http://www.cdc.gov/brfss/questionnaires/pdf-ques/2006brfss.pdf.
- Centers for Disease Control, Prevention (CDC) Self-Reported Frequent Mental Distress among Adults—United States, 1993-2001. MMWR. 2004;53(41):963–6. [PubMed] [Google Scholar]
- Centers for Disease Control and Prevention (CDC) Measuring Healthy Days: Population Assessment of Health-Related Quality of Life. 2000. [accessed on May 20, 2011]. Available at http://www.cdc.gov/hrqol/pdfs/mhd.pdf.
- Chan L, Beaver S, MacLehose RF, Jha A, Maciejewski M, Doctor JN. Disability and Health Care Costs in the Medicare Population. Archives of Physical Medicine and Rehabilitation. 2002;83(9):1196–201. doi: 10.1053/apmr.2002.34811. [DOI] [PubMed] [Google Scholar]
- Chan L, Doctor JN, MacLehose RF, Lawson H, Rosenblatt RA, Baldwin L, Jha A. Do Medicare Patients with Disabilities Receive Preventive Services? A Population-Based Study. Archives of Physical Medicine and Rehabilitation. 1999;80(6):642–6. doi: 10.1016/s0003-9993(99)90166-1. [DOI] [PubMed] [Google Scholar]
- Clark RL, Burkhauser RV, Moon M, Quinn JF, Smeeding TM. The Economics of an Aging Society. Malden, MA: Blackwell Publishing; 2004. [Google Scholar]
- Coughlin T, Waidmann T, O'Malley Watts M. Where Does the Burden Lie: Medicaid and Medicare Spending for Dual Eligible Beneficiaries. Menlo Park, CA: The Kaiser Family Foundation; 2009. [accessed on May 20, 2011]. Available at http://www.kff.org/medicaid/upload/7895-2.pdf. [Google Scholar]
- Cubanski J, Neuman T, Strollo MK, Damico A, Gonzales R. Examining Sources of Coverage among Medicare Beneficiaries: Supplemental Insurance, Medicare Advantage, and Prescription Drug Coverage. Menlo Park, CA: The Kaiser Family Foundation; 2008. [accessed on May 20, 2011]. Available at http://www.kff.org/medicare/upload/7801.pdf. [Google Scholar]
- DeJong G, Palsbo SE, Beatty PW, Jones GC, Kroll T, Neri MT. The Organization and Financing of Health Services for Persons with Disabilities. Milbank Quarterly. 2002;80(2):261–301. doi: 10.1111/1468-0009.t01-1-00004. [DOI] [PMC free article] [PubMed] [Google Scholar]
- DeVoe JE, Fryer GE, Phillips R, Green L. Receipt of Preventive Care among Adults: Insurance Status and Usual Source of Care. American Journal of Public Health. 2003;93(5):786–91. doi: 10.2105/ajph.93.5.786. [DOI] [PMC free article] [PubMed] [Google Scholar]
- DeVoe JE, Tilotson CJ, Wallace LS. Usual Source of Care as a Health Insurance Substitute for U.S. Adults with Disabilities. Diabetes Care. 2009;32(6):983–9. doi: 10.2337/dc09-0025. [DOI] [PMC free article] [PubMed] [Google Scholar]
- Dunlop DD, Manheim LM, Song J, Chang RW. Gender and Ethnic/Racial Disparities in Health Care Utilization among Older Adults. Journal of Gerontology: Social Sciences. 2002;57B(3):S221–33. doi: 10.1093/geronb/57.4.s221. [DOI] [PubMed] [Google Scholar]
- Erickson WA, Dumoulin-Smith A. User Guide: A Guide to Disability Statistics from the Behavioral Risk Factors Surveillance System. Ithaca, NY: Rehabilitation Research and Training Center on Employment Policy for Persons with Disabilities; 2009. [accessed on May 20, 2011]. Available at http://digitalcommons.ilr.cornell.edu/cgi/viewcontent.cgi?article=1263&context=edicollect. [Google Scholar]
- Erickson W, Lee C, von Schrader S. 2008 Disability Status Report: The United States. Ithaca, NY: Cornell University Rehabilitation Research and Training Center on Disability Demographics and Statistics; 2010. [Google Scholar]
- Foote SM, Hogan C. Disability Profile and Health Care Costs of Medicare Beneficiaries under Age Sixty-Five. Health Affairs. 2001;20(6):242–53. doi: 10.1377/hlthaff.20.6.242. [DOI] [PubMed] [Google Scholar]
- Gluck ME, Hanson KW. Medicare Chart Book. 2001. [accessed on May 20, 2011]. Available at http://www.kff.org/medicare/loader.cfm?url=/commonspot/security/getfile.cfm&PageID=13598.
- Gulley SP, Rasch EK, Chan L. Ongoing Coverage for Ongoing Care: Access, Utilization, and Out-of-Pocket Spending among Uninsured Working-Aged Adults with Chronic Health Care Needs. American Journal of Public Health. 2011;101(2):368–75. doi: 10.2105/AJPH.2010.191569. [DOI] [PMC free article] [PubMed] [Google Scholar]
- Hanson KW, Neuman P, Dutwin D, Kasper JD. Uncovering the Health Challenges Facing People with Disabilities: The Role of Health Insurance. Health Affairs. 2003;19:552–65. doi: 10.1377/hlthaff.w3.552. (web exclusive) [DOI] [PubMed] [Google Scholar]
- Hanson K, Neuman T, Voris M. Understanding the Health-Care Needs and Experiences of People with Disabilities. Menlo Park, CA: The Kaiser Family Foundation; 2003. [Google Scholar]
- Havercamp SM, Scandlin D, Roth M. Health Disparities among Adults with Developmental Disabilities, Adults with Other Disabilities, and Adults Not Reporting Disability in North Carolina. Public Health Reports. 2004;119(4):418–26. doi: 10.1016/j.phr.2004.05.006. [DOI] [PMC free article] [PubMed] [Google Scholar]
- Iezzoni LI, Killeen MB, O'Day BL. Rural Residents with Disabilities Confront Substantial Barriers to Obtaining Primary Care. Health Services Research. 2006;41(4):1258–75. doi: 10.1111/j.1475-6773.2006.00534.x. [DOI] [PMC free article] [PubMed] [Google Scholar]
- Iezzoni LI, McCarthy EP, Davis RB, Siebens H. Mobility Impairments and Use of Screening and Preventive Services. American Journal of Public Health. 2000;90(6):955–61. doi: 10.2105/ajph.90.6.955. [DOI] [PMC free article] [PubMed] [Google Scholar]
- Iezzoni LI, Ngo LH, Li D, Roetzheim RG, Drews RE, McCarthy EP. Treatment Disparities for Disabled Medicare Beneficiaries with Stage I Non-Small Cell Lung Cancer. Archives of Physical Medicine and Rehabilitation. 2008;89(4):595–601. doi: 10.1016/j.apmr.2007.09.042. [DOI] [PubMed] [Google Scholar]
- Iezzoni LI, O'Day BL. More Than Ramps: A Guide to Improving Health Care Quality and Access for People with Disabilities. New York: Oxford University Press; 2006. [Google Scholar]
- Jiang Y, Hesser JE. Associations between Health-Related Quality of Life and Demographics and Health Risks. Results from Rhode Island's 2002 Behavioral Risk Factor Survey. Health and Quality of Life Outcomes. 2006;4:14. doi: 10.1186/1477-7525-4-14. [DOI] [PMC free article] [PubMed] [Google Scholar]
- Kaiser Family Foundation. Medicare: A Primer, 2010. Menlo Park, CA: The Kaiser Family Foundation; 2010a. [accessed on May 20, 2011]. Available at http://www.kff.org/medicare/upload/7615-03.pdf. [Google Scholar]
- Kaiser Family Foundation. Side-by-Side Comparison of Major Health Care Reform Proposals. Menlo Park, CA: The Kaiser Family Foundation; 2010b. [accessed on May 20, 2011]. Available at http://www.kff.org/healthreform/upload/housesenatebill_final.pdf. [Google Scholar]
- Kinne S, Patrick DL, Doyle DL. Prevalence of Secondary Conditions among People with Disabilities. American Journal of Public Health. 2004;94(3):443–5. doi: 10.2105/ajph.94.3.443. [DOI] [PMC free article] [PubMed] [Google Scholar]
- Kinne S, Topolski TD. Inclusion of People with Disabilities in Telephone Health Surveillance Surveys. American Journal of Public Health. 2005;95(3):512–7. doi: 10.2105/AJPH.2004.040881. [DOI] [PMC free article] [PubMed] [Google Scholar]
- Klein D, Turvey C, Wallace R. Elders Who Delay Medication Because of Cost: Health Insurance, Demographic, Health, and Financial Correlates. Gerontologist. 2004;44(6):779–87. doi: 10.1093/geront/44.6.779. [DOI] [PubMed] [Google Scholar]
- Lishner DM, Richardson M, Levine P, Patrick D. Access to Primary Health Care among Persons With Disabilities in Rural Areas: A Summary of the Literature. Journal of Rural Health. 1996;12(1):45–53. doi: 10.1111/j.1748-0361.1996.tb00772.x. [DOI] [PubMed] [Google Scholar]
- Little R, Raghunathan T. Should Imputation of Missing Data Condition on All Observed Variables? American Statistical Association Proceedings of the Section on Survey Research Methods. 1997;pp:617–22. [Google Scholar]
- Little RJ, Rubin DB. Statistical Analysis with Missing Data. 2d Edition. New York: Wiley-Interscience; 2002. [Google Scholar]
- McCarthy EP, Ngo LH, Roetzheim RG, Chirikos TN, Li D, Drews RE, Iezzoni LI. Disparities in Breast Cancer Treatment and Survival for Women with Disabilities. Annals of Internal Medicine. 2006;145(9):637–45. doi: 10.7326/0003-4819-145-9-200611070-00005. [DOI] [PMC free article] [PubMed] [Google Scholar]
- Millman M. Access to Health Care in America. Washington, DC: National Academy Press; 1993. [PubMed] [Google Scholar]
- Mokdad AH. The Behavioral Risk Factor Surveillance System: Past, Present, and Future. Annual Review of Public Health. 2009;30:43–54. doi: 10.1146/annurev.publhealth.031308.100226. [DOI] [PubMed] [Google Scholar]
- Moon M. Medicare: A Policy Primer. Washington, DC: The Urban Institute Press; 2006. [Google Scholar]
- Moon M. Sustaining Medicare as an Age-Related Program. In: Hudson RB, editor. The New Politics of Old Age Policy. Baltimore, MD: The Johns Hopkins University Press; 2005. pp. 205–18. [Google Scholar]
- National Center for Health Statistics. Health, United States, 2006 with Chartbook on Trends in the Health of Americans. 2006. [accessed on May 20, 2011]. Available at http://www.cdc.gov/nchs/data/hus/hus06.pdf. [PubMed]
- Nelson DE, Holtzman D, Bolen J, Stanwyck CA, Mack KA. Reliability and Validity of Measures from the Behavioral Risk Factor Surveillance System (BRFSS) Social and Preventive Medicine. 2001;46(Suppl 1):S3–42. [PubMed] [Google Scholar]
- Nelson DE, Powell-Griner E, Town M, Kovar MG. A Comparison of National Estimates from the National Health Interview Survey and the Behavioral Risk Factor Surveillance System. American Journal of Public Health. 2003;93(8):1335–41. doi: 10.2105/ajph.93.8.1335. [DOI] [PMC free article] [PubMed] [Google Scholar]
- Parish SL, Saville AW. Women with Cognitive Limitations Living in the Community: Evidence of Disability-Based Disparities in Health Care. Mental Retardation. 2006;44(4):249–59. doi: 10.1352/0047-6765(2006)44[249:WWCLLI]2.0.CO;2. [DOI] [PubMed] [Google Scholar]
- Phillips RL, Proser M, Green LA, Fryer GE, McCann J, Dodoo MS. The Importance of Having Health Insurance and a Usual Source of Care. American Family Physician. 2004;70(6):1035. [PubMed] [Google Scholar]
- Raghunathan TE. What Do We Do with Missing Data? Some Options for Analysis of Incomplete Data. Annual Review of Public Health. 2004;25:99–117. doi: 10.1146/annurev.publhealth.25.102802.124410. [DOI] [PubMed] [Google Scholar]
- Rasch EK, Magder L, Hochberg MC, Magaziner J, Altman BM. Health of Community-Dwelling Adults with Mobility Limitations in the United States: Incidence of Secondary Health Conditions. Part II. Archives of Physical Medicine and Rehabilitation. 2008;89:219–30. doi: 10.1016/j.apmr.2007.08.159. [DOI] [PubMed] [Google Scholar]
- Reis JP, Breslin ML, Iezzoni LI, Kirschner KL. It Takes More Than Ramps to Solve the Crisis of Healthcare for People with Disabilities. Chicago, IL: Rehabilitation Institute of Chicago; 2004. [Google Scholar]
- Rice DP, LaPlante MP. Medical Expenditures for Disability and Disabling Comorbidity. American Journal of Public Health. 1992;82(5):739–41. doi: 10.2105/ajph.82.5.739. [DOI] [PMC free article] [PubMed] [Google Scholar]
- Rubin DB. Multiple Imputation for Nonresponse in Surveys. New York: Wiley; 1987. [Google Scholar]
- Shi L, Stevens GD. Vulnerability and Unmet Health Care Needs: The Influence of Multiple Risk Factors. Journal of General Internal Medicine. 2005;20(2):148–54. doi: 10.1111/j.1525-1497.2005.40136.x. [DOI] [PMC free article] [PubMed] [Google Scholar]
- Stapleton DC, Burkhauser RV. The Decline in Employment of People with Disabilities: A Policy Puzzle. Kalamazoo: W.E. Upjohn Institute for Employment Research; 2003. [Google Scholar]
- Strine TW, Chapman DP, Kobau R, Balluz L, Mokdad AH. Depression, Anxiety, and Physical Impairments and Quality of Life in the U.S. Noninstitutionalized Population. Psychiatric Services. 2004;55(12):1408–13. doi: 10.1176/appi.ps.55.12.1408. [DOI] [PubMed] [Google Scholar]
- Strine TW, Okoro CA, Chapman DP, Balluz LS, Ford ES, Ajani UA, Mokdad AH. Health-Related Quality of Life and Health Risk Behaviors among Smokers. American Journal of Preventive Medicine. 2005;28(2):182–7. doi: 10.1016/j.amepre.2004.10.002. [DOI] [PubMed] [Google Scholar]
- U.S. Department of Health and Human Services (DHHS) National Health Disparities Report, 2008. Rockville, MD: Agency for Healthcare Research and Quality; 2009. [Google Scholar]
- U.S. Department of Health and Human Services (DHHS) Closing the Gap: A National Blueprint to Improve the Health of Persons with Mental Retardation. Report of the Surgeon General's Conference on Health Disparities and Mental Retardation. Washington, DC: U.S. Government Printing Office; 2002. [PubMed] [Google Scholar]
- U.S. Department of Health and Human Services (DHHS) Healthy People 2010: Understanding and Improving Health. Washington, DC: U.S. Government Printing Office; 2000. [Google Scholar]
- Weaver KE, Rowland JH, Bellizzi KM, Aziz NM. Forgoing Medical Care Because of Cost: Assessing Disparities in Healthcare Access among Cancer Survivors Living in the United States. Cancer. 2010;116(14):3493–504. doi: 10.1002/cncr.25209. [DOI] [PMC free article] [PubMed] [Google Scholar]
- Wiener JM. Long-Term Care: Getting on the Agenda and Knowing What to Propose. Medical Care Research and Review. 2010;67(4):126S–40S. doi: 10.1177/1077558710365718. [DOI] [PubMed] [Google Scholar]
- Williams B, Dulio A, Claypool H, Perry MJ, Cooper BS. Waiting for Medicare: Experiences of Uninsured People with Disabilities in the Two-Year Waiting Period for Medicare. New York: The Commonwealth Fund; 2004. [accessed on May 20, 2011]. Available at http://www.commonwealthfund.org/usr_doc/786_Williams_waiting_for_Medicare.pdf. [Google Scholar]
- Yelin E, Cisternas M, Trupin L. The Economic Impact of Disability in the United States, 1997. Journal of Disability Policy Studies. 2006;17(3):137–47. [Google Scholar]
Associated Data
This section collects any data citations, data availability statements, or supplementary materials included in this article.