

Abstract
Objective
The goal of this research project was to develop a volumetric strategy for real-time monitoring and characterization of tumor blood flow using microbubble contrast agents and ultrasound (US) imaging.
Materials and Methods
Volumetric contrast-enhanced US (VCEUS) imaging was implemented on a SONIX RP US system (Ultrasonix Medical Corp, Richmond, BC) equipped with a broadband 4DL14-5/38 probe. Using a microbubble sensitive harmonic imaging mode (transducer transmits at 5 MHz and receives at 10 MHz) acquisition of post scan-converted VCEUS data was achieved at a volume rate of 1 Hz. Following microbubble infusion, custom data processing software was used to derive microbubble time-intensity curve-specific parameters, namely, blood volume (IPK), transit time (T1/2PK), flow rate (SPK), and tumor perfusion (AUC).
Results
Using a preclinical breast cancer animal model, it is shown that millimeter-sized deviations in transducer positioning can have profound implications on US-based blood flow estimators with errors ranging from 6.4 to 40.3% and dependent on both degree of misalignment (offset) and particular blood flow estimator. These errors indicate that VCEUS imaging should be considered in tumor analyses because they incorporate the entire mass and not just a representative planar cross-section. Following administration of an antiangiogenic therapeutic drug (bevacizumab), tumor growth was significantly retarded compared to control tumors (p > 0.03) and reflect observed changes in VCEUS-based blood flow measurements. Analysis of immunohistologic data revealed no differences in intratumoral necrosis levels (p = 0.70) but a significant difference was found when comparing MVD counts in control to therapy group tumors (p = 0.05).
Conclusions
VCEUS imaging was shown to be a promising modality for monitoring changes in tumor blood flow. Preliminary experimental results are encouraging and this imaging modality may prove clinically feasible for detecting and monitoring the early antitumor effects in response to cancer drug therapy.
Keywords: Contrast agent, microbubbles, perfusion imaging, volumetric ultrasound imaging
INTRODUCTION
Among the early developments that differentiate normal from cancerous tissue is the angiogenic process by which the tumor develops its blood supply from pre-existing vessels [1]-[5]. The morphology of this neovascularity is often quantified as the intratumoral microvessel density (MVD) and has been shown to be an independent predictor of malignant disease [6]-[9]. Angiogenesis is a prerequisite for tumor growth and a factor in metastatic dissemination [10]-[12]. Therefore, tumor angiogenesis is an important biomarker for cancer imaging and therapeutic monitoring.
The opportunity for noninvasive imaging of tumor angiogenesis is strengthened by the fact that vessels form a substantial portion of the mass of malignant tumors, contributing up to 10% of the total volume [13]. Traditional grayscale ultrasound (US) imaging is one of the most frequently used clinical imaging modalities. The primary advantages of this imaging method are minimal health risks associated with patient exposure to US energy, real-time capability, and the relatively low cost associated with both examinations and system maintenance. A recent advance in US imaging has been the development of microbubble contrast agents. These microbubbles are sub-capillary sized gas-filled spheres with circulatory lifetimes on the order of minutes. Because of large acoustical impedance and compressibility differences between intravascular microbubbles and the surrounding blood, they excel as US scatterers. Therefore, microbubble contrast agents improve US sensitivity to slow blood flow in small vessels such as those associated with tumor angiogenesis.
In response to an US field, microbubble contrast agents undergo an oscillatory movement (or resonation); a process called stable cavitation. Under higher acoustical pressures, this can lead to nonlinear scattering and generation of echoes with frequency components at multiples of the transmit frequency [14]. These nonlinear microbubble echoes (harmonic signals) can be selectively isolated from the tissue echoes using signal processing and pulsing techniques to create contrast-enhanced US (CEUS) imaging modalities.
Contrast-enhanced US imaging has evolved considerably over the last decade. By tracking patterns of microbubble circulation, two-dimension (2D) parametric estimation and mapping of blood kinetics has been successfully demonstrated in recent preclinical [15]-[20] and clinical studies [21]-[25]. However, one limitation to standard 2D US imaging is that the narrow elevational beamwidth provides information in only a single slice of tissue. Previously, CEUS images, following administration of a microbubble contrast agent, were taken as the transducer was stepped in the elevational direction across the region-of-interest in a xenograft animal model to estimate tumor perfusion [26] or vascular density [27], [28]. Thereafter, image fusion leads to a volumetric map. When using a bolus injection, a main limitation to volumetric CEUS (VCEUS) is that the administered intravenous microbubbles have a circulatory half-life on the order of minutes [26]. This short half-life may lead to time-intensity curve mismatch and erroneous tumor blood flow parametric maps due to contrast agent extinction. While the elapsed time between motion steps can be shortened to accelerate volumetric data acquisition, this inherently limits the amount of time-intensity curve data that can be collected per image cross-section, thus, compromising tumor blood flow measurement accuracy.
The main impediment to real-time VCEUS imaging capability in years past was transducer technology. However, medical imaging manufacturers have overcome the technical issues and have begun to introduce three-dimensional (3D) imaging transducers and systems that support volumetric US imaging. When combined with microbubble-sensitive imaging modes, real-time VCEUS imaging has been shown clinically to improve diagnostic confidence with liver lesions in human [29], [30] and improve ablation therapy monitoring [31]. In this study, we further extend real-time VCEUS imaging functionality to allow longitudinal parametric mapping of tumor blood flow. This technique is validated using a preclinical animal model and vasculature disrupting agent known to modulate tumor blood flow.
MATERIALS AND METHODS
Cell Culture
The 2LMP metastatic subclone of the human breast cancer cell line MDA-MB-231 was maintained in Dulbecco’s modified Eagle’s medium (Mediatech Inc, Manassas, VA) supplemented with 10% fetal bovine serum (HyClone, Logan, UT). Cells were cultured in 150 cm2 flasks (Corning Inc Life Sciences, Lowell, MA). At approximately 80 to 90% confluency, cells were harvested by trypsinization. Cell counts were quantified using a hemocytometer (Hausser Scientific, Horsham, PA) and trypan blue dye (Mediatech Inc) exclusion. All cells were diluted to a final concentration of 1 × 10⁶ cells/mL.
Animal Preparation
Animal experiments were reviewed and approved by the Institutional Animal Care and Use Committee (IACUC) at the University of Alabama at Birmingham. Fourteen 6-week-old nude female athymic mice (Jackson Laboratory, Bar Harbor, ME) were implanted with 2 × 10⁶ cancer cells in the left flank. Approximately three weeks following implantation a vascular access port (Access Technologies, Skokie, IL) was surgically implanted (sutured to the jugular vein) in all animals [32] and allowed at least five days to properly recover from the surgery. Figure 1 illustrates subcutaneous port placement with respect to flank tumors. Vascular access ports were flushed daily using 100 μL injections of 10% heparin sodium solution in saline (AAP Pharmaceuticals, LLC, Schaumburg, IL) to prevent blood coagulation inside of the catheter.
Figure 1.
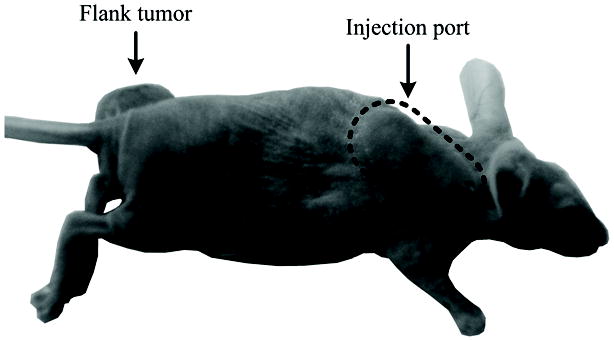
Illustration of subcutaneous vascular access port placement in an animal model with respect to implanted flank tumors.
Following surgical recovery and baseline VCEUS imaging, four animals were sacrificed for histological processing of excised tumors. The remaining animals (N = 10) were sorted by tumor size into two groups. Average tumor volume was consequentially equal between the groups. The therapy group received a 0.1 mg intraperitoneal injection of a known tumor vasculature disrupting agent (Bevacizumab, Genentech, South San Francisco, CA) while control group animals received an equivalent injection of saline only.
Ultrasound Imaging
Imaging was performed at day 0 prior to drug dosing and at days 2 and 7 thereafter using the SONIX RP US system (Ultrasonix Medical Corp, Richmond, BC) equipped with a broadband 4DL14-5/38 volumetric probe. With a single adjustable beam focus (set to 10 mm for all experiments) this motorized transducer has a line density of 128 elements (300 μm pitch) and maximum motor field-of-view (FOV) of 55.0° at 636 steps (0.086° per step). Backscattered RF data is decimated by the system at a rate of 20 MHz. Animals were maintained under isoflurane anesthesia while imaging was performed in a water bath setup at a temperature of 37 °C. The transducer was fixed (Assist Positioning Arm, CIVCO Medical Solutions, Kalona, IA) to minimize motion and registration artifacts when processing.
The US contrast agent (Definity, Lantheus Medical Imaging, North Billerica, MA) used for all studies were perflutren lipid-coated microbubbles. After activation, contrast agent concentration was approximately 1.2 × 10¹⁰ microbubbles per mL of suspension. According to information provided by the manufacturer, the mean diameter of these microbubble contrast agents ranged from 1.1 to 3.3 μm. Activated US contrast agents were further suspended in saline (1:5 dilution) and slowly infused (200 μL) via the surgically placed animal injection ports at a rate of 500 μL/min for 24 sec using a syringe pump (New Era Pump Systems Inc, Farmingdale, NY). Since the US imaging system used for this study does not currently support a microbubble destruction-replenishment feature with the chosen volumetric transducer, controlled infusion of contrast agents allowed imaging and data capture of microbubble circulation and initial arrival at the tumor site. Therefore, analysis was limited to the wash-in phase of tumor blood flow.
Using a low-intensity microbubble sensitive harmonic imaging mode (mechanical index of 0.3, transmits at 5 MHz and receives at 10 MHz) acquisition of post scan-converted CEUS data was controlled using the research-based software package Propello (Ultrasonix Medical Corp). The graphical user interface allows customization of US scans in order to achieve the desired FOV and volume rate. Specifically, automatic sweeps were implemented with degrees per frame and frames per volume set to 0.692 and 41, respectively. Given a FOVX (width) and FOVY (depth) of 38.4 and 25.0 mm, respectively, this allowed for a FOVZ (elevation) of 28.4 mm and volume rate of 1.0 Hz. Voxel sizes were 0.3 mm × 0.3 mm × 0.7 mm (width × depth × elevation). Cine data was acquired for at least 60 sec and US system settings (e.g., dynamic range, gain, and voxel size) were fixed for all imaging sessions. All data was saved for offline processing using techniques described below.
Data Processing
Custom programs were developed using the software package Matlab (Mathworks Inc, Natick, MA) that allowed processing of volumetric US image data. Semiautomatic segmentation of imaged tumors was performed using discrete dynamic contour image segmentation [15], [33], which allowed analysis of tumor vascularity while minimizing data processing time. Since US imaging was initiated at the onset of microbubble infusion, the time history of data acquisition contained a reference period prior to contrast agent arrival in the FOV. The initial volume (intensity) from each VCEUS scan was used as background reference intensity with all subsequent image volumes normalized by this reference [34]. Next, time-intensity curves (from each voxel) were generated from a sequence of VCEUS images and fit to a sigmoid function defined as
| (1) |
using nonlinear least-squares regression techniques. This function describes a curve with low initial slope that increases secondarily to an inflexion point [35]. Blood flow kinetics were summarized using the following curve-specific parameters, namely, blood volume (peak intensity, IPK), transit time (time to half peak intensity, T1/2PK), flow rate (slope of the peak, SPK), and tumor perfusion (area under the curve, AUC). Figure 2 depicts the VCEUS imaging system used for this study and the corresponding data processing strategy.
Figure 2.
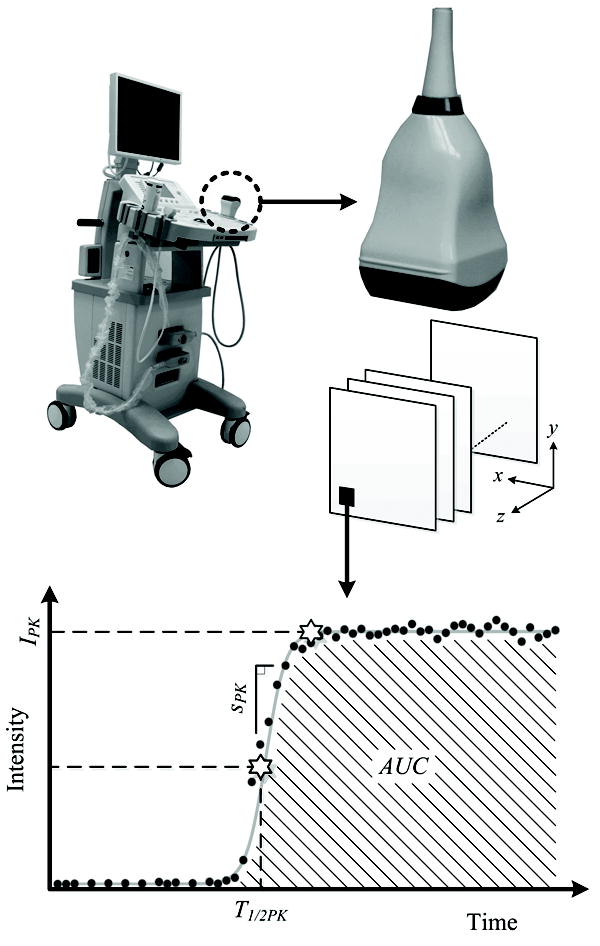
Description of the real-time volumetric contrast-enhanced ultrasound (VCEUS) system which was developed using a commercial research scanner and four-dimensional (4D) probe. Following collection of multi-dimensional volumetric data, custom software analyzes time-intensity curve information voxel-by-voxel to derive parametric blood flow measurements, namely, blood volume (IPK), transit time (T1/2PK), flow rate (SPK), and tumor perfusion (AUC).
Immunohistologic Analysis
After experimentation, animals were humanely euthanized and tumors surgically excised. Using established protocols, sectioned tumors underwent staining with hematoxylin and eosin (H&E) and CD31 antibody for quantification of tumor necrosis and MVD, respectively. Excised tumors following baseline studies were sectioned into four equidistant slices whereas tumor samples following endpoint experiments were only processed along the maximum transverse cross-sectional plane. Histology was reviewed by an experienced reader blinded to the experimental groups. H&E sections were examined for cellular necrosis and reported as percent of the entire tumor cross-section (original magnification x40). Each CD31 section was examined (original magnification x40) to identify five separate areas containing the greatest number of microvessels. Individual vessels from these five areas were counted (original magnification x200), averaged, and recorded as MVD. Dense microvessel regions were manually delineated using ImageJ software [36] and color coded for visual comparison to imaging results.
Statistical Analysis
Experimental data was summarized as mean ± SE. Linear regression analyzed relationships between imaging metrics and immunohistologic results. Differences in VCEUS-based parametric blood flow measurements, tumor sizes, or immunohistologic data were evaluated using a 2-sample t-test. Differences in time point data were assessed using a repeated measures ANOVA test. Finding with p < 0.05 were considered statistically significant. All data was analyzed using either Excel (Microsoft Corp, Redmond, WA) or with dedicated JMP statistical software (SAS, Cary, NC).
EXPERIMENTAL RESULTS
Contrast-enhanced US images were collected in tumor-bearing animals. A representative volumetric sequence (22 frames) of segmented contrast-enhanced B-mode US images is depicted in Figure 3. Notice that as the transducer sweeps longitudinally across the tumor, a heterogeneous enhancement pattern prevails, which was consistent with all tumors imaged. Using time-intensity voxel data information, tumor perfusion parametric maps were generated and are shown in Figure 4. Note that the four different blood flow maps were derived from the same tumor depicted in Figure 3 (frames 9 to 12). These image sequences allow inspection of parameters impacting tumor blood flow across the entire tumor volume, whereas conventional US-based methods have been limited to single imaging planes.
Figure 3.
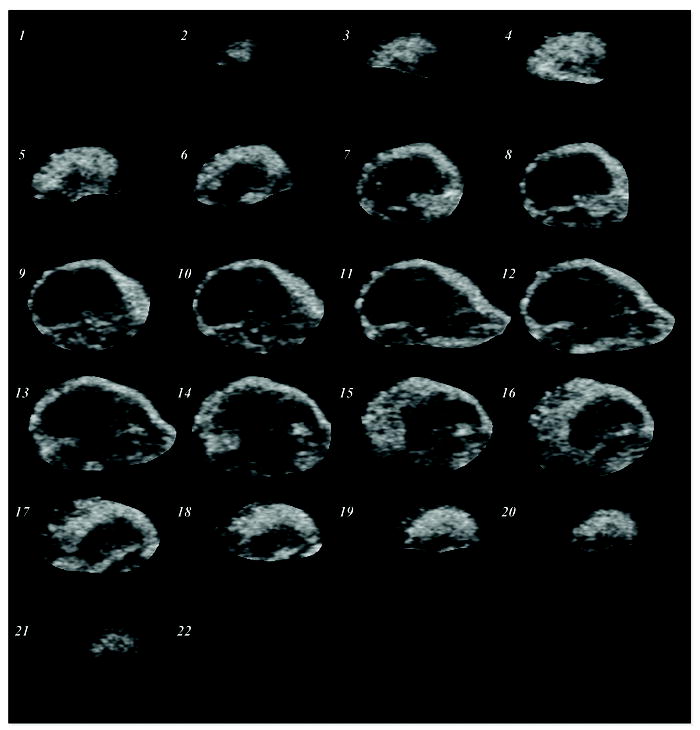
Segmented multi-slice contrast-enhanced US image sequence describing spatial tumor blood flow in a preclinical animal model. Images describe the prevalence of tumor vascularity in the tumor peripheral.
Figure 4.
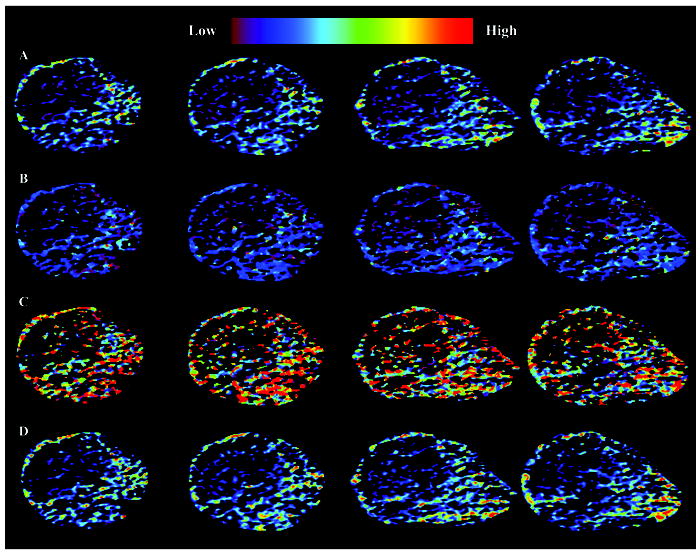
Depiction of matched quantitative tumor blood flow measurements. Four frame sequences are mapped representing the (A) IPK, (B) T1/2PK, (B) SPK, and (D) AUC parameters. Note sequential images were derived from the tumor center with planar spacing of 0.7 mm.
Given a VCEUS image acquisition, each frame was summarized and plotted as a function of distance from the tumor midsection. Representative graphs of the different tumor blood flow parameters are illustrated in Figure 5. Of interest, blood volume (IPK) and perfusion (AUC) are more pronounced along tumor periphery (consistent with results found throughout the tumor volume), whereas microbubble transit time (T1/2PK) following infusion appears to be relatively uniform with a slight increase as the transducer sweeps along the craniocaudal axis. The tumor blood flow rate (SPK) graph exhibits the highest degree of both inter and intra-frame variability which is due in part to heterogeneous tumor blood flow rates and/or parametric estimator noise.
Figure 5.
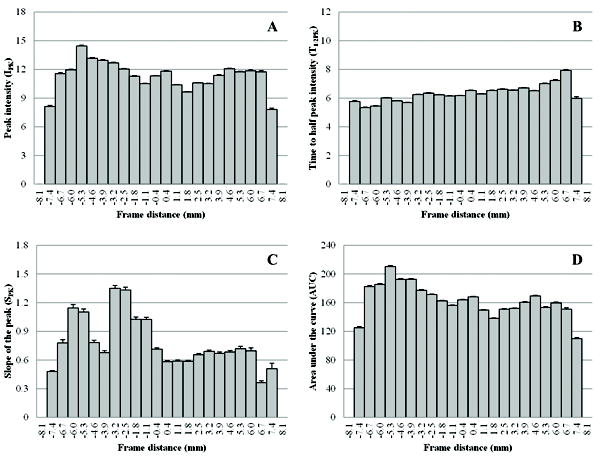
Representative planar image summaries describing the spatial variability (on a millimeter scale) of VCUES-derived tumor cross-sectional blood flow measurements, namely, the (A) IPK, (B) T1/2PK, (C) SPK, and (D) AUC parameters.
Conventional US-based tumor blood flow estimators are derived using representative planar measurements (e.g., along maximal cross-sectional size). While success has been shown using these techniques during longitudinal studies, these methods are prone to misregistration artifacts due to inevitable deviations in transducer positioning from one US examination to the next. To highlight these positioning artifacts, each baseline image data set was reviewed to find the maximal tumor cross-sectional area from the volume stack of US images and deviation in blood flow measurements were computed relative to this reference frame. As depicted in Figure 6, millimeter-sized deviations in transducer positioning can have profound implications on US-based blood flow estimators with errors ranging from 6.4 to 40.3%. This is dependent on both degree of misalignment (offset) and particular blood flow estimator. While T1/2PK appears to be the more robust parameter, SPK estimates suffer from higher levels of misalignment artifact which could be attributed to the relatively low volumetric imaging rates (1 Hz) compared to actual intravascular microbubble flow rates. Errors indicate that VCEUS-based blood flow measurements should be considered in tumor analyses since they incorporate the entire mass and are not limited to a representative cross-section. As shown in [19], tissue biomarker distributions (as commonly targeted using molecular US imaging techniques) also exhibit heterogeneous patterns which could further increase the risk of misrepresenting complex tissues using planar imaging methods.
Figure 6.
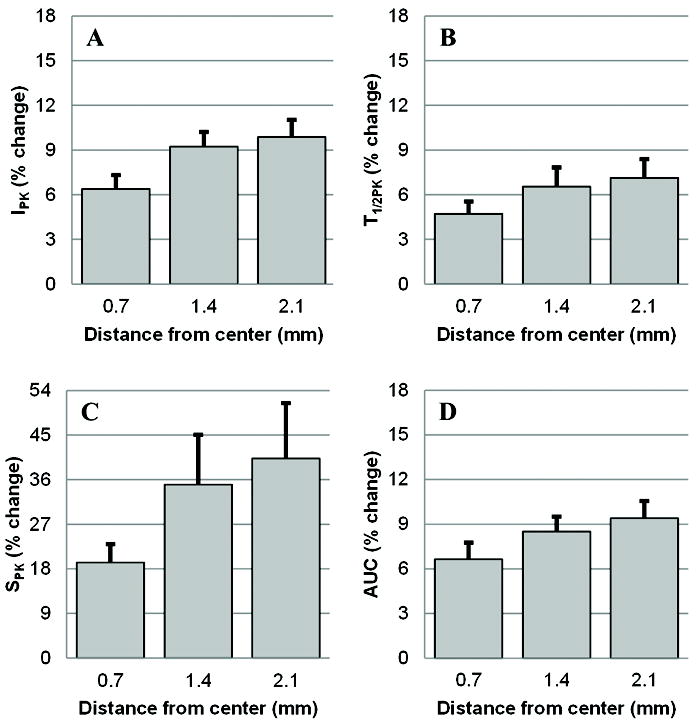
Following identification of maximal tumor cross-sectional area from each volume stack of US images, deviation in blood flow measurements relative to this reference frame were summarized as percent change. As shown for the (A) IPK, (B) T1/2PK, (C) SPK, and (D) AUC parameters, millimeter-sized deviations in transducer positioning have profound implications on US-based blood flow estimators with errors ranging from 6.4 to 40.3%.
Baseline immunohistologic results from the same tumor, depicted in Figures 4 and 5, are presented in Figure 7. Inspection of these results reveals that MVD counts are more pronounced along the tumor periphery compared to sections describing predominately tumor core measurements. These findings are analogous to blood flow measurements describing blood volume (c.f. Figure 5a) and perfusion (c.f. Figure 5d). Each of the baseline immunohistologic section locations (four from each tumor) were approximated and paired to corresponding VCEUS-based tumor blood flow planar measurements (N = 16). Regression analysis revealed a statistically significant relationship between MVD and both IPK (R2 = 0.59, p < 0.001) and AUC (R2 = 0.38, p = 0.01). No significant trends were observed between MVD and the T1/2PK (R2 = 0.18, p = 0.11) or SPK (R2 = 0.04, p = 0.48) blood flow metrics. Lastly, no statistically significant correlations were found between tumor necrosis levels and any of the quantitative VCEUS tumor vascularity measurements (R2 < 0.09, p > 0.27).
Figure 7.
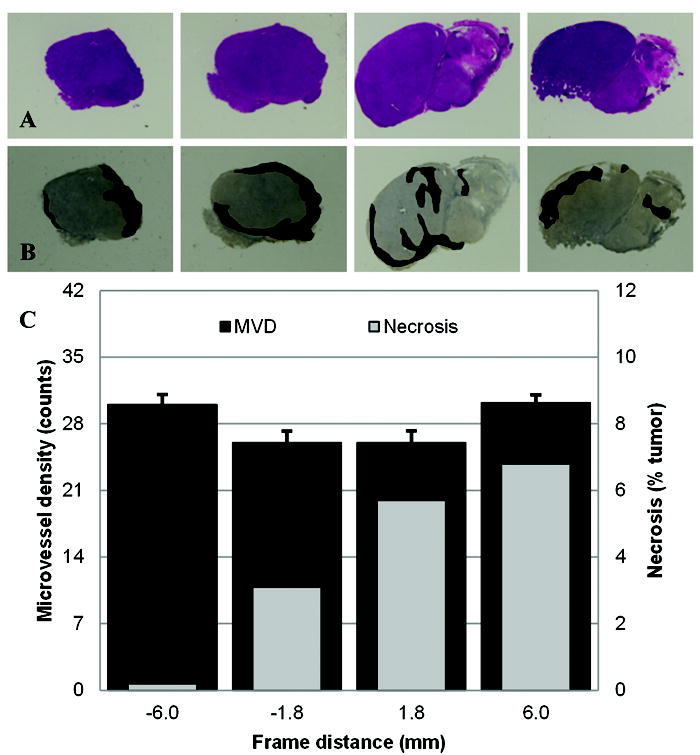
Representative immunohistologic results depicting (A) H&E and (B) CD31 stained multi-slice sections derived from the same excised tumor. (C) Plots of intratumoral necrosis and MVD derived from these same H&E and CD31 sections, respectively, summarized by distance from tumor center. Note dense regions of tumor microvessels were enhanced and shaded for visual identification.
Longitudinal analysis of VCEUS-based tumor blood flow measurements are summarized in Figure 8. At baseline, no significant differences were found in any of the tumor blood parametric measurements (p > 0.16). After administration of a tumor vasculature disrupting therapeutic agent, no changes in these same VCEUS-based measurements were observed at day 2 (p > 0.38), but considerable deviations prevailed at day 7 for the AUC (p = 0.06), IPK (p = 0.13) and T1/2PK (p = 0.25) parametric blood flow estimates. No such trend was found on day 7 for the SPK measurements (p = 0.94). While no significant differences between repeated group blood flow measurements were found (p > 0.26), there was a progressive increase in AUC and IPK measurements from control animals which is consistent with changes in physical tumor size over the same time period (Figure 9). While no such changes in tumor volume were evident between day 2 and 7 for the therapy group animals, there was a considerable decrease in AUC and IPK measurements indicating an overall reduction in intratumoral blood flow. For the T1/2PK measurements, the reverse trend was observed suggesting transient changes in intratumoral blood flow circulation times were increased. Throughout the duration of this study, increases in intratumoral blood flow rates (SPK) were found but there were no differences between control and therapy group animals (p = 0.99). Analysis of repeated tumor volume measurements revealed a statistically significant difference between the control and therapy groups (p > 0.03). Importantly, no relationship was found between tumor size and intratumoral MVD (R2 < 0.001, p = 0.84) while a trend towards significance was found between tumor size and intratumoral necrosis (R2 = 0.35, p = 0.07). Intergroup analysis of immunohistologic data revealed no differences in intratumoral necrosis levels (p = 0.70) but a significant difference was found when comparing MVD counts in control to therapy group tumors (p = 0.05). Collectively, longitudinal VCEUS-based tumor measurements were reflective of treatment effects and physical changes in intratumoral blood flow.
Figure 8.
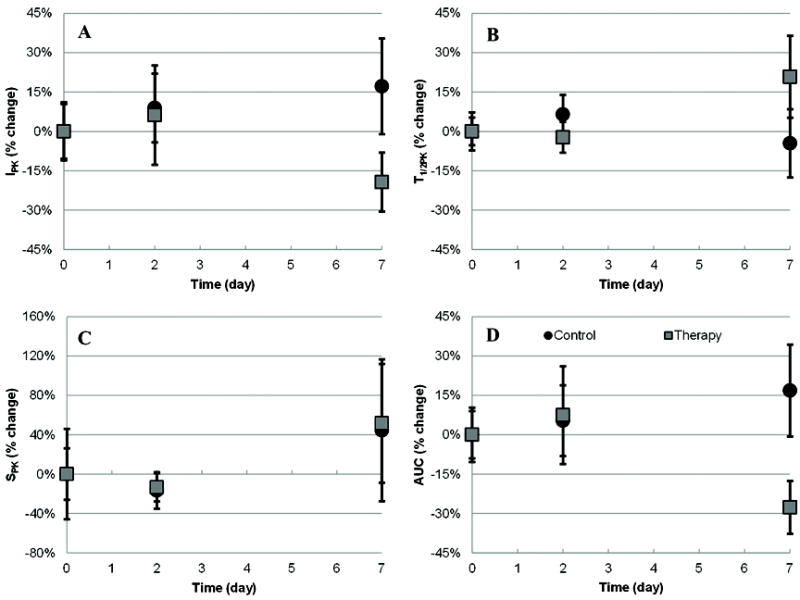
Summary of longitudinal VCEUS-based tumor blood flow measurements depicting the (A) IPK, (B) T1/2PK, (C) SPK, and (D) AUC parameters. Data was collected at baseline and days 2 and 7 following administration of a vasculature disrupting (antiangiogenic) therapeutic drug or equivalent control dose of saline.
Figure 9.
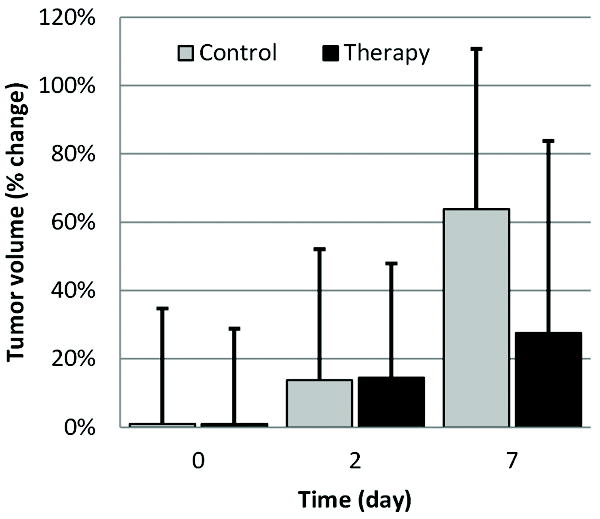
Observation of the physical changes in tumor volume following administration of a vasculature
DISCUSSION
This article introduced a volumetric strategy for real-time monitoring and characterization of tumor blood flow using microbubble contrast agents and harmonic US imaging. Following the infusion of microbubbles, custom data processing software was used to derive microbubble time-intensity curve-specific parameters, namely, blood volume (IPK), transit time (T1/2PK), flow rate (SPK), and tumor perfusion (AUC). Analyzing this information voxel-by-voxel provides blood flow information at both the local microenvironment and global tumor (using summarizing statistics) level.
Imaging results confirmed that vascularity is heterogeneously distributed throughout the tumor volume with predominance in the peripheral region. Considering this non-uniform vascular network, repeated planar US imaging-based measurements are inherently prone to misregistration artifacts especially during longitudinal studies. From a subset of animals used in this study, it was shown that millimeter-sized displacements in transducer positioning have a profound impact on US-based planar blood flow estimations. Measurement deviations ranged from 6.4 to 40.3% and were dependent on both the degree of transducer offset (0.7 to 2.1 mm) and particular blood flow parameter considered. A similar study was recently conducted whereby differences in transducer positioning and subsequent 2D quantitative blood flow estimates were evaluated in a rat kidney model [26]. Analogous to our results, this group reported that planar CEUS-based blood flow measurements had standard deviations on the order of 10%. Collectively, these errors indicate that VCEUS-based blood flow measurements should be considered in tumor analyses when possible because they incorporate information from the entire mass and not just representative planar cross-sections.
Throughout the last decade, the use of CEUS to assess tumor perfusion has been explored extensively in animal models [15]-[20], [37]-[41]. In this paper we described a longitudinal analysis of VCEUS-based tumor blood flow measurements. Importantly, our results demonstrate in a preclinical animal model that parametric blood flow measurements over time reflect changes in tumor vascularity when disrupted using an antiangiogenic drug. In a similar study investigating the potential of VCEUS imaging for blood flow characterization, feasibility was demonstrated in a preclinical animal model of testicular torsion using an US system equipped with a 2D matrix-phased array transducer [34]. Following microbubble infusion, tissue blood flow estimates derived using VCEUS image data exhibited agreement with tissue blood flow measurements obtained with radiolabeled microspheres (reference standard). These findings suggest that VCEUS-based parametric measurements of blood flow may be useful noninvasive surrogate biomarkers for actual tissue perfusion.
As our analysis technique processed post-scan converted volumetric image data sets, it is hypothesized that the use of raw RF echo or pre-scan converted US data may further improve our findings since image intensity compression limits the dynamic range and sensitivity to small signal changes. Future work will address this limitation while investigating more computationally efficient algorithms for generating quantitative maps of tissue vascularity. The latter is important for providing more timely feedback during VCEUS examinations.
CONCLUSIONS
A novel technique for the quantitative mapping of tumor vascularity using VCEUS was introduced. Imaging results revealed that the reproducibility of planar data processing strategies can be considerably impacted by millimeter-sized displacements in transducer positioning. It is concluded that these measurement artifacts can be minimized by the use of VCEUS-based tumor blood flow estimators. Additionally, VCEUS imaging was shown to be a promising modality for monitoring changes in tissue perfusion. Overall, preliminary results are encouraging and VCEUS-based tumor vascularity mapping may prove clinically feasible for detecting and monitoring the early antitumor effects in response to cancer drug therapy.
Acknowledgments
The authors would like to thank Kris Dickie and Corina Leung from Ultrasonix Medical Corporation for their continued support of this research project. This work was supported by NCI Grants 5P50CA089019 and CA13148 to the UAB Comprehensive Cancer Center.
Contributor Information
Kenneth Hoyt, Departments of Radiology and Biomedical Engineering and the Comprehensive Cancer Center, University of Alabama at Birmingham, Birmingham, AL 35294 USA (hoyt@uab.edu).
Anna Sorace, Department of Biomedical Engineering, University of Alabama at Birmingham, Birmingham, AL 35294 (agsorace@uab.edu).
Reshu Saini, Department of Biomedical Engineering, University of Alabama at Birmingham, Birmingham, AL 35294 (rsaini@uab.edu).
References
- 1.Folkman J. What is the evidence that tumors are angiogenesis dependent? J Natl Cancer Inst. 1990;82:4–6. doi: 10.1093/jnci/82.1.4. [DOI] [PubMed] [Google Scholar]
- 2.Folkman J, D’Amore PA. Blood vessel fomration: what is the molecular basis? Cell. 1996;87:1153–1155. doi: 10.1016/s0092-8674(00)81810-3. [DOI] [PubMed] [Google Scholar]
- 3.Folkman J, Meerler E, Abernathy C, et al. Isolation of a tumor factor responsible for angiogenesis. J Exp Med. 1971;33:275–278. doi: 10.1084/jem.133.2.275. [DOI] [PMC free article] [PubMed] [Google Scholar]
- 4.Gasparini G, Harris AL. Clinical importance of the determination of tumor angiogenesis in breast carcinoma: much more than a new prognostic tool. J Clin Oncol. 1995;13:765–782. doi: 10.1200/JCO.1995.13.3.765. [DOI] [PubMed] [Google Scholar]
- 5.Schor AM, Schor SL. Tumor angiogenesis. J Pathol. 1983;141:385–413. doi: 10.1002/path.1711410315. [DOI] [PubMed] [Google Scholar]
- 6.Brawer MK, Bigler SA, Deering RE. Quantitative morphometric analysis of the microcirculation in prostate carcinoma. J Cell Bioch. 1992;16H:62–64. doi: 10.1002/jcb.240501213. [DOI] [PubMed] [Google Scholar]
- 7.Weidner N, Folkman J, Pozza F, et al. Tumor angiogenesis: a new significant and independent prognostic indicator in early-stage breast cancer. J Natl Cancer Inst. 1992;84:1875–1887. doi: 10.1093/jnci/84.24.1875. [DOI] [PubMed] [Google Scholar]
- 8.Weidner N, Semple JP, Welch WR. Tumor angiogenesis and metastasis - correlation in invasive breast carcinoma. N Engl J Med. 1991;324:1–8. doi: 10.1056/NEJM199101033240101. [DOI] [PubMed] [Google Scholar]
- 9.Weind KL, Maier CF, Rutt BK, et al. Invasive carcinoma and fibroadenomas of the breast: comparison of microvessel distributions - implications for imaging modalities. Radiology. 1998;208:477–483. doi: 10.1148/radiology.208.2.9680579. [DOI] [PubMed] [Google Scholar]
- 10.Hlatky L, Tsionou C, Hahnfeldt P, et al. Mammary fibroblasts may influence breast tumor angiogenesis via hypoxia-induced vascular endothelial growth factor up-regulation and protein expression. Cancer Res. 1994;54:6083–6086. [PubMed] [Google Scholar]
- 11.Holmgren L, O’Reilly MS, Folkman J. Dormancy of micrometastases: balanced proliferation and apoptosis in the presence of angiogenesis suppression. Ultrasound Med Biol. 2002;28:845–851. doi: 10.1038/nm0295-149. [DOI] [PubMed] [Google Scholar]
- 12.O’Reilly MS, Holmgren L, Shing Y, et al. Angiostatin: a novel angiogenesis inhibitor that mediates the suppression of metastases by a Lewis lung carcinoma. Cell. 1994;79:315–328. doi: 10.1016/0092-8674(94)90200-3. [DOI] [PubMed] [Google Scholar]
- 13.Jain RK. Barriers to drug delivery in solid tumors. Scientific American. 1994;271:58–65. doi: 10.1038/scientificamerican0794-58. [DOI] [PubMed] [Google Scholar]
- 14.de Jong N, Frinkling P, ten Cate F, et al. Characteristics of contrast agents and 2D imaging. IEEE Ultrasonics Sympos. 1996;1:1449–1458. [Google Scholar]
- 15.Hoyt K, Warram JM, Umphrey H, et al. Determination of breast cancer response to bevacizumab therapy using contrast-enhanced ultrasound and artificial neural networks. J Ultrsaound Med. 2010;29:577–585. doi: 10.7863/jum.2010.29.4.577. [DOI] [PMC free article] [PubMed] [Google Scholar]
- 16.Anderson CR, Hu X, Zhang H, et al. Ultrasound molecular imaging of tumor angiogenesis with an integrin targeted microbubble contrast agent. Invest Radiology. 2011;46:215–224. doi: 10.1097/RLI.0b013e3182034fed. [DOI] [PMC free article] [PubMed] [Google Scholar]
- 17.Forsberg F, Ro RJ, Fox TB, et al. Contrast enhanced maximium intensity projection ultrasound imaging for assessing angiogenesis in murine glioma and breast tumor models: a comparative study. Ultrasonics. 2011;51:382–389. doi: 10.1016/j.ultras.2010.11.004. [DOI] [PMC free article] [PubMed] [Google Scholar]
- 18.Kogan P, Johnson KA, Feingold S, et al. Validation of dynamic contrast-enhanced ultrasound in rodent kidneys as an absolute quantitative method for measuring blood perfusion. Ultrasound Med Biol. 2011;37:900–908. doi: 10.1016/j.ultrasmedbio.2011.03.011. [DOI] [PMC free article] [PubMed] [Google Scholar]
- 19.Pysz MA, Foygel K, Panje CM, et al. Assessment and monitoring tumor vascularity with contrast-enhanced ultrasound maximum intensity persistence imaging. Invest Radiology. 2011;46:187–195. doi: 10.1097/RLI.0b013e3181f9202d. [DOI] [PMC free article] [PubMed] [Google Scholar]
- 20.Watson KD, Hu X, Lai CY, et al. Novel ultrasound and DCE-MRI analyses after antiangiogenic treatment with a selective VEGF receptor inhibitor. Ultrasound Med Biol. 2011;37:909–921. doi: 10.1016/j.ultrasmedbio.2011.03.001. [DOI] [PMC free article] [PubMed] [Google Scholar]
- 21.Bhayana D, Kim TK, Jang HJ, et al. Hypervascular liver masses on contrast-enhanced ultrasound: the importance of washout. AJR Am J Roentgenol. 2010;194:977–983. doi: 10.2214/AJR.09.3375. [DOI] [PubMed] [Google Scholar]
- 22.Fleischer AC, Lyshchik A, Andreotti RF, et al. Advances in sonographic detection of ovarian cancer: depiction of tumor neovascularity with microbubbles. AJR Am J Roentgenol. 2010;194:343–348. doi: 10.2214/AJR.09.3446. [DOI] [PubMed] [Google Scholar]
- 23.Gauthier TP, Wasan HS, Muhammad A, et al. Assessment of global liver blood flow with quantitative dynamic contrast-enhanced ultrasound. J Ultrasound Med. 30:379–385. doi: 10.7863/jum.2011.30.3.379. [DOI] [PubMed] [Google Scholar]
- 24.Goetti R, Reiner CS, Knuth A, et al. Quantitative perfusion analysis of malignant liver tumors: dynamic computed tomography and contrast-enhanced ultrasound. Invest Radiology. 2011 Jul 22; doi: 10.1097/RLI.0b013e318229ff0d. [DOI] [PubMed] [Google Scholar]
- 25.Lassau N, Chami L, Chebil M, et al. Dynamic contrast-enhanced ultrasonography (DCE-US) and anti-angiogenic treatments. Discov Med. 2011;11:18–24. [PubMed] [Google Scholar]
- 26.Feingold S, Gessner R, Guracar IM, et al. Quantitative volumetric perfusion mapping of the microvasculature using contrast ultrsound. Invest Radiology. 2010;45:669–674. doi: 10.1097/RLI.0b013e3181ef0a78. [DOI] [PMC free article] [PubMed] [Google Scholar]
- 27.Hwang M, Hariri G, Lyshchik A, et al. Correlation of quantified contrast-enhanced sonography with in vivo tumor response. J Ultrasound Med. 2010;29:597–607. doi: 10.7863/jum.2010.29.4.597. [DOI] [PubMed] [Google Scholar]
- 28.Streeter JE, Gessner RC, Tsuruta J, et al. Assessment of molecular imaging of angiogenesis with three-dimensional ultrasonography. Mol Imaging. 2011 in press. [PMC free article] [PubMed] [Google Scholar]
- 29.Xu HX, Lu MD, Xie XH, et al. Three-dimensional contrast-enhanced ultrasound of the liver: experience of 92 cases. Ultrasonics. 2009;49:377–385. doi: 10.1016/j.ultras.2008.10.009. [DOI] [PubMed] [Google Scholar]
- 30.Luo H, Jiang YX, Liu JB, et al. Clinical utility of contrast-enhanced three-dimensional ultrasound imaging with Sonozoid: findings on hepatocellular carcinoma lesions. Eur J Radiology. 2009;72:425–431. doi: 10.1016/j.ejrad.2008.09.003. [DOI] [PubMed] [Google Scholar]
- 31.Leen E, Kumar S, Khan SA, et al. Contrast-enhanced 3D ultrasound in the radiofrequency ablation of liver tumors. World J Gastroenterol. 2009;15:289–299. doi: 10.3748/wjg.15.289. [DOI] [PMC free article] [PubMed] [Google Scholar]
- 32.Kim H, H KD, Folks L, Guo L, et al. DCE-MRI detects early vascular response in breast tumor xenografts following anti-DR5 therapy. Mol Imag Biol. 2011;13:94–103. doi: 10.1007/s11307-010-0320-2. [DOI] [PMC free article] [PubMed] [Google Scholar]
- 33.Ladak HM, Mao F, Wang Y. Prostate boundary segmentation from 2D ultrasound images. Med Phys. 2000;27:1777–1788. doi: 10.1118/1.1286722. [DOI] [PubMed] [Google Scholar]
- 34.Paltiel HJ, Padua HM, Gargollo PC, et al. Contrast-enhanced, real-time volumetric ultrasound imaging of tissue perfusion: Preliminary results in a rabbit model of testicular torsion. Phys Med Biol. 2011;56:2183–2197. doi: 10.1088/0031-9155/56/7/018. [DOI] [PMC free article] [PubMed] [Google Scholar]
- 35.Lucidarme O, Fanchi-Abella S, Correas JM, et al. Blood flow quantification with contrast-enhanced US: Entrance in the section phenomenon - phantom and rabbit study. Radiology. 2003;228:473–479. doi: 10.1148/radiol.2282020699. [DOI] [PubMed] [Google Scholar]
- 36.Abramoff MD, Magelhaes PJ, Ram SJ. Image processing with ImageJ. Biophotonics Int. 2004;11:36–42. [Google Scholar]
- 37.Forsberg F, Dicker AP, Thakur MN, et al. Comparing contrast-enhanced ultrasound to immunohistochemical markers of angiogenesis in a human melanoma xenograft model: preliminary results. Ultrasound Med Biol. 2002;28:445–451. doi: 10.1016/s0301-5629(02)00482-9. [DOI] [PubMed] [Google Scholar]
- 38.Chomas JE, Pollard RE, Sadlowski AR, et al. Contrast-enhanced US of microcirculation of superficially implanted tumors in rats. Radiology. 2003;229:439–446. doi: 10.1148/radiol.2292020536. [DOI] [PubMed] [Google Scholar]
- 39.McCarville MB, Streck CJ, Dickson PV, et al. Quantitative assessment of intratumoral blood flow with contrast-enhanced gray-scale US. Radiology. 2006;240:73–81. doi: 10.1148/radiol.2401050709. [DOI] [PubMed] [Google Scholar]
- 40.Pollard RE, Broumas AR, Wisner ER, et al. Quantitative contrast enhanced ultrasound and CT assessment of tumor response to antiangiogenic therapy in rats. Ultrasound Med Biol. 2007;33:235–245. doi: 10.1016/j.ultrasmedbio.2006.07.036. [DOI] [PubMed] [Google Scholar]
- 41.Kogan P, Johnson KA, Feingold S, et al. Validation of dynamic contrast-enhanced ultrasound in rodent kidneys as an absolute quantitative method for measuring blood perfusion. Ultrasound Med Biol. 2011;37:900–908. doi: 10.1016/j.ultrasmedbio.2011.03.011. [DOI] [PMC free article] [PubMed] [Google Scholar]