Abstract
CD and UV resonance Raman measurements surprisingly find that the charge screening of even 2 M concentrations of NaCl and KCl do not alter the unfolded PPII and 2.51-helix conformations of poly-L-glutamate. These salts appear to be excluded from the region between the side chain charges and the peptide backbone. Furthermore, no direct ion pairing occurs between these salts and the side chain carboxylates.
Keywords: poly-L-glutamate, PPII, 2.51-helix, salt exclusion, UV resonance Raman
1. Introduction
The conformations of peptides and proteins depend upon their solution compositions, especially upon the presence of species that specifically interact with the peptides or proteins, or the water solvent.1–3 In the work here we investigate the dependence of peptide conformation on the presence of salts. Previous studies appear to have demonstrated that ions can interact with peptides and proteins by binding, for example, to form ion pairs.4–6 Alternatively the impact of ions can be less specific, as when they passively screen sidechain electrostatic interactions.7 Another mechanism that can impact conformation occurs in the classical Hofmeister series of protein salting in or salting out, that is explained by the impact of ions on the water solvent properties that control aqueous solution protein/peptide hydration.8
In this work, we used circular dichroism (CD) and UV resonance Raman spectroscopy (UVRR) to investigate the impact of Na+ and K+ on the conformation of poly-L-glutamate (PGA). Surprisingly, we observe a lack of pertubation by high concentrations of Na+ and K+ on the conformation of poly-L-glutamate. We find that PGA is not converted to the α-helix conformation at high NaCl and KCl concentrations, and further that the equilibrium between PPII and 2.51-helix conformations of PGA is not altered by the presence of 2 M salts.
2. Results and Discussion
2.1 CD results
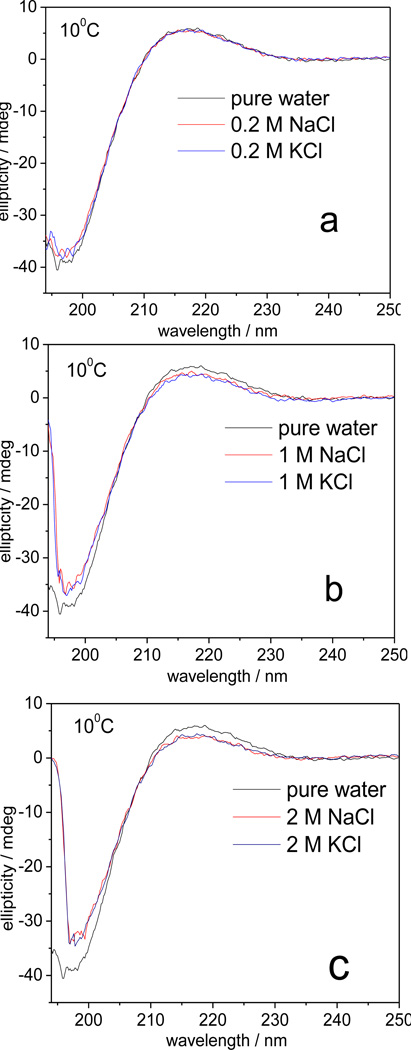
The CD spectrum of PGA in pure water at 10 °C (black, Fig. 1) shows a positive band at ~217 nm and a strong negative band at ~197 nm, characteristic of PPII-like conformations.9, 10 The 0.2 M NaCl or KCl solution spectra are essentially identical to that in pure water. In 1.0 M NaCl or KCl, the positive band slightly decreases in amplitude while the trough becomes less negative, indicating only a slight destabilization of the PPII-like conformation.10 The PPII-like features slightly further decrease in 2.0 M salt solutions; the NaCl and KCl CD spectra remain identical. These results are consistent with Lizuka et al 11 and Wada’s 12 experimental investigations.
Figure 1.
CD spectra of 1 mg/ml PGA in pure water and in a) 0.2 M, b) 1.0 M and c) 2 M NaCl and KCl at pH 8.3 at 10 °C.
We calculated the salt induced fractional α-helical concentration, fα, by using a two-state model (eq 1) by utilizing the reported θ223 value for the pure α-helix of PGA ([θ]α = −35400 deg.cm2.dmol−1 13) and our measured value for PGA in pure water where unfolded conformations dominate 14 ([θ]unfold = 3250 deg.cm2.dmol−1). The calculated α-helical concentration increases in 1 M and 2 M salts are 0.02 ± 0.01 and 0.04 ± 0.01, respectively. This clearly indicates the negligible α-helical concentration change.
| eqn1 |
The CD spectra measured at 30 °C and 50 °C (See Fig. S1–2) also indicate that similar high NaCl or KCl concentration do not significantly alter the PGA conformational equilibrium.
2.2 UVRR results
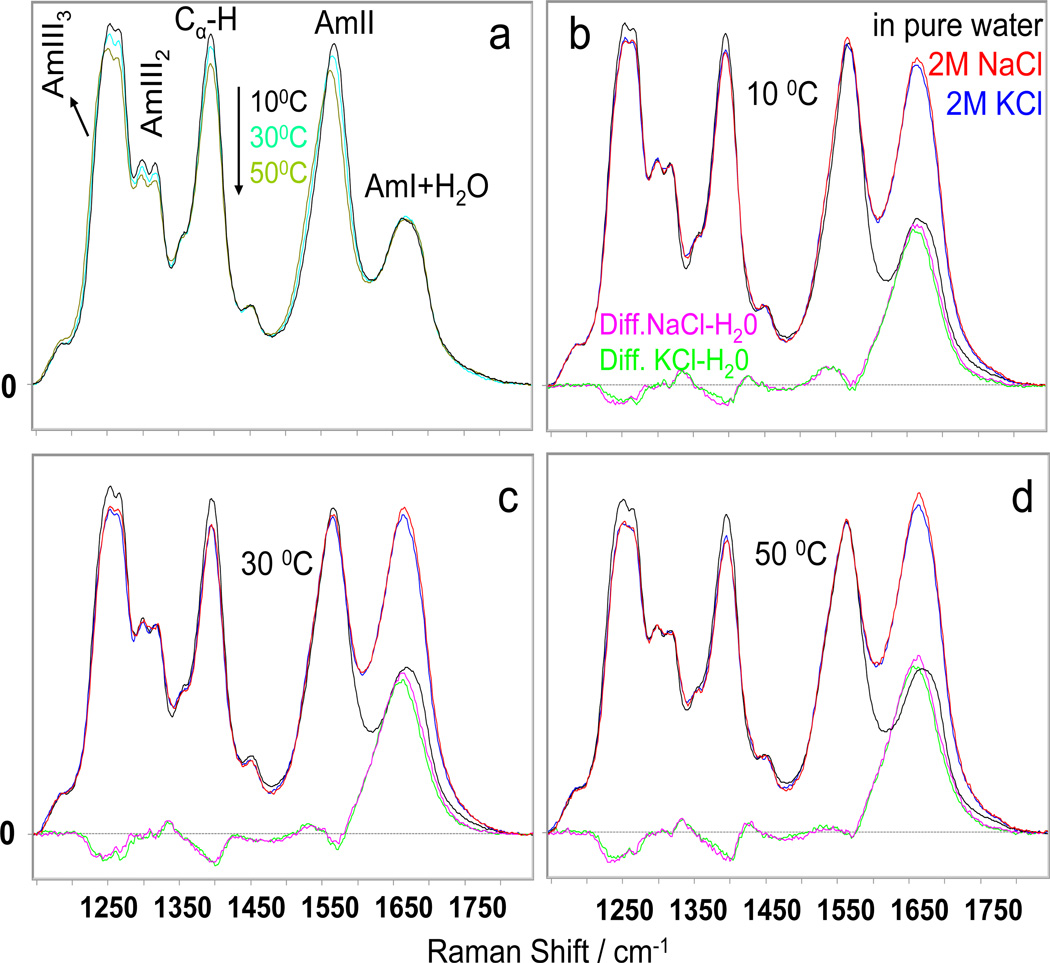
The UVRR of PGA in pure water (Fig. 2a) show an AmI band at ~1667 cm−1 (mainly CO s), an AmII band at ~1568 cm−1 (mainly out of phase combination of CN s and NH b), and (C)Cα-H bending bands at ~1395 cm−1. The AmIII region which mainly involves an in phase combination of CN s and NH b occurs between ~1200 cm−1 and ~1340 cm−1. The AmIII region contains an AmIII2 band doublet at ~1298 cm−1 and ~1317 cm−1, and an AmIII3 band doublet at ~1247 cm−1 and ~1269 cm−1. The AmIII3 band at ~1247 cm−1 derives from a PPII-like conformation, while the AmIII3 band at ~1269 cm−1 derives from a 2.51-helix conformation. 14
Figure 2.
a) Temperature dependence of 204 nm excited UVRS of 1 mg/ml PGA in pure water. UVRS of PGA in pure water and in the presence of 2 M NaCl and KCl and their difference spectra: b) at 10 °C; c) at 30 °C; d) at 50 °C; All spectra were normalized to the 1450 cm−1 band which shows little intensity variation. 14
In 2 M NaCl and KCl, the Cα-H intensity slightly decreases compared to pure water, indicating a small α-helix content increase.15 Also, the AmIII3 region intensity slightly decreases.1, 16 Surprisingly, the relative intensity of PPII to 2.51-helix bands does not change, even though the 2.51-helix conformation is stabilized by electrostatic repulsion between side chains.14, 17 The intensity in the AmI region increases dramatically because of a surprising increase in the Raman cross section of the underlying ~1660 cm−1 water O-H bending band due to the presence of a Cl− → water charge transfer band.18–20
To calculate the magnitude of the salt induced α-helical conformation concentration increase, we subtracted the UVRR of PGA in pure water (where it exists in a PPII-like and 2.51-helix conformation equilibrium 14) from that of PGA in 2 M NaCl and KCl such that the Cα-H b intensity was minimized in the UVRR difference spectrum. The resulting PGA pure water UVRR intensities subtracted are directly proportional to the concentration of the PPII-like and 2.51-helix conformations at each temperature. From the difference spectra we can calculate a fractional α-helical concentration increase of 0.08 ± 0.03 and 0.07 ± 0.03 for 2 M NaCl and KCl, respectively. Thus, neither NaCl nor KCl induces much PGA α-helix formation.
NaCl and KCl occur in the middle of Hofmeister series, indicating that NaCl and KCl should have intermediate effects on the dehydration of PGA.8 Collins et al.’s model of matching water affinities 4–6, that predicts that preferential ion pair formation occurs between oppositely charged ions of similar charge densities, predicts that the penultimate carboxylate would preferentially ion pair with Na+ compared to K+.5 This is supported by recent experimental and theoretical studies showing that −COO− groups preferentially pair with Na+. 21–25
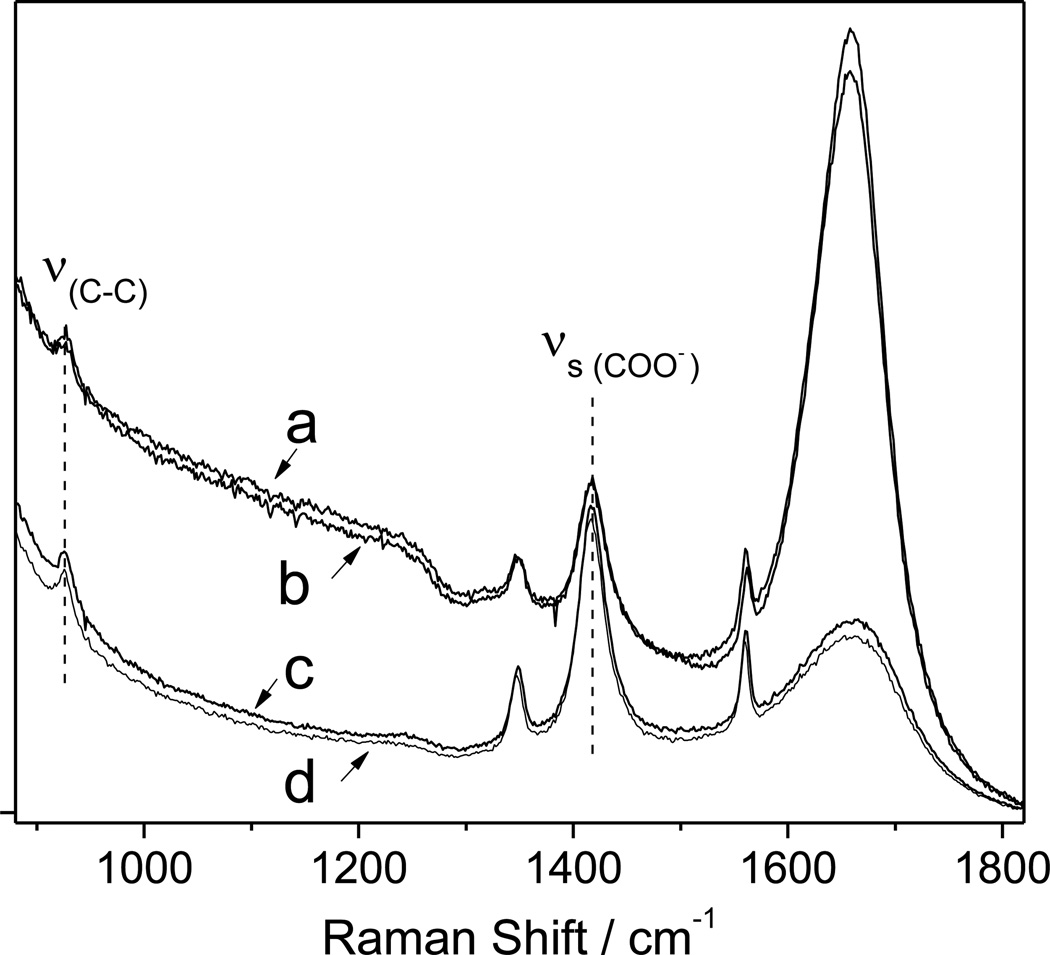
We measured the UVRR of Na+ (K+) acetate in the presence of 4 M NaCl (KCl). Previous studies indicate that ion binding to the −COO− groups significantly shifts the carboxylate symmetric stretching band, νs (COO−) and the C-C stretching band, ν (C-C) to higher frequencies.26, 27 The νs (COO−) and ν (C-C) band frequencies do not change (Fig. 3) in 4 M Na+ and 4 M K+, indicating that neither Na+ nor K+ directly binds to the COO− groups.
Figure 3.
204 nm excited UVRS of sodium acetate (NaAc) and potassium acetate (KAc) and in the presence of 4 M NaCl and 4 M KCl at 10 °C: a) 0.02 M NaAc + 4 M NaCl; b) 0.02 M KAc + 4 M KCl; c) 0.02 M KAc; d) 0.02 M NaAc.
Electrostatic repulsion between glu side chains is responsible for the formation of the 2.51-helix conformation because it minimizes the repulsion between its splayed side chains.14, 17 Surprisingly we observe a lack of a NaCl or KCl dependence of the PPII and 2.51-helix PGA conformational equilibrium. We expected that high salt concentrations would decrease the electrostatic repulsion between glu side chains. We can estimate the electrostatic repulsion decrease induced by salt screening from eq 2:
| eqn2 |
where ψ(l) is the electrostatic potential at distance l in presence of salt screening; ψ0 is the electrostatic potential with no screening; εw is the dielectric constant of pure water (εw=83 28); εr is the dielectric constant of salt solutions (εr in 0.2 M, 1.0 M and 2.0 M NaCl and KCl solutions are 80, 70 and 60, respectively.28, 29); κ−1 is the Debye length which is defined by eq 3 7:
| eqn 3 |
where ε0 is the permittivity of free space (ε0= 8.854× 10⁻¹² C2·N−1·m−2 ); kB is the Boltzmann constant (kB=1.380 ×10⁻²³ N·m·K−1); T is the absolute temperature (T=283.15 K); NA is the the Avogadro number (NA= 6.022×10²³ mol−1); e is the elementary charge (e= 1.602×10⁻¹⁹ C); I is the ionic strength of the salt solutions. The Debye lengths, κ−1 in 0.2 M, 1.0 M and 2.0 M NaCl and KCl solutions are ~6.8 Å, 2.8 Å and 1.9 Å, while the distances between neighboring glu sidechain charges are 8.3 Å and 8.4 Å for the PPII and 2.51-helix conformations, respectively.14 We estimate that the glu sidechain electrostatic repulsion should decrease by more than 50-fold at 2 M salt relative to that in pure water.
We naively expected that this change in electrostatic interactions should alter the equilibrium between the PPII and 2.51-helix conformations. The fact that this does not occur suggests that the ions are excluded from the region between side chains. This would also explain why the 2.5 M NaCl does not alter the PPII and 2.51-helix conformational equilibrium in polylys.30 It should be noted that our experimental results contradict the recent molecular dynamics simulation studies that indicate that Na+ controls peptide conformations by binding to carboxylate side chain. 31, 32
3. Conclusion
We used circular dichroism and UV resonance Raman spectroscopy, to study the impact of screening of NaCl and KCl on the conformational equilibria of poly-L-glutamate. In contradiction to expectations, we observe a lack of impact of high concentrations of NaCl and KCl on the conformation of poly-L-glutamate. These salts appear to be excluded from the region between the side chain charges and the peptide backbone. Furthermore, we see no evidence of formation of ion pairs between Na+ and K+ salts and the side chain carboxylates.
4. Experimental Methods
Samples
PGA (MWvis=11600, MWmALLS=6649) was purchased from Sigma Chemical. Peptide samples were prepared at 1 mg/ml concentrations by dissolving PGA in pure water or 2 M salt, and adjusted to pH 8.3. Sodium acetate (>99% purity) was purchased from EM Science; potassium acetate (>99% purity) was purchased from Sigma.
CD Spectra
CD spectra were measured for poly-L-glutamate by using a Jasco-715 spectropolarimeter with a 0.02 cm path length cuvette. We collected CD spectra from 250 – 190 nm. We utilized 3-min accumulation times and five accumulations were averaged.
UVRR Spectra
The UVRR apparatus has been described in detail by Bykov et al.33 Briefly, 204 nm UV light (2 mW average power, 100 µm diameter spot, 25–40 ns pulse width) was obtained by mixing the 3rd harmonic with the 816 nm fundamental of a 1 kHz repetition rate tunable Ti:Sapphire laser system (DM20-527 TU-L-FHG) from Photonics Industries. The sample was circulated in a free surface, temperature-controlled stream. A 165° sampling backscattering geometry was used. The collected light was dispersed by a double monochromator onto a back thinned CCD camera with a Lumogen E coating (Princeton Instruments-Spec 10 System). We utilized 5-min accumulation times, and four accumulations were averaged.
Supplementary Material
Acknowledgements
We thank Prof. Jeffry Madura and Dr. Sergei V. Bykov for useful discussions. This work was supported by NIH grant 1RO1EB009089.
Footnotes
Publisher's Disclaimer: This is a PDF file of an unedited manuscript that has been accepted for publication. As a service to our customers we are providing this early version of the manuscript. The manuscript will undergo copyediting, typesetting, and review of the resulting proof before it is published in its final citable form. Please note that during the production process errors may be discovered which could affect the content, and all legal disclaimers that apply to the journal pertain.
Supporting Information
CD spectra at various temperatures: Figures S1 and S2.
References
- 1.Xiong K, Asciutto EK, Madura JD, Asher SA. Salt Dependence of α-helical Peptide Folding Energy Landscapes. Biochemistry. 2009;48:10818–10826. doi: 10.1021/bi9014709. [DOI] [PMC free article] [PubMed] [Google Scholar]
- 2.Cacace MG, Landau EM, Ramsden JJ. The Hofmeister series: salt and solvent effects on interfacial phenomena. Q. Rev. Biophys. 1997;30(3):241–277. doi: 10.1017/s0033583597003363. [DOI] [PubMed] [Google Scholar]
- 3.Thomas AS, Elcock AH. Molecular dynamics simulations of hydrophobic associations in aqueous salt solutions indicate a connection between water hydrogen bonding and the Hofmeister effect. J Am. Chem. Soc. 2007;129(48):14887–14898. doi: 10.1021/ja073097z. [DOI] [PubMed] [Google Scholar]
- 4.Collins KD. Charge density-dependent strength of hydration and biological structure. Biophys. J. 1997;72(1):65–76. doi: 10.1016/S0006-3495(97)78647-8. [DOI] [PMC free article] [PubMed] [Google Scholar]
- 5.Collins KD. Ions from the Hofmeister series and osmolytes: effects on proteins in solution and in the crystallization process. Methods. 2004;34(3):300–311. doi: 10.1016/j.ymeth.2004.03.021. [DOI] [PubMed] [Google Scholar]
- 6.Collins KD, Neilson GW, Enderby JE. Ions in water: Characterizing the forces that control chemical processes and biological structure. Biophys Chem. 2007;128(2–3):95–104. doi: 10.1016/j.bpc.2007.03.009. [DOI] [PubMed] [Google Scholar]
- 7.Debye P, Huckel E. Phys. Z. 1923;24:185–206. [Google Scholar]
- 8.Collins KD, Washabaugh MW. The Hofemister effect and the behavior of water at interfaces. Q. Rev. Biophys. 1985;18:323–422. doi: 10.1017/s0033583500005369. [DOI] [PubMed] [Google Scholar]
- 9.Sreerama N, Woody RW. Poly(Pro)Ii Helices in Globular-Proteins - Identification and Circular Dichroic Analysis. Biochemistry. 1994;33(33):10022–10025. doi: 10.1021/bi00199a028. [DOI] [PubMed] [Google Scholar]
- 10.Shi ZS, Chen K, Liu ZG, Kallenbach NR. Conformation of the backbone in unfolded proteins. Chem. Rev. 2006;106(5):1877–1897. doi: 10.1021/cr040433a. [DOI] [PubMed] [Google Scholar]
- 11.Iizuka E, Yang JT. Effect of Salts and Dioxane on the coiled conformation of Poly-L-glutamic Acid in Aqueous Solution. Biochemistry. 1965;4:1249–1257. [Google Scholar]
- 12.Wada A. Helix-Coil transformation and titration curve of poly-L-glutamic acid. Mol. Phys. 1960;3:409–416. [Google Scholar]
- 13.Yamaoka K, Masujima T. Macromolecule-Metal Ion Complexes .4. Visible-Uv Absorption and Circular-Dichroism Studies of Poly(Alpha-L-Glutamic Acid)-Copper(Ii) Complexes with Emphasis on the Extrinsic Cotton Effect. Bull. Chem. Soc. Jap. 1979;52(5):1286–1296. [Google Scholar]
- 14.Mikhonin AV, Myshakina NS, Bykov SV, Asher SA. UV resonance Raman determination of polyproline II, extended 2.5(1)-helix, and beta-sheet psi angle energy landscape in poly-L-lysine and poly-L-glutamic acid. J Am. Chem. Soc. 2005;127(21):7712–7720. doi: 10.1021/ja044636s. [DOI] [PubMed] [Google Scholar]
- 15.Wang Y, Purrello R, Jordan T, Spiro TG. Uvrr Spectroscopy of the Peptide-Bond .1. Amide-S, a Nonhelical Structure Marker, Is a C-Alpha-H Bending Mode. J Am. Chem. Soc. 1991;113(17):6359–6368. [Google Scholar]
- 16.Sharma B, Bykov SV, Asher SA. UV resonance Raman investigation of electronic transitions in alpha-helical and polyproline II-like conformations. J Phys. Chem. B. 2008;112(37):11762–11769. doi: 10.1021/jp801110q. [DOI] [PMC free article] [PubMed] [Google Scholar]
- 17.Krimm S, Mark JE. Conformations of polypeptides with ionized side chains of equal length. Proc. Natl. Acad. Sci. U.S.A. 1968;60:1122–1129. doi: 10.1073/pnas.60.4.1122. [DOI] [PMC free article] [PubMed] [Google Scholar]
- 18.Schultz JW, Hornig DF. The effect of dissolved alkali halides on the raman spectra of water. J. Phys. Chem. 1961;65:2131–2138. [Google Scholar]
- 19.Wall TT, Hornig DF. Raman spectra of water in concentrated ionic solutions. J. Chem. Phys. 1967;47:784–792. [Google Scholar]
- 20.Xiong K, Asher SA. Lowest Energy Electronic Transition in Aqueous Cl− Salts: Cl− to (H2O)6 Charge Transfer Transition. J. Phys. Chem. A. 2010 doi: 10.1021/jp1085729. [DOI] [PMC free article] [PubMed] [Google Scholar]
- 21.Aziz EF, Ottosson N, Eisebitt S, Eberhardt W, Jagoda-Cwiklik B, Vacha R, Jungwirth P, Winter B. Cation-specific interactions with carboxylate in amino acid and acetate aqueous solutions: X-ray absorption and ab initio calculations. J Phys. Chem. B. 2008;112(40):12567–12570. doi: 10.1021/jp805177v. [DOI] [PubMed] [Google Scholar]
- 22.Jagoda-Cwiklik B, Vacha R, Lund M, Srebro M, Jungwirth P. Ion pairing as a possible clue for discriminating between sodium and potassium in biological and other complex environments. J Phys. Chem. B. 2007;111(51):14077–14079. doi: 10.1021/jp709634t. [DOI] [PubMed] [Google Scholar]
- 23.Vrbka L, Vondrasek J, Jagoda-Cwiklik B, Vacha R, Jungwirth P. Quantification and rationalization of the higher affinity of sodium over potassium to protein surfaces. Proc. Natl. Acad. Sci. U.S.A. 2006;103(42):15440–15444. doi: 10.1073/pnas.0606959103. [DOI] [PMC free article] [PubMed] [Google Scholar]
- 24.Dzubiella J. Salt-specific stability and denaturation of a short salt-bridge-forming alpha-helix. J Am. Chem. Soc. 2008;130(42):14000–14007. doi: 10.1021/ja805562g. [DOI] [PubMed] [Google Scholar]
- 25.von Hansen Y, Kalcher I, Dzubiella J. Ion Specificity in alpha-Helical Folding Kinetics. J Phys. Chem. B. 2010;114(43):13815–13822. doi: 10.1021/jp107495f. [DOI] [PubMed] [Google Scholar]
- 26.Quiles F, Burneau A. Infrared and Raman spectra of alkaline-earth and copper(II) acetates in aqueous solutions. Vibr. Spectros. 1998;16(2):105–117. [Google Scholar]
- 27.Tackett JE. FT-IR Characterization of Metal Acetates in Aqueous Solution. Appl. Spectros. 1989;43:483–489. [Google Scholar]
- 28.Buchner R, Hefter GT, May PM. Dielectric relaxation of aqueous NaCl solutions. J Phys. Chem. A. 1999;103(1):1–9. [Google Scholar]
- 29.Lyashchenko A, Lileev A. Dielectric Relaxation of Water in Hydration Shells of Ions. J Chem. Eng. Data. 2010;55(5):2008–2016. [Google Scholar]
- 30.Ma L, Ahmed Z, Asher SA. Ultraviolet Resonance Raman Study of Side Chain Electrostatic Control of Poly-L-Lysine Conformation. J Phys. Chem. B. 2011;115(14):4251–4258. doi: 10.1021/jp2005343. [DOI] [PMC free article] [PubMed] [Google Scholar]
- 31.Fedorov MV, Goodman JM, Schumm S. To Switch or Not To Switch: The Effects of Potassium and Sodium Ions on alpha-Poly-L-glutamate Conformations in Aqueous Solutions. J Am. Chem. Soc. 2009;131(31):10854–10856. doi: 10.1021/ja9030374. [DOI] [PubMed] [Google Scholar]
- 32.Fedorov MV, Goodman JM, Schumm S. The effect of sodium chloride on poly-L-glutamate conformation. Chem. Comm. 2009;(8):896–898. doi: 10.1039/b816055d. [DOI] [PubMed] [Google Scholar]
- 33.Bykov S, Lednev I, Ianoul A, Mikhonin A, Munro C, Asher SA. Steady-state and transient ultraviolet resonance Raman spectrometer for the 193–270 nm spectral region. Appl. Spectros. 2005;59(12):1541–1552. doi: 10.1366/000370205775142511. [DOI] [PubMed] [Google Scholar]
Associated Data
This section collects any data citations, data availability statements, or supplementary materials included in this article.


