Abstract
Fatigue caused by sustaining submaximal-intensity muscle contraction(s) involves increased activation in the brain such as primary motor cortex (M1), primary sensory cortex (S1), Premotor and supplementary motor area (PM&SMA) and prefrontal cortex (PFC). The synchronized increases in activation level in these cortical areas suggest fatigue-related strengthening of functional coupling within the motor control network. In the present study, this hypothesis was tested using the cross-correlation based functional connectivity (FC) analysis method. Ten subjects performed a 20-minute intermittent (3.5s ON/6.5s OFF, 120 trials total) handgrip task using the right hand at 50% maximal voluntary contraction (MVC) force level while their brain was scanned by a 3T Siemens Trio scanner using echo planar imaging (EPI) sequence. A representative signal time course of the left M1 was extracted by averaging the time course data of a 2-mm cluster of neighboring voxels of local maximal activation foci, which was identified by a general linear model. Two FC activation maps were created for each subject by cross-correlating the time course data of the minimal (the first 10 trials) and significant (the last 10 trials) fatigue stages across all the voxels in the brain to the corresponding representative time course. Histogram and quantile regression analysis were used to compare the FC between the minimal and significant fatigue stages and the results showed a significant increase in FC among multiple cortical regions, including right M1 and bilateral PM&SMA, S1 and PFC. This strengthened FC indicates that when muscle fatigue worsens, many brain regions increase their coupling with the left M1, the primary motor output control center for the right handgrip, to compensate for diminished force generating capability of the muscle in a coordinated fashion by enhancing the descending command for greater muscle recruitment to maintain the same force.
Keywords: muscle fatigue, functional connectivity, fMRI, quantile regression, motor control network
Introduction
Recent functional magnetic resonance imaging (fMRI) studies of human brain during voluntary muscle fatigue at submaximal intensity levels have shown increased brain activity in areas such as primary sensory cortex (S1); primary motor cortex (M1); premotor cortex and supplementary motor area (PM&SMA); and prefrontal cortex (PFC) (Benwell et al., 2007; Liu et al., 2003; van Duinen et al., 2007). These findings may reflect an increased voluntary drive from the cortical centers to spinal alpha motor neurons controlling the working muscles to maintain the target force as fatigue develops. Due to the substantial stress and voluntary effort involved in the fatigue process, especially when the fatigue becomes significant, the cortical modulation may involve all levels of motor control hierarchy, i.e., the primary, secondary and association motor cortices. However, how the various levels of motor control centers interact with each other during voluntary muscle fatigue remains unclear.
Traditional fatigue-related fMRI studies employ univariate statistical methods to identify and characterize functionally segregated or specialized brain regions associated with muscle fatigue. This mapping approach usually addresses issues such as what part of brain is active (compared to a baseline condition) during fatigue. A follow up analysis often examines the magnitude of the brain activation in a set of brain regions revealed in the activation study. Parameters such as the intensity of the BOLD fMRI signals (Benwell et al., 2007) and the size of the activation (number of activated pixels (Liu et al., 2002) or number of activated voxels (Benwell et al., 2005)) of regions of interests are usually assessed to investigate fatigue or time effect on brain activation. Information such as interregional relationship cannot be obtained from such analysis. Thus, in order to reveal the dynamics of brain network, a statistics approach in the context of network is more appropriate.
Functional connectivity (FC) analysis, a method to measure the magnitude of functional coupling between brain regions, has recently gained many interests in human brain mapping studies (Baudrexel et al., 2011; Liu et al., 2008; Mayer et al., 2011; Werner et al., 2011). Although almost any measures of brain activity can be used to study FC (Rykhlevskaia et al., 2008), fMRI data are better suited for FC analysis because they provide both high spatial and reasonable temporal resolution, especially for submaximal-intensity muscle fatigue tasks that usually last for minutes. A common approach to measure FC of the brain is based on cross-correlation of activation time course of a cortical region with the time course of a reference ROI. This cross-correlation based FC analysis has been successfully applied to studies in reward processing (Camara et al., 2008), phrase formation (Schafer and Constable, 2009), and language and sleep (Liu et al., 2008).
There has been evidence (Peltier et al., 2005) showing diminished FC between interhemispheric M1s during resting state after a submaximal fatiguing motor task. A recent study by our group (Yang et al., 2009) investigated the FC between cortical and muscular signals during muscle fatigue and found a fatigue-related FC reduction between the two signals. No studies, however, has assessed the FC among the cortical motor control regions during muscle fatigue. Given the fact that activities in many cortical fields change significantly with fatigue over time during a fatigue motor task at a submaximal intensity level (Benwell et al., 2007; Liu et al., 2003; van Duinen et al., 2007), we hypothesized that the FC among the participating brain regions would increase with fatigue to compensate for the loss of force production capability in the muscle by synchronizing activities of the regions so that a stronger descending command is made to increase muscle activation. The aim of this study was to determine the level of FC over time between the contralateral M1 to the fatiguing muscles and other primary, secondary and association motor areas participating in a prolonged submaximal motor task.
Material and Methods
Subjects
Ten healthy, right-handed subjects without any neurological or psychiatric disorders and current medications were recruited in the study (10 male, age =32.8±8.4 years old). The subjects’ handiness was determined by the Edinburgh inventory (Oldfield, 1971). All subjects gave written consents of participation prior to the experiment. All procedures were approved by the Institutional Review Board at the Cleveland Clinic.
Fatigue motor task
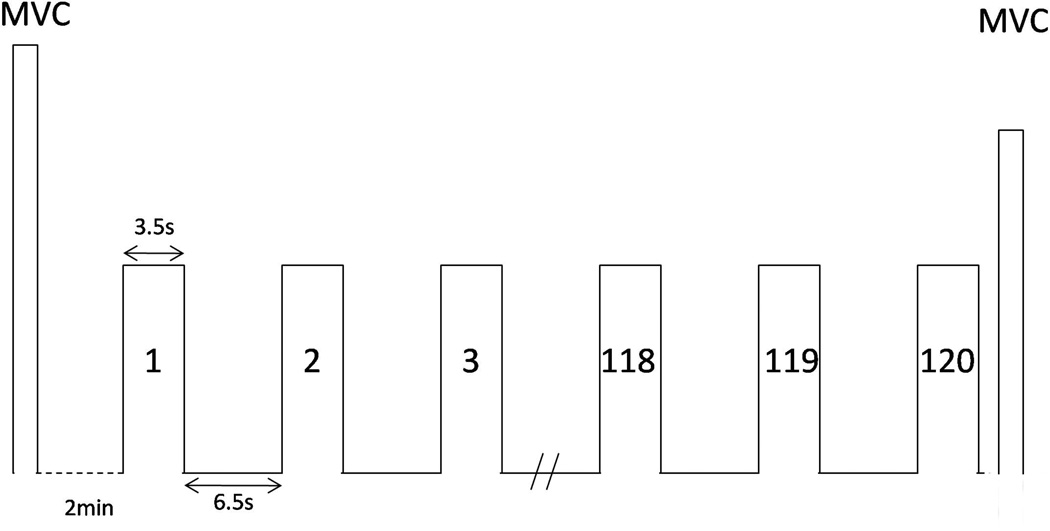
All subjects performed intermittent handgrip contractions at 50% maximal voluntary contraction (MVC) force level using the right hand while their brains were scanned (see Fig. 1 for the task paradigm). Handgrip force was measured using a pressure transducer housed in a hydraulic environment (Liu et al., 2000). The handgrip MVC force was measured prior to the fMRI session and was used to determine the submaximal force for the fatigue task. Visual cues projecting onto the monitor screen hung above the subject’s eyes were used to give subjects visual feedback to perform the force trials. On the screen, the exerted force and target (a horizontal cursor representing 50% MVC force) were displayed to guide the subject for accurate performance. The duration of each contraction was 3.5s followed by a 6.5s inter-trial interval in an alternating ON and OFF fashion. The reason of choosing a target force of 50% MVC with trial duration of 3.5s ON and 6.5s OFF is to fatigue the muscles in a reasonable time frame with adequate time (6.5s) for the BOLD signal to return to the baseline before starting the next force trial. The entire motor fatigue task lasted 20 minutes and each subject completed a total of 120 trials of contractions. The MVC handgrip force was measured again right upon each subject’s completion of the task.
Fig. 1.
Schematic illustration of the fatigue motor task paradigm. Maximal voluntary contraction (MVC) force was determined before the MRI scan session. After resting for 2 minutes, subjects performed intermittent handgrip contractions at 50% MVC level during which the fMRI data were collected. Duration of each contraction was 3.5 s followed by a 6.5 s rest. Subjects performed another MVC immediately after the last (120th) contraction to determine the level of muscle fatigue.
Image acquisition
All images were acquired using a 3T Siemens Trio scanner (Siemens, Germany). Subjects were instructed to lie in a supine position and to remain still during the entire scanning session to reduce potential head motion. In addition, foam pads were placed between the head and side frame of the head coil to restraint the head from moving. Functional images were acquired using a T2* weighted gradient-echo, EPI sequence. Each brain volume consisted 30 slices (slice thickness=4mm) with an in-plane resolution of 3.44×3.44mm2. Pulse sequence parameters were: repetition time (TR) = 2000ms, echo time (TE) = 30ms, flip angle (FA) =50°. A total of 600 volumes of images were collected during the 20-minute execution of the motor task completed by each subject. T1 weighted images were also acquired after the functional image collection. The parameters for the T1 weighted images were: TR/TE/FOV = 2600ms/3.93ms/256mm, respectively.
Preprocessing of fMRI data
Brainvoyager QX 1.7 (Brain Innovation, http://www.BrainVoyager.com) was used to preprocess and analyze the functional imaging data. Slice time correction was applied first to all subjects’ data to correct the time delay of scanning between slices within a TR. Motion correction was then applied and six parameters (three translation parameters in x, y and z directions and three rotation parameters in x, y and z directions) were estimated for every subject. Three subjects data were excluded from the analysis due to excessive head motion (any of the translational parameters >2mm or rotational parameters >2° were considered excessive head motion). Any potential signal drifting was removed by linear trend removal. Low-frequency nonlinear drifts of 3 or fewer cycles (0.0025 Hz) per time course was removed by temporal high-pass filtering.
The anatomical images of each subject were normalized into the Talairach standard space first to enable group comparison. Then functional slice time course (STC) data were registered to the corresponding 3D anatomical volume data in Talairach standard space resulting in functional volume time courses (VTCs).
Motor task mapping
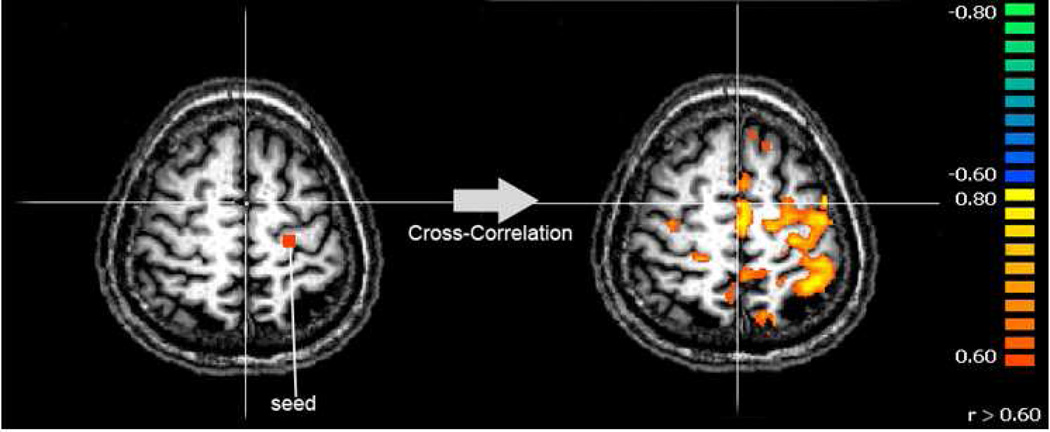
A box car (3.5ON/6.5sOFF) convolved with the canonical haemodynamic response function (HRF) was used as the regressor to detect brain activation during the motor task. Based on the mapping data, participating ROIs in the motor task were identified and FC analysis between a seed/reference ROI and each of other major ROIs showing strong activation was performed (see Fig. 2).
Fig. 2.
Illustration of the FC analysis with the seed area (in left M1) showing as the red square. fMRI time-course data of all voxels in the 3D brain were cross-correlated with the seed area time-course signal. The color bar shows the cross-correlation coefficient values (threshold at 0.60).
FC analysis
The left M1 (Brodmann area 4, BA4) was chosen as the reference region for the FC analysis. Output neurons in the left M1 project to alpha motoneurons in the spinal cord that control muscles of the right extremities. Voxels/ROIs located outside of the left M1 that show highly correlated activity with the left M1 were considered to be part of the motor network and involved in controlling the submaximal handgrip task. Standard BA labeling templates provided in Brainvoyager were used to identify selected ROIs. The PFC used in this analysis consisted of BA 8, 9, 10, 11 and 46.
A reference VTC was extracted by first finding the activation maximum (seed point) in the left M1 and then averaging the voxels’ VTCs in the neighboring 2-mm volume (resulting in a total of 64 voxels). Since subjects did not start the motor task at the same volume after the beginning of the scan, the VTC was realigned based on the actual starting volume and the remaining data that trailed after the 550th volume were discarded to make sure every subject had a same number of image volumes. Thus, each subject’s functional data consisted of 550 volumes of VTC data. To determine the strength of the FC among the brain regions with prominent activation, we cross-correlated the VTCs of all activated voxels (determined by the mapping analysis) in the regions to the reference (seed) VTC (mean time course from the 2mm sphere around the seed voxel). Five lags (1 lag=2s) were used to capture any time shifted correlation of VTCs relative to the seed region. Note that a forward shift of 1 lag is equivalent to a backward shift of 4 lags (1 cycle=5 lags in the motor task). Temporal lags were used to relax the definition of correlation so correlation coefficients of those voxels strongly functionally correlated to the left M1 but have similar time courses to time-shifted VTC of the left M1 (as if these regions are lagging behind) can be correctly computed. Up to 5 lags (10s) was allowed to avoid any confounds considering our task having a cycle of 10s. Fig. 2 illustrates how the FC analysis was performed.
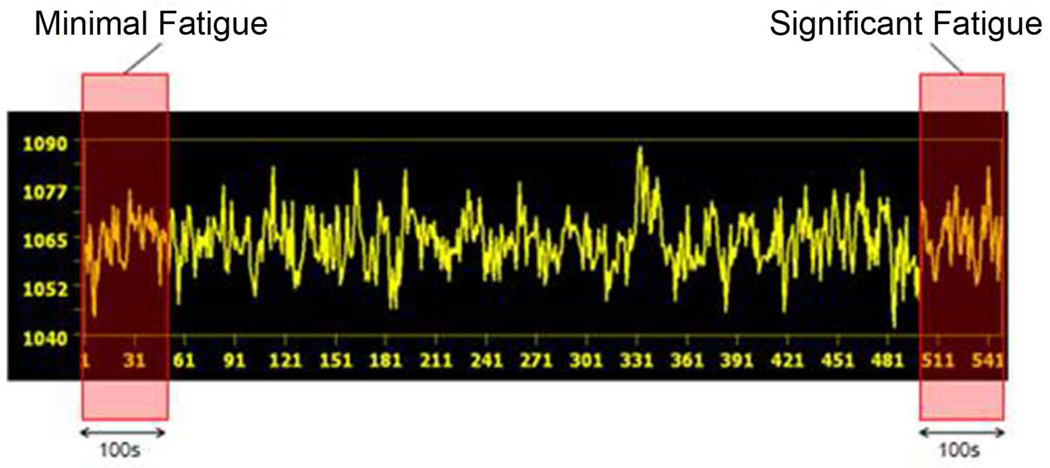
To learn the effect of muscle fatigue on FC, the VTC FC of the first 50 volume data (the first 100s during which subjects experienced minimal fatigue) and the VTC FC of the last 50 volume data (the last 100s, during which subject experienced significant fatigue; see Fig. 3 for illustration) were analyzed for selected ROIs. Once the cross-correlation analysis was completed, a histogram analysis was performed to visualize the distribution of the correlation coefficients. Subsequently both standard analysis of variance (ANOVA) and quantile regression analysis were performed to compare the magnitude of the FC between the minimal and sever fatigue conditions for the ROIs.
Fig. 3.
Illustration of the minimal fatigue stage (left pink box) and significant fatigue stage (right pink box) overlaid on sample volume time course (VTC) data of a voxel in the left M1 of a subject. The X axis shows fMRI scan numbers and Y axis shows intensity of fMRI BOLD signal.
Quantile regression is a novel statistic tool for analyzing relationship between certain quantile of a response variable and predictor variable. The classic ordinary least squares regression analysis is to obtain a summary of the relationship between a response variable Y and a set of covariates X. It only captures how the mean value of Y changes with X. However, often times, a single mean curve is not informative. Conditional quantile functions can provide a more complete picture of relationship between the response variable and different quantiles of the predictors. Quantile regression (Koenker, 2005) extends the regression model to conditional quantiles of the response variable, such as the median (50th quantile) or the 90th quantile in the response variable distribution. The application of quantile regression to heterogeneous data was proved by our group to be particularly useful where the tails and the central location of the conditional distributions vary differently with the covariates. Especially among all the voxels in a given brain region, we were more interested in the voxels that show more significant vs. those with less significant correlation (Wang et al., 2012). This approach is useful for data having non-standard distribution shapes. Least square method frequently used in traditional regression analysis estimates the mean of the response variable. However, in quantile regression, median or other quantiles of the population are estimated.
Results
MVC force
Immediately after the fatigue task (50% MVC), the handgrip MVC force decreased significantly (31.9±15.5%, mean±SD, P< 0.01) from the initial MVC force measured prior to the fatigue task. The decrease in the MVC force indicated presence of significant muscle fatigue.
Functional connectivity map
Fig. 4 illustrates a sample of time course of the seed volume in the left M1 used for the FC analysis. The time course lasted for 100s (minimal fatigue stage) during which 10 handgrip (ON and OFF) cycles occurred.
Fig. 4.
A sample time course of the seed area in the left M1 used for the FC analysis. The X axis shows fMRI scan numbers. The Y axis shows intensity of fMRI BOLD signal.
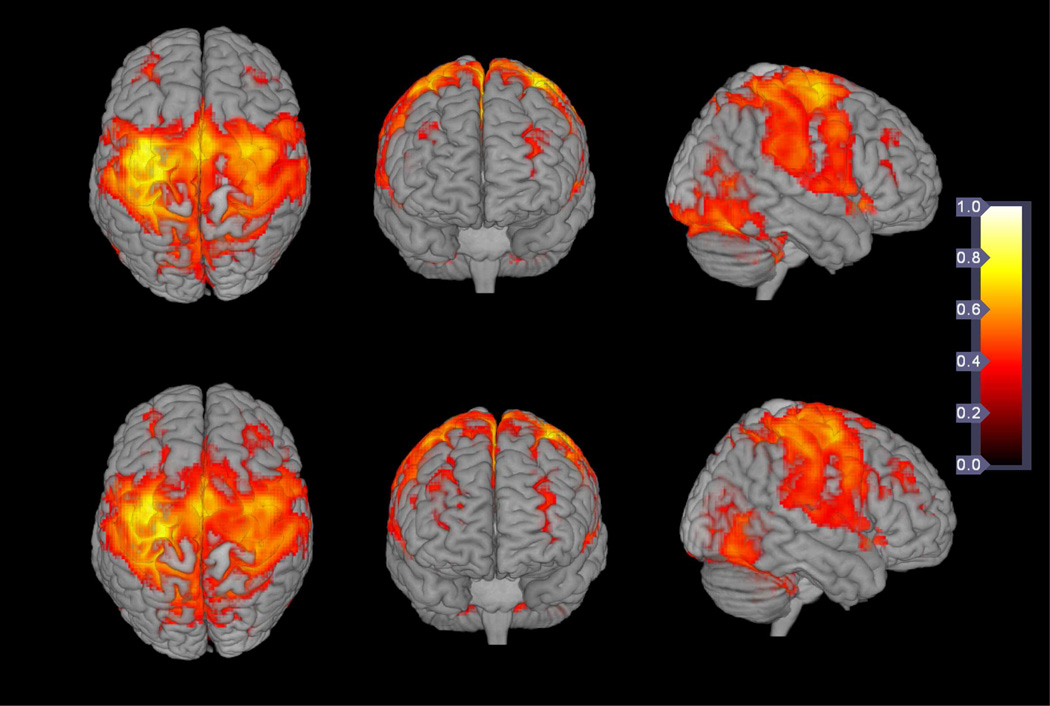
Fig. 5 shows FC maps (averaged across all subjects) during the minimal (upper row) and significant (lower row) fatigue stages overlaid onto the 3D template brain (provided in MRIcroGL available for download on http://www.cabiatl.com/mricrogl/). Correlation coefficients were color-coded on the maps. The result suggests that a similar functional network was active during both minimal and significant fatigue stages.
Fig. 5.
A 3 dimensional (3D) illustration of functional connectivity. Upper row: averaged functional connectivity (FC) map of all subjects in minimal fatigue stage; lower row: averaged FC map of all subjects in the significant fatigue stage. Coefficients of cross-correlation were color coded as shown by the color bar.
Histogram analysis
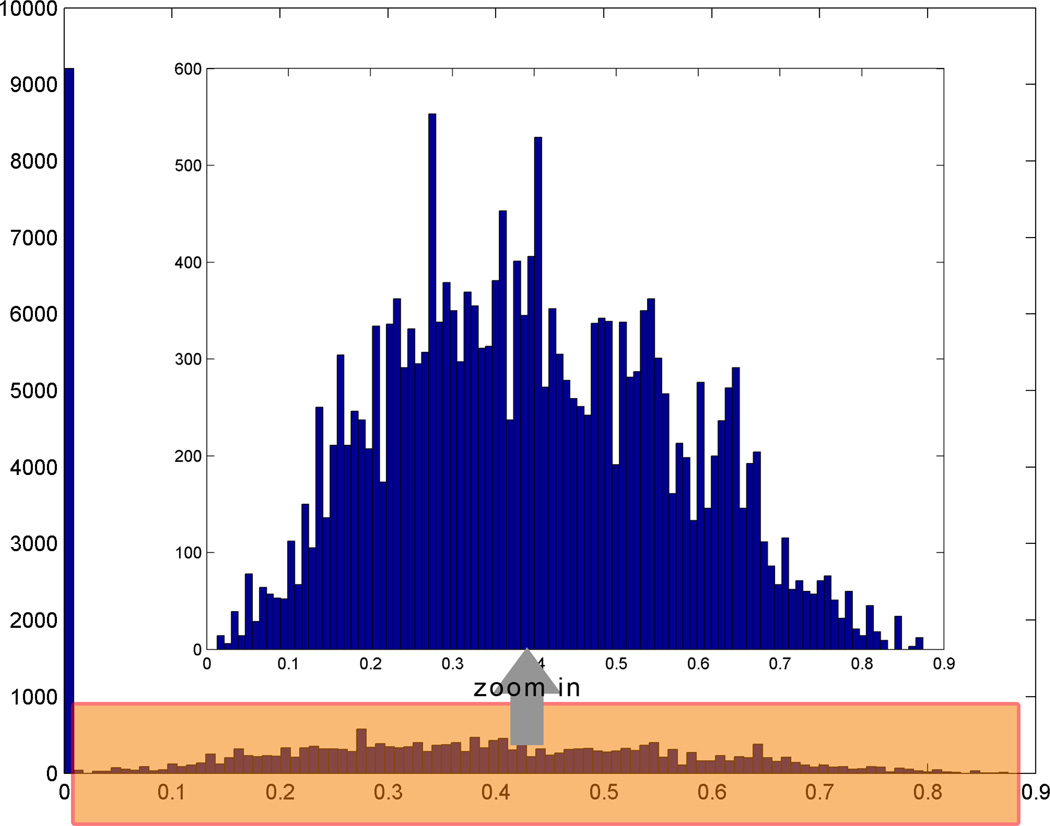
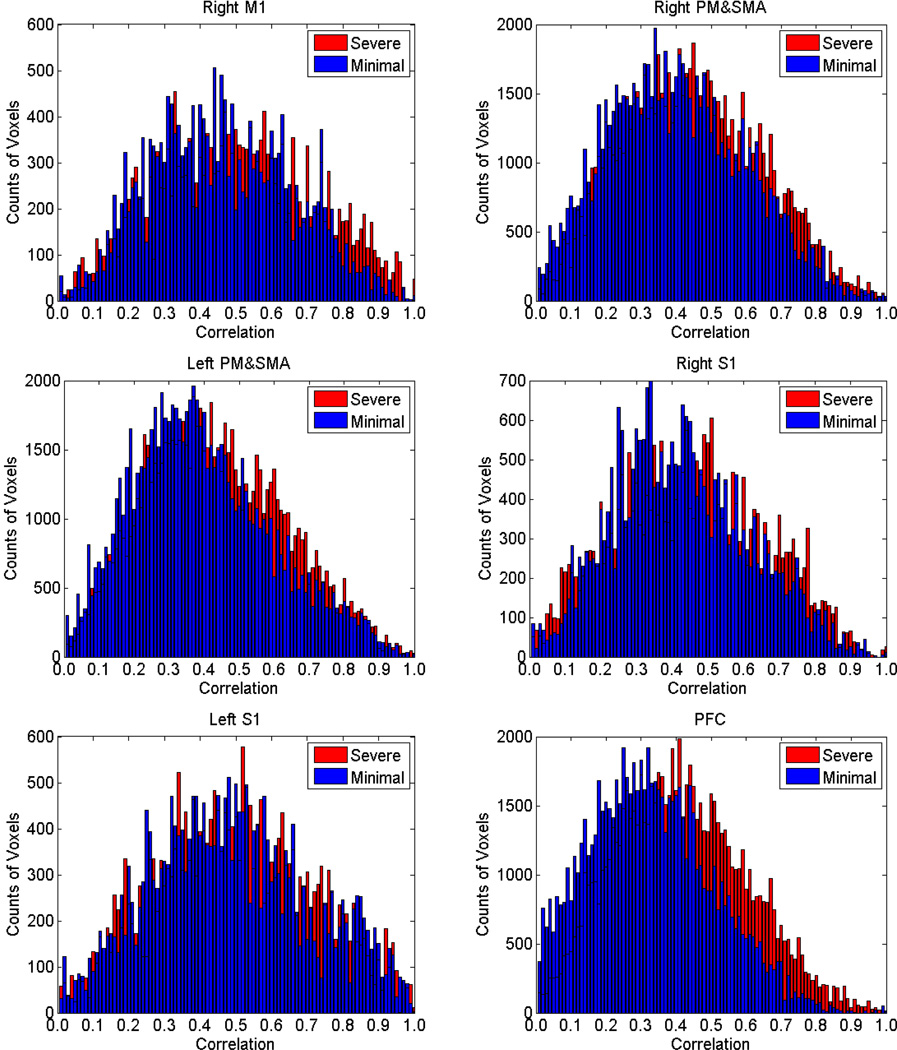
To quantitatively evaluate the effect of fatigue on FC, we examined the distribution of the correlation coefficient of each ROI pooled for all subjects in both the minimal and significant fatigue stages. We plotted one modified histogram, in which voxels having correlation less than 0.001 were excluded in the plots to better visualize the distribution of the stronger correlated voxels (see Fig. 6 for illustration of how this was done), for each ROI and overlaid the histogram for the minimal fatigue stage on top of the significant stage (Fig. 7).
Fig. 6.
Histogram of coefficients of cross-correlation after removing voxels with very low coefficients (r<0.001). Original histogram data are scaled down heavily because of the huge population of low correlation voxels (left blue bar in the outer box). After zooming in (from the shaded box at bottom to the inner box at middle), distribution of the coefficients can better be visualized.
Fig. 7.
Comparisons of histogram plots of correlation coefficients over all subjects in the analyzed ROIs. Blue bins = data for minimal fatigue stage, red bins = data for significant fatigue stage. Voxels with very-low correlation (r<0.001) were excluded for better visualization of coefficient distribution of the voxels in each ROI. In the significant fatigue stage, a larger number of voxels (red bins) can be seen with higher correlation (FC with seed area) values especially in the PFC.
Histogram analysis results showed a consistent ‘shift’ to higher correlation for all the ROIs in the significant fatigue stage. More voxels appeared on far right (higher r values) of the histograms for significant (last 100s) than minimal (first 100s) fatigue stages. This observation was especially evident for the prefrontal cortex. This indicated an increased FC in the significant fatigue stage because signals of a larger number of voxels were more closely coupled with the seed region (most active voxels in the left M1).
ANOVA and quantile regression analysis
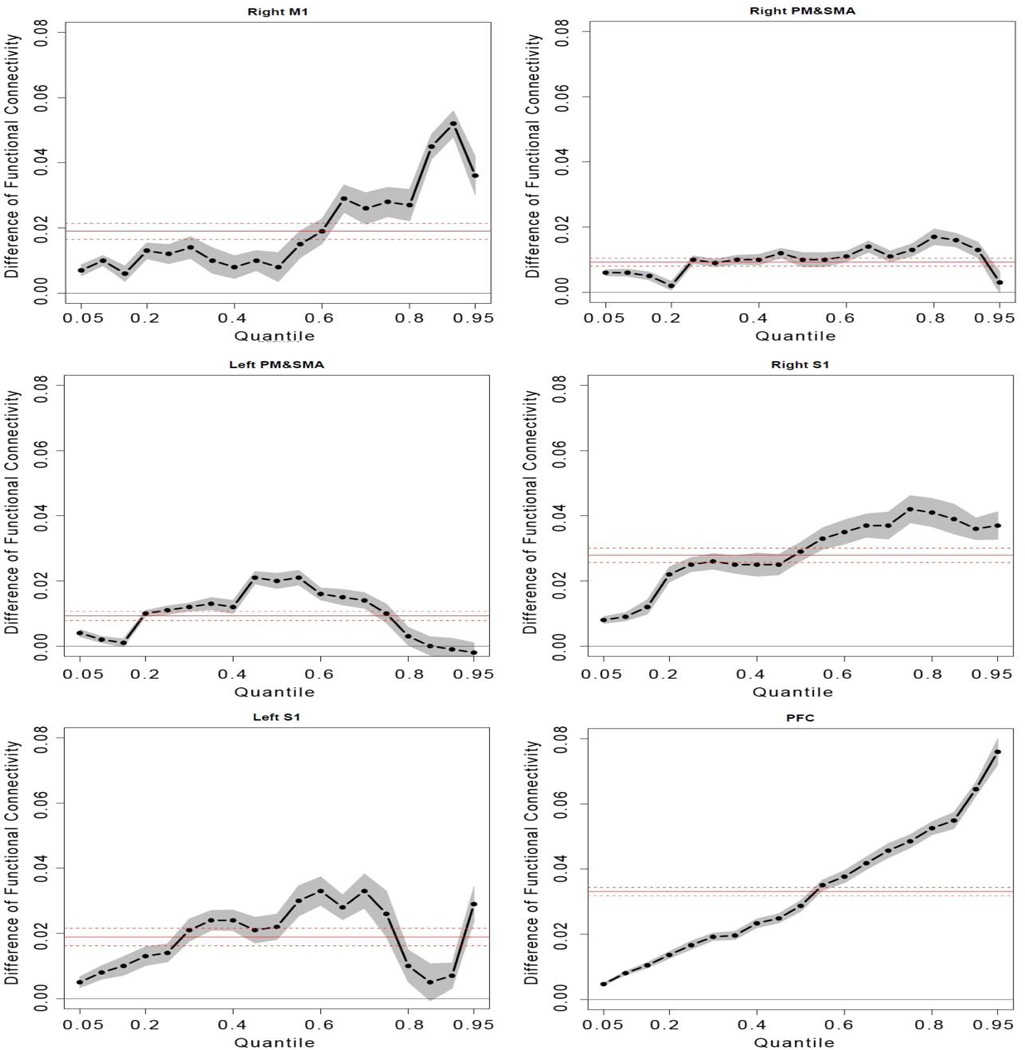
Both standard ANOVA and quantile regression analysis were performed to evaluate the magnitude of the FC during performance of the fatigue task. We modeled conditional quantiles (regression using different quantiles of the data instead of mean) of the magnitude of FC with the categorical variable as an indicator for severity of fatigue. Fig. 8 shows the ANOVA and quantile analysis results from comparison of FC of the minimal (first 100s) to that of significant fatigue (last 100s) stages. In each plot, the red solid line denotes the estimated mean difference of the magnitude of FC between the two stages and red dotted lines indicate the 95% confidence interval based on standard ANOVA analysis. The dark dot-dashed line in each plot denotes a sequence of coefficient estimates for quantile regressions with quantiles ranging from 0.05 to 0.95. The gray filled area surrounding the dot-dashed line indicates the 95% confident interval.
Fig. 8.
Results of quantile analysis from comparisons of coefficients of cross-correlation (FC) between minimal (first 100s) and significant (last 100s) fatigue stages. Comparisons were made at each quantile of the distribution curve between minimal and significant fatigue conditions in each ROI. Because more voxels exhibited very high FC under significant fatigue condition (such as PFC in Fig. 7) or voxels with moderate FC under minimal fatigue increased FC level with significant fatigue (such as left PM&SMA), the pattern of FC changes differed from one ROI to another. The quantile analysis adds new information to the ANOVA results indicated by the solid red line (mean FC difference) in each plot.
The ANOVA results showed that the magnitude of FC did increase in the significant fatigue stage for all the six ROIs. All the tests using the standard ANOVA model were significant (P<0.05). The quantile regression analysis revealed a great deal of detail regarding how the FC changed in the individual quantiles (voxels showing given ranges of correlation under minimal and severe fatigue conditions) and suggested heteroscedastic nature of the FC alterations associated with muscle fatigue. Fatigue has a more significant impact on upper quantiles of the magnitude of FC than the lower quantiles for areas of the right M1, PM&SMA, right S1 and PFC. The results illustrated that the higher magnitude of FC in these areas were more synchronized with the seed area under sever fatigue conditions. It is interesting to see that the PFC is the area endured the largest increases in FC on upper quantiles. This suggests that the PFC might be the most sensitive area with muscle fatigue. It is reasonable to predict that the PFC may play an important role in modulating muscle fatigue. The quantile processes for areas of the left PM&SMA and right S1 were close. These areas had more significant FC enhancement on the middle quantiles rather than lower or upper quantiles. These effects would be hidden if only the standard ANOVA analysis was performed.
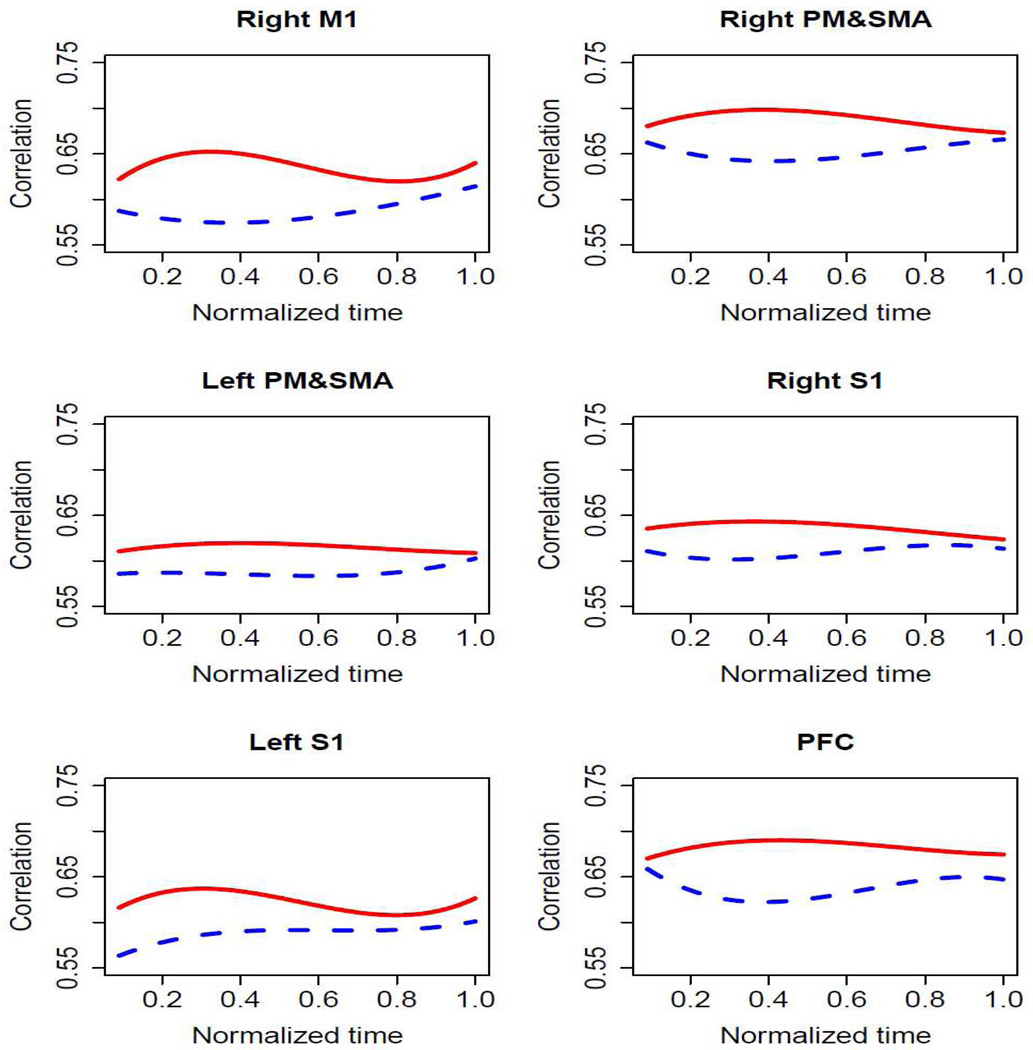
We also performed analysis using a polynomial regression model on the FC coefficient data of minimal and significant fatigue stages (Wang et al., 2009). This analysis provided us a comprehensive view of how FC changed during the entire fatiguing motor tasks. Third order polynomial regression model was tested for all six ROIs. The result confirmed with the quantile regression model showing that (i) FC was stronger during minimal than significant fatigue stages and (ii) the FC level varied with time (Fig. 9).
Fig. 9.
Results of polynomial regression analysis from comparisons of FC values at minimal with those at significant fatigue stages. (Red lines=correlation values for significant fatigue stage; Blue lines=correlation values for minimal fatigue stage)
Discussion
FC during fatiguing motor task
This study applied functional connectivity (FC) analysis to fMRI-measured brain signal time course data during a muscle fatigue task and found that the FC between the contralateral (left) M1 and a number of cortical regions in the motor control network increased significantly with muscle fatigue. Statistical quantile analysis was further employed to determine specific locations (quantiles) in the ROI that show high FC with seed region (left M1). Results from the quantile analysis indicate that voxels with high correlation (quantiles) with the seed ROI are mostly located in the PFC and right S1.
FC in this study is a measure of how activities of various cortical areas interact functionally with each other and it is not determined solely from the underlying structural connections. It has been shown that FC can change even from wakefulness to sleep (Massimini et al., 2005). Our study was the first to assess FC adaptations among cortical motor control centers during voluntary muscle fatigue. Although resting-state fMRI data is often used for FC analysis (Li et al., 2009), resting-state data is not suited for examining dynamic interaction of multiple brain regions during a progressive fatigue motor task. Resting-state is sometimes referred to as ‘default’ mode (Raichle et al., 2001), in which the slow oscillations of the fMRI signal reflect the underlying neural event. Peltier et al. (2005) assessed inter-hemispheric resting-state FC of the motor cortices before and after a sustained submaximal fatigue motor task; they reported a decrease in FC between the bilateral primary motor cortices. This seems to be contradictory to results of this study. However, because FC in Peltier et al. (2005) was measured in resting state and that of ours in a dynamic fatiguing process, the two studies are difficult to compare. Other studies have also reported outcome measure differences between conditions during motor fatigue and resting state (before and after motor fatigue). For example, transcranial magnetic stimulation (TMS) of the motor cortex during voluntary muscle fatigue indicated facilitation in corticospinal excitability under muscle fatigue condition (Taylor et al., 1996) but similar TMS applied during resting state suggested an inhibition in cortiospinal excitability after a motor fatigue task (Pitcher and Miles, 2002). This discrepancy could probably be due to lack of excitatory input from higher-order cortical regions to the primary motor cortex projecting directly to the working muscle after fatigue exercise. Recent preliminary data have shown enhanced such input with fatigue during a prolonged motor task(Jiang et al., 2008), which may improve corticospinal excitability. However, once this input is removed after cessation of the muscle performance, the fatigued corticospinal system may likely experience reduced excitability, such as the data shown by Peltier et al. (2005), which may be explained by increased variance in BOLD signal after fatiguing exercise (Benwell et al., 2005).
The observed increase of the FC with muscle fatigue is in accordance with our previous study (Liu et al., 2003), in which synchronized increases in activation (measured by fMRI) in similar cortical regions were observed. Although FC was not analyzed in that study, activation changing patterns of the cortical fields during the time course of the fatigue task were very similar, indicating a synchronized or correlated activation changes among the involved brain regions (Liu et al., 2003). Other fatigue-related brain function studies (Post et al., 2009; van Duinen et al., 2007) also reported similar increased brain activation among different cortical motor areas during voluntary muscle fatigue. However, none of these studies adopted the framework of FC to analyze fatigue-related brain activation adaptations. Co-activations of various brain regions, as observed in these studies, are assumed, theoretically, to be random and distributed independent events with no underlying network required. The FC analysis in this study considered the brain as a systematic large-scale network with functional interconnections linking spatially distributed brain regions. This analysis provided us deeper insights into how different brain regions of the underlying motor network interplay with each other in increasingly demanding muscle exertions.
Regions functionally connected to left M1
Our FC data revealed strengthened functional coupling within the cortical motor network. This finding not only confirmed observations of increasing activity of the bilateral M1, S1, PM&SMA, and PFC during submaximal fatigue muscle contractions, but also indicated that activities of these cortical fields became more temporally correlated to the left M1, the primary neural output center of the brain to the working muscles. Increased FC from the right M1 to left M1 could be explained that primary motor areas of the two hemispheres increasingly worked together to strengthen their output to prolong the muscle performance. Under the minimal fatigue condition, little signal is needed from the ipsilateral (right in this study) M1 for the motor task; when fatigue occurs, however, activities of the contralateral (left) M1 may not be adequate to drive the fatiguing muscles and additional, synchronized activities from the ipsilateral M1 through the ipsilateral projection (to the motoneuron pool) might be needed. Brain mapping studies have reported increased activation in the ipsilateral M1 with muscle fatigue (Liu et al. 2003; Post et al. 2009). This increasing activity in the isplilateral M1 was also confirmed in a readiness potential study (Schillings et al., 2006). Strengthened coupling between the S1 with the left M1 may indicate augmented communication between the sensory and motor regions, especially from sensory to motor as a result of increasing sensory feedback from the muscle to central sensory system. This enhanced FC between the sensory and motor areas may contribute to the increase in ‘sense of effort’ reported by Jones and Hunter (1983).
Our data showed that FC between the left M1 and bilateral PM&SMA increased as well. PM&SMA (BA 6) lies rostrally to the M1 and is believed to be associated, in general with motor planning and preparation (Frackowiak, 2004). Evidence of direct anatomical projection from PM&SMA to M1 has previously been shown (Dum and Strick, 1991) and functional neural imaging studies have demonstrated similar patterns of activation alterations between PM&SMA and M1 during fatigue muscle contraction at submaximal intensities (Post et al., 2009). A study (Vulliemoz et al., 2011) based on diffusion tensor imaging (DTI) showed evidence of the M1-SMA structural connectivity. A recent case report (Kovac et al., 2010) demonstrated that stimulating M1 can result in complex hand movements which can only be observed on stimulating the SMA. This implied a pathway-based connectivity between the M1 and SMA. These anatomical and functional connectivity data support the fMRI signal-based FC between the two areas. Detailed quantile analyses showed consistent increases in FC between the left M1 and all sub-regions of BA6 (bilateral dorsal PM [PMd], ventral PM [PMv], pre-SMA and SMA-proper) (Table 1).
Table 1.
Estimated differences of coefficients of cross-correlation between significant and minimal fatigue stages (i.e. significant-minimal) and their standard errors based on linear regression models. The statistical tests were performed to evaluate whether FC is greater in significant than minimal fatigue stages for sub-region ROIs in the PM/SMA and PFC not shown in Fig. 7, 8 and 9.
| ROI | Estimate | Std Err | ROI | Estimate | Std Err |
|---|---|---|---|---|---|
| Premotor Cortex Sub Regions (Mayka et al., 2006) | |||||
| Left PMd | 0.0568 | 0.0006 | Right PMd | 0.0326 | 0.0006 |
| Left PMv | 0.0388 | 0.0005 | Right PMv | 0.0543 | 0.0006 |
| Left preSMA_L | 0.0642 | 0.0009 | Right preSMA | 0.0493 | 0.001 |
| Left SMA proper | 0.0302 | 0.0011 | Right SMA proper | 0.035 | 0.001 |
| Prefrontal Cortex Sub Regions (Tzourio-Mazoyer et al., 2002) | |||||
| Left mPFC | 0.0886 | 0.0005 | Right mPFC | 0.104 | 0.0005 |
| Left DLPFC | 0.0704 | 0.0004 | Right DLPFC | 0.0702 | 0.0003 |
| Left VLPFC | 0.1162 | 0.0006 | Right VLPFC | 0.0871 | 0.0006 |
| Left omPFC | 0.1334 | 0.0029 | Right omPFC | 0.1634 | 0.0027 |
All tests exhibited significant differences in FC between the two fatigue stages (P<0.001 for all ROIs). PMd=dorsal premotor, PMv=ventral premotor, preSMA=rostral SMA, SMA proper=caudal SMA, mPFC= medial PFC, DLPFC=dorsolateral PFC, VLPFC=vetrolateral PFC, and omPFC=orbito-medial PFC.
Interestingly, the PFC (including all analyzed PFC sub-regions: dorsolateral PFC [DLPFC], ventrolateral PFC [VLPFC], medial PFC [mPFC], and orbitomedial PFC [omPFC]; see Table 1) showed the highly significant fatigue-related FC changes with the M1. This finding agrees with previous observation of strongest fMRI signal increases in the PFC during an intermittent handgrip fatigue task at 30% maximal level (Liu et al., 2003). The PFC has widely been viewed as one of brain areas at the highest level of motor hierarchy (Rushworth, 2000) and is thought to be involved in the selection of action (Frackowiak, 2004). Strength of input from the PFC to lower levels of motor areas such as PM&SMA and M1 may increase to reinforce the descending command under fatigue condition, which might enhance FC among the regions. Functional MRI-based effective connectivity data have shown increased signal flow from the PFC to M1 with augmentation of descending command(Jiang and Yue, 2010). An animal study (Luppino et al., 1993) revealed that there are fiber projections from the PFC to PM&SMA, and the PM&SMA to M1.
FC results from analysis of sub-regions in PFC are presented in Table 1. The FC in all PFC sub-regions (bilateral VLPFC, DLPFC, mPFC, and omPFC) increased significantly in the severe than minimal fatigue stages. A recent study using near-infrared spectroscopy (NIRS) (Suda et al., 2009) reported that the VLPFC is related to subjective feeling of fatigue, suggesting that VLPFC is involved in monitoring state of mind in a voluntary fatigue process. Decreased activation in DLPFC has been found in patients with chronic fatigue syndrome during an imagined fatiguing task (Caseras et al., 2008). This might help explain the increased FC in DLPFC as a possible top-down regulation process to compensate for the diminishing force production capability as subjects needed to recruit a greater amount of the muscle to maintain the same force. The omPFC is believed to be associated with cognitive and behavioral deficits in patients with motor neuron diseases (Meier et al., 2010), which implicates a possible involvement of decision-making and reward process during fatiguing muscle contractions. The mPFC has been shown to be involved in turning stimulus into motor responses during simple choice task (Hare et al., 2011) and seems to be related to decision-making of whether or not to move.
In summary, our study is the first to show strengthened coupling between individual regions in the PFC and the contralateral M1. At both global and regional levels in the PFC, our data and those reported in the literature suggest that the PFC plays an important role in regulating voluntary muscle fatigue, perhaps by integrating sensory feedback with reinforcement of input signal to the primary motor area to increase the descending command. Another promising explanation of the increase in FC between the PFC and M1 could be involvement of dynamic higher-order function such as decision-making or motivation related to continuation of the motor task with increasing tiredness and discomfort as a result of fatigue.
FC and central efficiency
Increased motor commands are needed to sustain submaximal force output by recruiting additional motor units and increasing activation level of the active motor units to compensate for fatigue-related force loss. This indicates a decline in central efficiency. Increasing FC from the sensorimotor regions with the left M1, as observed in this study, provides evidence of diminished central efficiency during motor fatigue (greater FC supporting same level of force with fatigue). Although the force level did not change significantly during the entire task, the FC of aforementioned areas with the left M1 increased significantly. Schillings et al. (2006) also reported reduction of central efficiency by analyzing readiness potential during a fatigue task involving repetitive muscle contractions at submaximal intensity. An increase in FC or decline in central efficiency may act as a central parameter of muscle fatigue. A recent study (Yang et al., 2009) reported weakened corticomuscular FC (based on EEG-EMG coherence analysis) during muscle fatigue, perhaps providing an potential explanation of why central efficiency is reduced under muscle fatigue condition. If cortical control signal cannot effectively be transmitted to muscle, a greater such signal is needed for a given work done by the muscle.
New information unveiled by quantile analysis
Quantile regression extends the regression model to conditional quantiles of the response variable. It is particularly useful with heterogeneous data where the tails and the central location of the conditional distributions vary differently with the covariates. Quantile processes of correlation for different ROIs in this study varied significantly, as shown in Fig. 8. All quantile estimates of FC under fatigue condition were above zero except the upper quantiles in the left PM&SMA. These results confirmed the analysis of polynomial regression, which the average correlation (FC) for the significant fatigue condition was greater than that for the minimal fatigue condition. Quantile analysis unveiled additional information that cannot be observed by a standard ANOVA model. For example, the quantile processes in right M1, right S1, and bilateral PFC showed obvious increasing FC values on upper quantiles with muscle fatigue. For the left PM&SMA and S1, FC increased more on middle than lower or upper quantiles. These data suggest that the fatigue effect on the FC was its distribution quantile- and cortical region-dependent. The largest change in FC occurred on highest quantiles in the PFC but that arose on the middle quantiles in the left PM&SMA, indicating that the most significant fatigue-related FC enhancement took place in voxels (sub-locations) exhibiting highest cross-correlation (with left M1) in the PFC. In the left PM&SMA, however, the greatest strengthening in FC was in voxels showing moderate levels of cross-correlation (Fig. 8).
Study limitations
The FC analysis employed in this study does not necessarily imply any causal relationship (Rykhlevskaia et al., 2008) among the analyzed ROIs. To infer any causal relationship based on similar neuroimaging data, a more informative tool called effective connectivity (EC) analysis could be used. Outcome of the EC analysis would provide information of direction of interaction between brain regions. A study analyzing EC within the motor network is under way by the author group. Blood-oxygen-level-dependent (BOLD) signal in fMRI does not directly reflect underlying neuronal activities (Logothetis, 2008). Since any measures of brain activation can be used for FC analysis (Rykhlevskaia et al., 2008), other signals (such as electrophysiological signals) paired with fMRI data may be analyzed to better understand dynamic adaptations in the motor control network during progressive muscle fatigue.
Another limitation is that we do not have enough information to show where exactly in the brain the voxels with altered FC were localized because we adopted ROI-based quantile regression. This approach could only identify regional adaptations in FC rather than at individual voxel levels. Voxel-based whole brain FC analysis can better reveal more details in spatial properties of the FC changes during fatigue.
Conclusions
This study applied functional connectivity (FC) analysis to fMRI brain signal time course data during a muscle fatigue task and found that the FC between the contralateral primary motor cortex and a number of other cortical regions in the motor control network increased significantly with muscle fatigue. Statistical quantile analysis compared the FC between the two fatigue conditions and the results revealed differential modulation effects of fatigue on FC among different brain areas with the motor cortex. Overall, the results suggest more synchronized effort across cortical fields in the motor control network to strengthen the central drive to the motoneuron pool to prolong the muscle contraction. The finding is consistent with previous observation of similar patterns of activation increases in many sensorimotor areas. However, our finding is the first to demonstrate strengthened functional coupling (based on statistical analysis) among motor control centers in the brain during muscle fatigue. A substantial increase in FC in the PFC suggests this association cortex may play a crucial role in monitoring voluntary muscle fatigue during long-lasting submaximal motor actions.
Highlights.
-
<
We examined effects of muscle fatigue on strength of brain functional connectivity
-
<
Brain functional connectivity increases significantly with muscle fatigue
-
<
Brain functional connectivity increases with fatigue among many cortical regions
-
<
Prefrontal and motor cortices show strongest functional connectivity with fatigue
-
<
Strengthened functional connectivity during fatigue may fortify descending command
Acknowledgments
This research was supported in part by an NIH grant (R01NS37400) and Doctoral Research Expense Award (2010) from Cleveland State University. We thank Dr. Xiaoping Hu and colleagues at Emory University, Atlanta, Georgia for providing us the privilege of using the scanner and assistance in the imaging data collection.
Footnotes
Publisher's Disclaimer: This is a PDF file of an unedited manuscript that has been accepted for publication. As a service to our customers we are providing this early version of the manuscript. The manuscript will undergo copyediting, typesetting, and review of the resulting proof before it is published in its final citable form. Please note that during the production process errors may be discovered which could affect the content, and all legal disclaimers that apply to the journal pertain.
Reference
- Baudrexel S, Witte T, Seifried C, von Wegner F, Beissner F, Klein JC, Steinmetz H, Deichmann R, Roeper J, Hilker R. Resting state fMRI reveals increased subthalamic nucleus- motor cortex connectivity in Parkinson's disease. Neuroimage. 2011 doi: 10.1016/j.neuroimage.2011.01.017. [DOI] [PubMed] [Google Scholar]
- Benwell NM, Byrnes ML, Mastaglia FL, Thickbroom GW. Primary sensorimotor cortex activation with task-performance after fatiguing hand exercise. Exp Brain Res. 2005;167:160–164. doi: 10.1007/s00221-005-0013-2. [DOI] [PubMed] [Google Scholar]
- Benwell NM, Mastaglia FL, Thickbroom GW. Changes in the functional MR signal in motor and non-motor areas during intermittent fatiguing hand exercise. Exp Brain Res. 2007;182:93–97. doi: 10.1007/s00221-007-0973-5. [DOI] [PubMed] [Google Scholar]
- Camara E, Rodriguez-Fornells A, Munte TF. Functional connectivity of reward processing in the brain. Front Hum Neurosci. 2008;2:19. doi: 10.3389/neuro.09.019.2008. [DOI] [PMC free article] [PubMed] [Google Scholar]
- Caseras X, Mataix-Cols D, Rimes KA, Giampietro V, Brammer M, Zelaya F, Chalder T, Godfrey E. The neural correlates of fatigue: an exploratory imaginal fatigue provocation study in chronic fatigue syndrome. Psychol Med. 2008;38:941–951. doi: 10.1017/S0033291708003450. [DOI] [PubMed] [Google Scholar]
- Dum RP, Strick PL. The origin of corticospinal projections from the premotor areas in the frontal lobe. J Neurosci. 1991;11:667–689. doi: 10.1523/JNEUROSCI.11-03-00667.1991. [DOI] [PMC free article] [PubMed] [Google Scholar]
- Frackowiak RSJ, editor. Human Brain Function. 2004. [Google Scholar]
- Hare TA, Schultz W, Camerer CF, O'Doherty JP, Rangel A. Transformation of stimulus value signals into motor commands during simple choice. Proc Natl Acad Sci U S A. 2011;108:18120–18125. doi: 10.1073/pnas.1109322108. [DOI] [PMC free article] [PubMed] [Google Scholar]
- Jiang Z, Pioro E, Yue GH. Muscle fatigue weakens prefrontal-to-premotor and cross-hemispheric premotor effective connectivity. Soc Neurosci. 2008 Abstr,671.13. [Google Scholar]
- Jiang Z, Yue GH. Strenghtened brain effective connectivity from low to high muscle force. Soc Neurosci. 2010 Abstr,83.22. [Google Scholar]
- Jones LA, Hunter IW. Effect of fatigue on force sensation. Exp Neurol. 1983;81:640–650. doi: 10.1016/0014-4886(83)90332-1. [DOI] [PubMed] [Google Scholar]
- Koenker R. Quantile Regression. Cambridge University Press; 2005. [Google Scholar]
- Kovac S, Scott C, Rugg-Gunn F, Miserocchi A, Vollmar C, Rodionov R, McEvoy A, Diehl B. Unusual cortical stimulation findings: connectivity between primary motor and supplementary motor areas. Epilepsy Behav. 2010;19:639–642. doi: 10.1016/j.yebeh.2010.09.006. [DOI] [PubMed] [Google Scholar]
- Li K, Guo L, Nie J, Li G, Liu T. Review of methods for functional brain connectivity detection using fMRI. Comput Med Imaging Graph. 2009;33:131–139. doi: 10.1016/j.compmedimag.2008.10.011. [DOI] [PMC free article] [PubMed] [Google Scholar]
- Liu JZ, Dai TH, Elster TH, Sahgal V, Brown RW, Yue GH. Simultaneous measurement of human joint force, surface electromyograms, and functional MRI-measured brain activation. J Neurosci Methods. 2000;101:49–57. doi: 10.1016/s0165-0270(00)00252-1. [DOI] [PubMed] [Google Scholar]
- Liu JZ, Dai TH, Sahgal V, Brown RW, Yue GH. Nonlinear cortical modulation of muscle fatigue: a functional MRI study. Brain Res. 2002;957:320–329. doi: 10.1016/s0006-8993(02)03665-x. [DOI] [PubMed] [Google Scholar]
- Liu JZ, Shan ZY, Zhang LD, Sahgal V, Brown RW, Yue GH. Human brain activation during sustained and intermittent submaximal fatigue muscle contractions: an FMRI study. J Neurophysiol. 2003;90:300–312. doi: 10.1152/jn.00821.2002. [DOI] [PubMed] [Google Scholar]
- Liu WC, Flax JF, Guise KG, Sukul V, Benasich AA. Functional connectivity of the sensorimotor area in naturally sleeping infants. Brain Res. 2008;1223:42–49. doi: 10.1016/j.brainres.2008.05.054. [DOI] [PubMed] [Google Scholar]
- Logothetis NK. What we can do and what we cannot do with fMRI. Nature. 2008;453:869–878. doi: 10.1038/nature06976. [DOI] [PubMed] [Google Scholar]
- Luppino G, Matelli M, Camarda R, Rizzolatti G. Corticocortical connections of area F3 (SMA-proper) and area F6 (pre-SMA) in the macaque monkey. J Comp Neurol. 1993;338:114–140. doi: 10.1002/cne.903380109. [DOI] [PubMed] [Google Scholar]
- Massimini M, Ferrarelli F, Huber R, Esser SK, Singh H, Tononi G. Breakdown of cortical effective connectivity during sleep. Science. 2005;309:2228–2232. doi: 10.1126/science.1117256. [DOI] [PubMed] [Google Scholar]
- Mayer AR, Mannell MV, Ling J, Gasparovic C, Yeo RA. Functional connectivity in mild traumatic brain injury. Hum Brain Mapp. 2011 doi: 10.1002/hbm.21151. [DOI] [PMC free article] [PubMed] [Google Scholar]
- Mayka MA, Corcos DM, Leurgans SE, Vaillancourt DE. Three-dimensional locations and boundaries of motor and premotor cortices as defined by functional brain imaging: a meta-analysis. Neuroimage. 2006;31:1453–1474. doi: 10.1016/j.neuroimage.2006.02.004. [DOI] [PMC free article] [PubMed] [Google Scholar]
- Meier SL, Charleston AJ, Tippett LJ. Cognitive and behavioural deficits associated with the orbitomedial prefrontal cortex in amyotrophic lateral sclerosis. Brain. 2010;133:3444–3457. doi: 10.1093/brain/awq254. [DOI] [PubMed] [Google Scholar]
- Oldfield RC. The assessment and analysis of handedness: the Edinburgh inventory. Neuropsychologia. 1971;9:97–113. doi: 10.1016/0028-3932(71)90067-4. [DOI] [PubMed] [Google Scholar]
- Peltier SJ, LaConte SM, Niyazov DM, Liu JZ, Sahgal V, Yue GH, Hu XP. Reductions in interhemispheric motor cortex functional connectivity after muscle fatigue. Brain Res. 2005;1057:10–16. doi: 10.1016/j.brainres.2005.06.078. [DOI] [PubMed] [Google Scholar]
- Pitcher JB, Miles TS. Alterations in corticospinal excitability with imposed vs. voluntary fatigue in human hand muscles. J Appl Physiol. 2002;92:2131–2138. doi: 10.1152/japplphysiol.00835.2001. [DOI] [PubMed] [Google Scholar]
- Post M, Steens A, Renken R, Maurits NM, Zijdewind I. Voluntary activation and cortical activity during a sustained maximal contraction: an fMRI study. Hum Brain Mapp. 2009;30:1014–1027. doi: 10.1002/hbm.20562. [DOI] [PMC free article] [PubMed] [Google Scholar]
- Raichle ME, MacLeod AM, Snyder AZ, Powers WJ, Gusnard DA, Shulman GL. A default mode of brain function. Proc Natl Acad Sci U S A. 2001;98:676–682. doi: 10.1073/pnas.98.2.676. [DOI] [PMC free article] [PubMed] [Google Scholar]
- Rushworth MFS. Anatomical and functional subdivision within the primate lateral prefrontal cortex. Psychobiology. 2000;28:187–196. [Google Scholar]
- Rykhlevskaia E, Gratton G, Fabiani M. Combining structural and functional neuroimaging data for studying brain connectivity: a review. Psychophysiology. 2008;45:173–187. doi: 10.1111/j.1469-8986.2007.00621.x. [DOI] [PubMed] [Google Scholar]
- Schafer RJ, Constable T. Modulation of functional connectivity with the syntactic and semantic demands of a Noun Phrase Formation Task: a possible role for the Default Network. Neuroimage. 2009;46:882–890. doi: 10.1016/j.neuroimage.2009.02.017. [DOI] [PubMed] [Google Scholar]
- Schillings ML, Kalkman JS, van der Werf SP, Bleijenberg G, van Engelen BG, Zwarts MJ. Central adaptations during repetitive contractions assessed by the readiness potential. Eur J Appl Physiol. 2006;97:521–526. doi: 10.1007/s00421-006-0211-z. [DOI] [PubMed] [Google Scholar]
- Suda M, Fukuda M, Sato T, Iwata S, Song M, Kameyama M, Mikuni M. Subjective feeling of psychological fatigue is related to decreased reactivity in ventrolateral prefrontal cortex. Brain Res. 2009;1252:152–160. doi: 10.1016/j.brainres.2008.11.077. [DOI] [PubMed] [Google Scholar]
- Taylor JL, Butler JE, Allen GM, Gandevia SC. Changes in motor cortical excitability during human muscle fatigue. J Physiol. 1996;490(Pt 2):519–528. doi: 10.1113/jphysiol.1996.sp021163. [DOI] [PMC free article] [PubMed] [Google Scholar]
- Tzourio-Mazoyer N, Landeau B, Papathanassiou D, Crivello F, Etard O, Delcroix N, Mazoyer B, Joliot M. Automated anatomical labeling of activations in SPM using a macroscopic anatomical parcellation of the MNI MRI single-subject brain. Neuroimage. 2002;15:273–289. doi: 10.1006/nimg.2001.0978. [DOI] [PubMed] [Google Scholar]
- van Duinen H, Renken R, Maurits N, Zijdewind I. Effects of motor fatigue on human brain activity, an fMRI study. Neuroimage. 2007;35:1438–1449. doi: 10.1016/j.neuroimage.2007.02.008. [DOI] [PubMed] [Google Scholar]
- Vulliemoz S, Vollmar C, Koepp MJ, Yogarajah M, O'Muircheartaigh J, Carmichael DW, Stretton J, Richardson MP, Symms MR, Duncan JS. Connectivity of the supplementary motor area in juvenile myoclonic epilepsy and frontal lobe epilepsy. Epilepsia. 2011;52:507–514. doi: 10.1111/j.1528-1167.2010.02770.x. [DOI] [PubMed] [Google Scholar]
- Wang XF, Jiang Z, Daly JJ, Yue GH. A generalized regression model for region of interest analysis of fMRI data. Neuroimage. 2012;59:502–510. doi: 10.1016/j.neuroimage.2011.07.079. [DOI] [PMC free article] [PubMed] [Google Scholar]
- Wang XF, Yang Q, Fan Z, Sun CK, Yue GH. Assessing time-dependent association between scalp EEG and muscle activation: A functional random-effects model approach. J Neurosci Methods. 2009;177:232–240. doi: 10.1016/j.jneumeth.2008.09.030. [DOI] [PMC free article] [PubMed] [Google Scholar]
- Werner CJ, Stocker T, Kellermann T, Bath J, Beldoch M, Schneider F, Wegener HP, Shah JN, Neuner I. Altered motor network activation and functional connectivity in adult tourette's syndrome. Hum Brain Mapp. 2011 doi: 10.1002/hbm.21175. [DOI] [PMC free article] [PubMed] [Google Scholar]
- Yang Q, Fang Y, Sun CK, Siemionow V, Ranganathan VK, Khoshknabi D, Davis MP, Walsh D, Sahgal V, Yue GH. Weakening of functional corticomuscular coupling during muscle fatigue. Brain Res. 2009;1250:101–112. doi: 10.1016/j.brainres.2008.10.074. [DOI] [PMC free article] [PubMed] [Google Scholar]


