

Abstract
A novel protocol for all-atom RNA tertiary structure prediction is presented that employs restrained molecular mechanics and simulated annealing. The restraints are from secondary structure, co-variation analysis, coaxial stacking predictions for helices in junctions, and, when available, cross-linking data. Results are demonstrated on the Alu domain of the mammalian signal recognition particle RNA, the Saccharomyces cerevisiae phenylalanine tRNA, the hammerhead ribozyme, the hepatitis C virus internal ribosomal entry site, and the P4-P6 domain of the Tetrahymena thermophila group I intron. The predicted structure is selected from a pool of decoy structures with a score that maximizes radius of gyration and base-base contacts, which was empirically found to select higher quality decoys. This simple ab initio approach is sufficient to make good predictions of the structure of RNAs compared to current crystal structures using both root mean square deviation and the accuracy of base-base contacts.
RNA tertiary structure modeling from low resolution data, such as sequence covariation, can lead to impressively accurate structures. The structure model of the Tetrahymena thermophila group I intron built by Michel and Westhof has an RMSD of 7.3 Å as compared to the crystal structure subsequently solved by Guo et al.1,2 Michel and Westhof took advantage of the hierarchical nature of RNA folding, i.e. the fact that the secondary structure tends to form on faster time scales and with more stability than the tertiary structure, to build a model starting from the secondary structure and tertiary contacts identified by comparative analysis.3 This was done without a solved structure of a homologous RNA. While their results were excellent, the method is difficult because it requires a great deal of effort and insight on the part of the model builder.
A method that uses similar information for identifying interactions to build a tertiary structure model in an automated fashion is presented here. While there have been significant advances at predicting the conformations of small RNAs, including their non-canonical base pairs, from restraint satisfaction, as in MC-Fold, or knowledge-based potentials, as in FARNA, such methods have not been applied to sequences longer than 100 nucleotides and rarely on branched RNAs.4–6 In contrast, coarse-grained methods such as NAST, DMD, YAMMP, and YUP have been successful at predicting the overall conformation of RNAs, but they do not attempt to model specific atomic interactions.7–10 Translating coarse-grained models to all-atom models is currently a significant research problem.6,11 A number of other packages are also available for building models with human intervention, including MANIP and RNA2D3D, but these require the intuition of the user to assemble structures.12,13 The method presented here is all-atom and fully automated, and also accurately models the fold of the molecule. It is deliberately simple, using only the secondary structure and information from co-variations that can be identified from a sequence alignment, biochemical data, and the coaxial stacking prediction method of Tyagi and Mathews for predicting which helices stack coaxially in a multibranch loop (helical junction).14
The low resolution restraints are utilized with a simulated annealing protocol that uses a novel implementation of plane-plane restraints and “soft core” van der Waals potentials to build a set of decoy structures.15 A new scoring function is then used to identify the most accurate models from the decoy structures. Models of five RNAs with lengths from 50 to 158 nucleotides were constructed, each featuring at least one helical junction, with root mean square deviations (RMSDs) of as good as 5 Å between the models and the crystal structures when computed for all heavy atoms in the system.
RESULTS
The structures of the Alu domain of the mammalian signal recognition particle (SRP), the hepatitis C virus internal ribosomal entry site (HCV IRES), the hammerhead ribozyme, tRNAPhe from Sacchromyces cerevisiae, and the P4-P6 domain of the Tetrahymena group I intron were predicted.16–20 These molecules were chosen to get a range of structures that feature at least one helical junction.
Protocol for generating decoy structure sets
The simulated annealing calculation was run in a modified version of the AMBER 10 molecular dynamics package.21 Each simulation began with a “linear” molecule in which the strand was in the conformation of an ideal A-form helix, but with no pairing partner. Generalized Born implicit solvation was used for the calculations.22–24 The system was initially heated to 1000 K with the non-bonded forces off to speed the calculation and to allow rapid conformational sampling. With the non-bonded forces off, atoms are able to pass through each other, a feature that aids in allowing the low-resolution restraints to be satisfied, without knotting the RNA backbone. Next, restraints corresponding to the secondary structure were gradually increased. Backbone dihedrals of all base-paired nucleotides were restrained to a range consistent with ideal A-form values and the distances between hydrogen-bonded atoms restrained to a range consistent with ideal values.25 Restraints on base pairs within 40 nucleotides of each other in sequence were turned on before those on more distant base pairs to fold the RNA hierarchically.
Additionally, bases in pairs were restrained to lie co-planar with each other and planes of neighboring base pairs were restrained to be nearly parallel, within ranges of A-form helices measured in crystal structures and ideal constructions from Nucleic Acid Builder.17–20,26 The capability to restrain the angle between the normal vectors of two planes, defined by the positions of three or four atoms each, is a new capability added to AMBER 10 as a part of this work.
Once the secondary structure was enforced, van der Waals forces were restored using an adapted implementation of the “soft core” van der Waals potentials of Steinbrecher et al.15 Unlike scaling up van der Waals forces linearly, the soft core potentials do not have a singularity, i.e. an infinite potential as a result of a divide by zero, at the nucleus. As shown in Figure 1, the off-to-on transition of van der Waals forces is smooth, enabling simulations without van der Waals forces initially, and then they can be restored gradually according to the soft core regime without numerical instability.
Figure 1.

Plots comparing the van der Waals potential energy for the usual 6–12 Lennard-Jones potential at 10% strength and the soft core potential with λ = 0.1 for guanine and cytosine bases interacting with an aromatic carbon probe atom. (a) A guanine base with the 6–12 potential at 10% strength. (b) A guanine base with the soft core potential with λ = 0.1. (c) A cytosine base with the 6–12 potential at 10% strength. (d) A cytosine base with the soft core potential with λ = 0.1. Parameters are taken from the AMBER ff99 force field relative to an aromatic carbon probe atom like the ones that make up nucleobases. Adenine and uracil plots are available in supplementary material. In all cases, the 6–12 potential has a local minimum at the center of each ring with barriers of escape in excess of 1 million kcal/mol, leaving the chance that two rings could interlock inseparably in an unphysical conformation when the potential is first restored. In contrast, the soft core potential has a local maximum at the center of the bases with no local energy minima inside any rings, and the energies inside each are about six orders of magnitude lower. Bases that were overlapping or interlocked during the stage of the run without VDW or electrostatic forces will smoothly slide apart.
Additionally, it was observed that the soft core potential has the feature of preventing problems with interlocking rings as van der Waals forces are restored. With the standard 6–12 potential, the center of RNA bases are a local potential energy minimum because of the singularities at the center of each atom. Should two bases be in an unfortunate conformation when the Lennard-Jones potential is switched from off to on, the rings would be interlocked and unable to separate. In contrast, the potential energy at the center of a base using the soft core potential is a local maximum for small values of the scaling factor λ, as illustrated in Fig. 1. If two bases are in an overlapping conformation as van der Waals forces are being restored via this method (see Methods for equation), the soft core van der Waals potential will smoothly force them apart to a physically reasonable distance as the full strength of the potential energy is restored.
To complete the protocol, electrostatic forces are restored linearly following the restoration of van der Waals forces. Finally, restraints are gradually enforced to restrain helical coaxial stacking predictions, co-variation analysis, and biochemical data, as applicable for each molecule. Parameters for the coaxial stacking restraints were derived from Tyagi and Mathews.14 Co-variation and biochemical restraints are simply a restraint between the centers of mass of the two bases that co-vary or interact in solution. There is no difference between the treatment of base stacking interactions or any sort of non-canonical pair interactions; the force field and sterics resulting from the other enforced restraints guide the nature of the tertiary interaction. Once these restraints are enforced, the system is slowly cooled to 0 K and ultimately the system is energy-minimized using Poisson-Boltzmann implicit solvation.27,28
Evaluation of structure prediction
To evaluate the resulting structures, the RMSD of all heavy atoms was used, along with two measurements of the accuracy of base-base contacts made in the final structure. The sensitivity reported is the fraction of contacts observed in the crystal structure that are correctly predicted. Secondly, the Positive Predictive Value (PPV) is reported. This is the fraction of contacts in the predicted structure that are also in the crystal structure. These numbers are reported both for all contacts and then for the subset of contacts that were not enforced by the applied restraints. The RMSD is roughly the average distance of atoms in the predicted model from those in the crystal structure.
Criteria for choosing predicted structure from decoys
For each molecule, 32 independent simulated annealing trials were run. While running without van der Waals forces followed by soft core restoration increased the probability that the molecule found a conformation that satisfied the restraints, not all trials did. A model was discarded immediately if the total restraint violations averaged to greater than 0.2 kcal/mol per nucleotide in the RNA. Of the ones that remained, 25–27 structures in all cases, a correlation was observed between the quality of resulting structures and both a large radius of gyration and a large number of contacts between bases (Figure 2). This correlation was initially observed when modeling the SRP RNA, HCV IRES, hammerhead ribozyme, and tRNAPhe and then subsequently applied to structure prediction with the modeling P4-P6 domain of the group I intron. Higher quality structures are those with low root mean square deviation (RMSD) relative to the crystal structure and a high accuracy of base-base contacts. A base-base contact is defined as two bases with centers of mass less than 6.5 Å apart, regardless of orientation. This is somewhat more lenient than the Watson-Crick base pairs in the crystal structures of the molecules studied here, which have an average COM distance between bases of 5.9 ±0.3 Å. This cutoff distance also includes contacts between a given paired purine and a paired purine on the opposite strand of two stacked base pairs.
Figure 2.

Pairs of plots showing the heavy-atom RMSDs (left) and sensitivities (right) as a function of radius of gyration and total number of base-base contacts of all decoy structures for (a) yeast tRNAPhe (b) the Alu domain of the Mammalian SRP (c) the hammerhead ribozyme, (d) the HCV IRES (e) the P4-P6 domain of the Tetrahymena group I intron folded with traditional tertiary restraints, and (f) the P4-P6 domain of the Tetrahymena group I intron folded with traditional and MOHCA tertiary restraints. Results from simulations of the crystal structures are marked with asterisks. If two or more resulting structures had both their total contact numbers and their radii of gyration corresponding to the same region in the plot, their RMSDs and sensitivities were averaged. White indicates regions where there were no decoys with a combination of contact number and radius of gyration. The tendency for the best structures to have both a high number of contacts and a large radius of gyration is somewhat less pronounced for the hammerhead ribozyme, but the best structure still had the highest score given the scoring function. This is consistent with the results of running five independent simulations of the crystal structures of the tRNAPhe, SRP Alu domain, the HCV IRES and the P4-P6 domain of the group I intron. The radii of gyration, total numbers of contacts, RMSDs, and sensitivities of each were averaged, plotted along with the decoys and marked with an asterisk. The RMSD plot for the HCV IRES does not show a correlation due to the alternate accessible conformation seen in the predicted structure. However, its sensitivity plot does show a trend for high sensitivity structures to have a high Rg and a high number of contacts.
To test the significance of these two factors, linear regression using both variables to either RMSD or sensitivity was performed. The slopes were found to be significantly different than zero (p < 0.05) for at least RMSD or sensitivity for all molecules using a t-test (Table I).
Table I.
Assessment of the statistical significance of the correlation of radius of gyration, total number of contacts, and the scoring function presented in this work with RMSD and sensitivity. The p-value of the t-distribution for the null hypothesis is reported. For radius of gyration and total number of contacts, a single linear regression to either sensitivity or RMSD was performed. For the scoring function, a separate regression was performed to either sensitivity or RMSD. The null hypothesis was that the slope for a given independent variable was not different from zero and this was tested using a one-tailed t-test on the slope and the standard error of the slope. Large radii of gyration and a large number of contacts correlate with at least one of a low RMSD and a large sensitivity with significance (p < 0.05) for all molecules. The scoring function correlates with both RMSD and sensitivity for all molecules with the exception of the RMSD of the HCV IRES RNA
| SRP Alu Domain | HCV IRES | Hammerhead ribozyme | Yeast tRNAPhe | Group I P4-P6 Domain | P4-P6 with MOHCA | |
|---|---|---|---|---|---|---|
| p-value. of Rg for RMSD | 0.004 | 0.13 | 0.02 | 8×10⁻⁶ | 2×10⁻⁶ | 0.002 |
| p-value of Rg for sensitivity | 0.06 | 0.005 | 0.18 | 0.007 | 0.05 | 0.29 |
| p-value of total contacts for RMSD | 0.14 | 0.47 | 0.03 | 0.19 | 0.45 | 0.02 |
| p-value of total contacts for sensitivity | 2×10⁻⁵ | 0.008 | 0.03 | 0.0001 | 6×10⁻⁵ | 2×10⁻⁵ |
| p-value of score for RMSD | 0.03 | 0.24 | 0.004 | 0.0001 | 0.0006 | 0.0007 |
| p-value of score for sensitivity | 0.002 | 0.0004 | 0.02 | 6×10⁻⁶ | 6×10⁻⁵ | 0.004 |
The maximization of radius of gyration is in direct contrast to prior observation with proteins, which tend to form maximally-compact structures with low radii of gyration.29 This can be explained by the fact the helical nature of RNA and the strong repulsion of the phosphate groups does not tend to produce maximally-compact structures. Maximizing radius of gyration is clearly not a good means of finding well-folded RNAs in general, as that would lead to the selection of linear structures. A large radius of gyration, however, in the context of satisfying restraints derived from the secondary structure, covariation, and chemical crosslinking, selects for structures with well-organized helical regions.
To further demonstrate the significance of these variables, the crystal structures of the SRP Alu domain, the hammerhead ribozyme, tRNAPhe, and the P4-P6 domain of the group I intron were simulated in Generalized Born implicit solvent for 1 ns at 300 K, cooled to 0 K over 750 ps, and then finished with a minimization in Poisson-Boltzman implicit solvent.24,27,28 Five independent calculations were run, and the average resulting radii of gyration, total base-base contacts, and RMSDs were plotted along with the corresponding predicted decoys in Figure 2 and marked with an asterisk. These structures tended to have higher radii of gyration and more contacts than even the best decoys. The HCV IRES was not simulated in this manner, as there are a number of disordered bases that do not appear in the crystal structure, and the bases involved in dimerization made this molecule even more unsuitable for this analysis.
Given the observed correlations, the molecules were scored according to a scheme taking into account a normalized radius of gyration and a normalized number of contacts as below:
In the above equation, Si denotes the score of structure i, Rg denotes the radius of gyration and c denotes the total number of contacts between bases, and max and min denote the maximum and minimum values for Rg and c for the sample of structures that satisfied the restraints. Scores can range from a maximum of two to a minimum of zero, and the structure with the highest score was selected as the best single prediction. This score places equal weight on base-base contacts and radius of gyration. This keeps the analysis deliberately simple and also avoids extrapolating weights from too little data. Even though this scoring system favors a large radius of gyration, mis-folded structures are still selected against. First, those that did not satisfy the restraints were discarded, which ensures a relatively high degree of compaction, and by additionally favoring structures with many contacts in the score, structures that have not formed favorable contacts were further disfavored. The scoring function shows a statistically significant correlation (p < 0.05) for all molecules considered for both RMSD and sensitivity, with the exception of the RMSD of the HCV IRES (Table I). This is understandable, because an ambiguity in the orientation of two domains for the structure prediction (see below) adversely affects RMSD but not sensitivity as a measure of structure quality.
The Alu domain of the mammalian signal recognition particle (SRP) RNA
The smallest RNA structure modeled in this study is the 50 nucleotide (nt) long Alu domain of the SRP (PDB 1E8O); it is also the structure predicted most accurately (Figure 3).18 For this molecule, two tertiary restraints were enforced. The first was the coaxial stacking of the three-way helical junction, which is correctly predicted using nearest neighbor-predicted free energy changes.14 The second, a distance restraint was placed on a pair of bases that co-vary, one in each loop, based on a two-column covariation analysis of the seed alignment from the Rfam database.30,31
Figure 3.

The Alu domain of the mammalian signal recognition particle. Panel (a) shows the crystal structure (PDB 1E8O), (b) is the predicted structure of the molecule, and (c) is an overlay of the crystal structure (red) and the predicted structure (blue). Structure images were generated using PyMOL.44
In the predicted structure with highest score, the RMSD relative to the crystal structure is 5.00 Å for all heavy atoms, and for the accuracy of contacts, the prediction has a sensitivity of 0.85 and a PPV of 0.82 (Table I). Among the contacts that were not restrained, the prediction has a sensitivity of 0.73 and a PPV of 0.64. While the exact shape of the loop regions in the predicted structure is not perfect, no attempt was made to enforce their shape other than with the aid of the AMBER ff99 force field.
The predicted structure in this case has the lowest RMSD and the highest sensitivity in the resulting pool of decoy structures. A number of structures were obtained with the helical stack and the third helix rotated nearly 360 degrees relative to each other about the unpaired nucleotides in the junction connecting them. As there were no restraints on the backbone torsions of the unpaired nucleotides in the helical junction, it is impossible to prevent this conformation from occasionally occurring in the decoys, as both are accessible to the force field. The twisted conformation, however, tends to have a lower radius of gyration and make fewer base-base contacts, particularly between the loops, so such structures were ruled out and the correct ones identified automatically.
Hepatitis C virus internal ribosomal entry site (IRES)
For the modeling of the 53 nt hepatitis C IRES RNA (PDB 1KH6), two coaxial stacks were enforced (Figure 4).19 These were correctly predicted by nearest neighbor analysis.14 No co-varying bases were identified in this molecule using the seed alignment from Rfam.31 Therefore, there was an ambiguity in the relative orientation of the two domains. The predicted structure has the relative orientation of the two domains flipped by 180 degrees relative to the crystal structure, even though the envelope of the structure overlays nicely with the crystal structure.
Figure 4.

The hepatitis C virus internal ribosomal entry site. Panel (a) shows the crystal structure of the molecule (PDB 1KH6), (b) is the predicted structure of the molecule, and (c) is an overlay of the crystal structure (red) and the predicted structure (blue). Bases that were disordered or that were involved in dimerization in the crystal structure were omitted from the figure and from the calculation of the RMSD, sensitivity, and PPV, even though they were present in the simulations.
In the crystal, this molecule forms a dimer due to crystal packing forces.19 As such, bases 42–45 were excluded from the RMSD calculation because they are in a loop in the monomer, but base paired in the dimer. Additionally, bases 11–15, which were disordered in the crystal, are excluded. The RMSD of the predicted structure is 13.35 Å, a consequence of the two domains being incorrectly oriented. On the other hand, the two domains separately have RMSDs of 2.51 Å for the helix III-helix IIIc domain and 3.99 Å for the helix IIIa-helix IIIb domain, using the nomenclature of Kieft et al.19 In the set of decoys, many structures had better RMSDs for the whole molecule, as low as 6.47 Å, but the fact that this structure had the most base-base contacts of any in the pool led to the selection of it as the prediction. The predicted structure did have a high sensitivity for all contacts and for unforced contacts, 0.88 and 0.75 respectively, along with respective PPVs of 0.90 and 0.71 (Table I).
In the crystal structure, the helices are held in their orientation by two unpaired adenines, 154 and 155 using the numbering of the crystal structure. They form hydrogen bonds between their N1 atoms and the 2′ hydroxyls of A173 and A172 respectively. This type of base-backbone cannot be identified by the two-column co-variation analysis performed here. Indeed, such an interaction is more likely to be preserved in evolution by sequence conservation at these positions rather than co-variation, although this is difficult to ascertain because of the high degree of sequence identity at all positions in all the HCV IRES sequences in Rfam.31
Hammerhead ribozyme
For the hammerhead ribozyme, the prediction was compared to the structure solved by Martick and Scott (PDB 2GOZ).17 For the hammerhead ribozyme, there is no alignment from which co-variations could be identified, nor is the coaxial helical stack one that can be predicted by free energy minimization because it is mediated by too many non-canonical base pairs. Instead, the enforced restraints were based on the photocrosslinking experiments of Heckman et al.32 Their data require U30 and U56, G20 and C50, A21 and C50, U16 and U19, and G36 and C49 to be within 6.5 Å of each other so as to either stack or form an edge-edge interaction. Using these and the secondary structure as restraints, the predicted structure had an RMSD of 5.98 Å, a sensitivity of 0.76, and a PPV of 0.76 (Figure 5, Table I). This was again the structure with the lowest RMSD and the highest sensitivity in the pool of decoys. One feature observed in decoys that did not accurately match the crystal structure was that the interaction between U30 in the hairpin loop at the end of domain II and U56 in the internal loop of domain I was sometimes mediated in the minor groove of domain I rather than the major groove. Such decoys, however, made fewer total contacts and/or did not satisfy all of the enforced restraints, hence they were discarded on a basis of a lower score or the restraint satisfaction criterion.
Figure 5.

The full-length hammerhead ribozyme. Panel (a) shows the crystal structure of the molecule (PDB 2GOZ), (b) is the predicted structure of the molecule, and (c) is an overlay of the crystal structure (red) and the predicted structure (blue).
Saccharomyces cerevisiae tRNAPhe
A structure was predicted for the 76-nucleotide Saccharomyces cerevisiae tRNAphe and compared to the crystal structure from Shi and Moore (PDB 1EHZ).20 Although this RNA is subject to post-transcriptional modification in vivo, it has been shown to fold correctly without modifications in vitro.33 Four restraints were enforced in addition to the secondary structure. The coaxial stacks between the acceptor stem and T stem and between the anticodon stem and the D stem were restrained because they are correctly predicted by free energy minimization.14 Additionally, distance restraints between G19 and C56, and between G15 and C48 were included because they are identified with co-variation using the mature tRNA alignment from the Sprinzl database.34 The resulting predicted structure has an RMSD of 8.58 Å (Figure 6). This is not the lowest RMSD of any decoy structure. Instead, the second-highest scoring structure was the one with the lowest RMSD, although the predicted structure has the highest sensitivity, 0.75, and with a PPV of 0.75 (Table I). The RMSD is mainly hampered by some inaccuracy in the unrestrained D loop which propagates to a slight twist of the anticodon/D stem stack relative to the crystal structure, although the envelope of the molecule is nearly identical.
Figure 6.
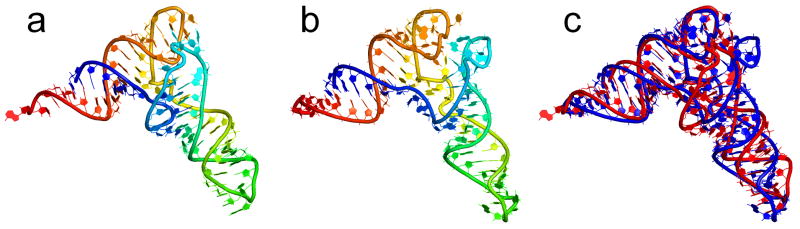
Sacchromyces cerevisiae tRNAPhe. Panel (a) shows the crystal structure of the molecule (PDB 1EHZ), (b) is the predicted structure of the molecule, and (c) is an overlay of the crystal structure (red) and the predicted structure (blue).
The P4-P6 Domain of the Tetrahymena Group I Intron
Two predictions were made for the 158-nucleotide group I intron P4-P6 domain (PDB 1GID).16 The first was made using only the tetraloop-tetraloop receptor and A-minor interactions that were identified prior to the structure being solved, in addition to the secondary structure.35,36 For the second, published restraints from the recent high-throughput contact mapping method MOHCA were additionally used.37 No coaxial stacks were predicted or enforced for the P5abc junction.
The resulting structure using only the tetraloop-tetraloop receptor and A-minor interactions had an RMSD of 15.8 Å (Figure 7). This was not the lowest RMSD structure among the decoys, but the four lowest RMSD decoys were the four highest scoring decoys, all featuring RMSDs between 14 and 16 Å. The sensitivity and PPV for this model are 0.68 and 0.76, respectively. Inaccuracies in this prediction are dominated by the P5c domain, which is rotated away from the core of the structure, and the 3′ end, which is involved in a triple helix in the crystal structure. Interactions positioning these parts of the molecule were not identified by co-variation analysis. Also, the P4 and P6 domains did not stack coaxially as they do in the crystal structure. The stack is mediated by more than one non-canonical pair in the crystal structure, so it cannot be predicted by the method of Tyagi and Mathews.14 The average of the radii of gyration from short simulations of the crystal is somewhat smaller compared to the pool of decoys (Figure 2e), unlike how the other pools of decoys compared to the crystal structures. The average is about equal to the average radius of gyration of the decoys rather than being larger. This system, however, is more than twice as large as any other molecule used in this work, and the predictions are based on fewer tertiary restraints, so a failure to organize into a compact structure is not unexpected. Yet, the decoys with higher radii of gyration were still among the most accurate decoys, even if they were larger than the crystal structure.
Figure 7.

P4-P6 domain of the Tetrahymena group I intron. Panel (a) shows the crystal structure of the molecule (PDB 1GID), (b) is the predicted structure of the molecule, and (c) is an overlay of the crystal structure (red) and the predicted structure (blue).
The second prediction, using the restraints above and restraints determined by MOHCA, has an RMSD of 13.3 Å (Figure 8). The sensitivity and PPV for this model are 0.68 and 0.75, respectively. The highest-scoring structure was the lowest in RMSD. MOCHA data were able to correct issues with the orientation of the P5c helix, but stacking between P4 and P6 did not occur, nor did the triple helix form. This pool of decoys was also more compact than the pool run without the additional data, and was more compact compared to the crystal structure.
Figure 8.

P4-P6 domain of the Tetrahymena group I intron, supplemented with MOHCA data. Panel (a) shows the crystal structure of the molecule (PDB 1GID), (b) is the predicted structure of the molecule, and (c) is an overlay of the crystal structure (red) and the predicted structure (blue).
Using only the secondary structure
To test the importance of the tertiary contact restraints and predicted coaxial helical stacks, a corresponding set of 32 decoys was generated for each molecule enforcing only restraints from the known secondary structure (Table II). In every case, except the HCV IRES, the quality of the both the best and the average decoy was lower than the best and average predictions using more data. In the case of the IRES, however, one structure formed with a lower RMSD than the prediction from the more-heavily restrained pool. The HCV IRES is highly base paired, and the only additional restraints that were used were coaxial stacks between neighboring helices. These conformations are more likely to be sampled in a simulated annealing run given their inherent close proximity in the primary sequence than other sorts of tertiary contacts between distant bases that are enforced in the other structures in this study.
Table II.
Summary of quality of structure statistics for predicted structures relative to the crystal structures. Mean and best values from the decoys refer only to the set of structures from the pools that satisfied the given restraints
| Predicted Structure | SRP Alu Domain | HCV IRES | Hammerhead ribozyme | Yeast tRNAPhe | Group I P4- P6 Domain | P4-P6 with MOHCA |
|---|---|---|---|---|---|---|
| Heavy Atom RMSD (Å) | 5.00 | 13.4 | 5.98 | 8.58 | 15.8 | 13.3 |
| Sensitivity | 0.85 | 0.88 | 0.76 | 0.75 | 0.69 | 0.69 |
| PPV | 0.82 | 0.90 | 0.76 | 0.75 | 0.76 | 0.75 |
| Total Contacts | 84 | 90 | 105 | 122 | 251 | 257 |
| Rg (Å) | 17.6 | 20.0 | 20.2 | 24.1 | 37.4 | 29.6 |
| Score | 1.59 | 1.88 | 1.49 | 1.86 | 1.75 | 1.75 |
| Unforced Contacts | 39 | 37 | 49 | 64 | 118 | 126 |
| Unforced Sens. | 0.74 | 0.74 | 0.58 | 0.56 | 0.47 | 0.48 |
| Unforced PPV | 0.64 | 0.71 | 0.57 | 0.53 | 0.58 | 0.56 |
|
|
||||||
| Decoy Statistics | ||||||
|
|
||||||
| Most Contacts | 88 | 90 | 109 | 124 | 258 | 260 |
| Mean Contacts | 77.7 | 84.3 | 96.3 | 115.7 | 245.9 | 246.8 |
| Largest Rg (Å) | 18.1 | 23.0 | 22.9 | 24.3 | 37.4 | 30.2 |
| Mean Rg (Å) | 17.1 | 19.0 | 20.0 | 22.9 | 32.7 | 28.2 |
| Best RMSD | 5.00 | 6.47 | 5.98 | 8.58 | 14.2 | 13.3 |
| Mean RMSD | 10.1 | 9.54 | 19.7 | 11.6 | 18.5 | 18.9 |
| Best Sensitivity | 0.85 | 0.89 | 0.77 | 0.75 | 0.73 | 0.69 |
| Mean Sensitivity | 0.79 | 0.84 | 0.69 | 0.69 | 0.68 | 0.67 |
| Best PPV | 0.88 | 0.92 | 0.84 | 0.77 | 0.80 | 0.80 |
| Mean PPV | 0.83 | 0.89 | 0.76 | 0.72 | 0.77 | 0.76 |
DISCUSSION
Using the outlined methodology, all-atom modeling of large RNAs featuring helical junctions has been automated. This was done by taking advantage of the hierarchical nature of RNA structure, the restraints put on available conformations by coaxial stacking, and tertiary contacts that can be identified in a sequence alignment or by low-resolution experiments. This predicted structures with RMSDs as good as 5 Å, and with sensitivities and PPVs of at least 0.75. Recent work suggests that these predictions are highly significant and indicative of high-quality and useful models.38 The coordinates of all the highest-scoring decoys are available for download at http://rna.urmc.rochester.edu.
The restraints involving planes are now in AMBER 10. These include are a novel restraint on the angle between the normal vectors of two planes. These restraints were crucial in this study for restraining base pair stacks and helical coaxial stacks. Most base-base interactions in nucleic acids involve specific angles between the planes of the bases involved. For example, canonical pairs, non-canonical pairs and base-triple interactions all involve two or three bases that are roughly in the same plane, and base stacking interactions also tend to be between bases that are parallel or anti-parallel.39
To identify a single prediction from the set of decoys, a score was employed to select structures with both many base-base contacts and high radius of gyration. This score seems to be a reasonable method for selecting those structures that are more RNA-like than the simulated annealing restraints enforced alone. The score does not always rank-order the structures by RMSD perfectly, but in pools of this size, the best structures, which are of greatest interest, tend to rise to the top. This is also supported by the fact that the score correlates significantly with the evaluation measures (Table I). The maximization of radius of gyration appears to select for structures with helices properly organized. Future work could focus on determining an alternative measure of helix organization that reflects the correct organization as observed in crystal structures or on the relative importance of radius of gyration versus base-base contacts.
While simulated annealing is a familiar means of searching for structures low in energy, it can be computationally expensive, particularly in an all-atom simulation. By using well-chosen restraints, however, a structure can be built in a reasonable amount of time, approximately 3.5 days per decoy on when running on twelve 2.2 GHz AMD Opteron 2427 cores for the P4-P6 domain of the Tetrahymena group I intron, even starting with a conformation far from the minimum energy structure. Furthermore, the “soft core” scaling of the van der Waals potentials used here allows all non-bonded forces to be turned off during the first half of the simulation and cuts the computational cost by approximately a factor of two. Also, running initially without non-bonded forces prevents the molecule from getting caught in steric traps en route to finding a conformation that satisfies the restraints derived from the secondary structure, reducing the number of simulations that need to be run to find models that satisfy the given restraints. Restoring the van der Waals forces according to the soft core equation prevents the numerical instability and the interlocking ring problem that would otherwise occur when restoring the non-bonded forces.15
The models built using this method are not perfect. Many of the loop regions in the RNAs are inaccurate: the bases in these regions sometimes make incorrect contacts or no contacts at all, backbone torsions sometimes form high-energy kinks, and hydrogen bonds are sometimes missing. Because no restraints are being enforced on the non-canonical pairs, this is to be expected. The method here relies on an adequate simulation time to generate a conformation at the minimum free energy of the force field. Furthermore, the force field itself is imperfect, so it is not certain that it would even tend to accurately tend towards the correctly-detailed structure. An immediate improvement to this method is apparent: approaches such as that in MC-Fold that focus on accurate predictions in the local conformations of unpaired nucleotides or non-canonical pairs can readily supply further restraints for the method.4 This method is especially extendable to employ whatever biochemical or bioinformatics restraints are available. The P4-P6 domain structure showed noticeable improvement when the data from MOHCA was added, even if the prediction without MOHCA data was still a high quality model.
The model building is automated, so it substitutes significant computational cost for what was previously done with human time cost. Running without non-bonded forces at the beginning of the protocol saves significant time, but significant simulation time is still spent. In the future, alternative conformational search methods could be used. Advanced search methods, such as potential energy smoothing and distance-based construction, are available and these could be used without sacrificing the all-atom resolution used here.40,41
METHODS
Restraints
All restraints were flat-bottomed energy wells with parabolic sides. Force constants were 10 kcal · mol−1 · Å−2 for distances and 10 kcal · mol−1 · rad−2 for angles. The energy function for the planar restraints was:
where xn are the coordinates of atom n used to define the planes and θ0 is the equilibrium angle between the normals to the planes. Atoms one through four define the first plane, and atoms five through eight define the second. This restraint may use four atoms to define each plane as shown, or it may use three, if atoms 2 and 4 are specified as the same atom. The plane of a purine was defined by the N9, N1, N3, and N7 atoms as atoms one through four, respectively, and the plane of a pyrimidine by the C4, N1, C2, and C6 atoms, respectively.
For bases involved in pairs, the α, β, γ, ε, and ζ backbone torsion restraint wells were centered on ideal A-form values with a 15° flat bottom on either side.25 The δ torsion was unrestrained, as the force field keeps it near its ideal value without any additional restraint.25 Hydrogen bonding pairs were restrained by a distance restraint between the donor hydrogen and the acceptor heavy atom with a flat bottom between 1.6 and 2.0 Å and parabolic sides. Planarity of paired bases was restrained such that the angle between the plane of the purine and the plane of the pyrimidine was at least 160° (a flat bottom of the well between 160° and 180°) with a parabolic restraint as above for smaller angles. This value was determined from measuring the angle between the planes in complementary A-form duplexes from Nucleic Acid Builder and verifying that this range was consistent with the crystal structures in question.16–20,26 The choice of flat-bottomed wells instead of harmonic wells accounts for uncertainty in measurement as well as allowing the force field to adjust the positions of restraint atoms slightly away from ideal values based on its own energy.
Stacked base pairs had both their relative distances and their plane angles restrained. The center of mass of each pair, defined its C1′ atoms, the C6 atom, and the C8 atom, were within 4.5 Å of each other with a parabolic restraint for larger distances. For the plane angles, the bases 3′ to the pair on each strand, which are the two bases most closely stacked on one another in neighboring base pairs, are restrained to be at least 160° with a parabolic restraint for smaller angles.
The coaxial stacking configuration of junctions were predicted by free energy minimization.14 Restraints for enforcing coaxial stacking were based on rules for identifying coaxial stacks. “Flush” stacks, with no intervening base pairs, were held with the centers of mass of the pairs within 4.5 Å, with a parabolic restraint for larger distances and the planes of the 3′ bases restrained to be at least 160° with a parabolic restraint for smaller angles (these bases are on opposite strands of a helix, and thus their normal vectors should be roughly anti-parallel). “Mismatch-mediated” stacks were held at 12 Å or closer and with the angles between the planes of the 3′ bases at least 150°.
Distance restraints between bases that make contacts identified either through covariation or biochemical data were enforced as requiring the centers of mass of the two bases to be within 7.5 Å. Restraints from MOHCA data were enforced using a flat-bottomed harmonic well requiring the C4′ atoms of the two bases within 25 Å, as in the work first describing the method.37
A program, ct2rst, was written to output an AMBER-format restraint file using the input of a ct file containing a secondary structure and, if desired, a file with user-defined co-variation and coaxial stacking interactions. This program is available at http://rna.urmc.rochester.edu.
“Soft Core” van der Waals potential scaling
Van der Waals scaling was performed with soft core potentials.15 Parameter λ is scaled from zero to one over the course of 500 ps according to:
where r is the inter-atomic distance, ε and σ are the well depth and x-intercept, respectively, of the Lennard-Jones potential, and α is an arbitrary parameter setting the smoothness of the transition, which is set to 0.5 for this work. The code was modified to allow smooth scaling of λ over a user-specified timeframe.
Co-variation
Co-variation in a sequence alignment was determined according to the method of Gutell et al.30 A co-variation restraint is applied if two bases are in columns with maximal co-variation with each other.
Simulated Annealing
The AMBER ff99 force field was used with a 1 fs time step when the system was above 300 K or a 2 fs time step when below 300 K. SHAKE was used in both cases for bonds to hydrogens.42 All simulations were performed in Generalized Born implicit solvent except the final minimization, which was in Poisson-Boltzmann implicit solvent.22–24,27,28
Initial structures were created as A-form duplexes using Nucleic Acid Builder, with one strand being the sequence of interest and the other being its exact complement.26 The complementary strand was then deleted.
Simulations began by heating the system to 1000 K over 250 ps with nonbonded forces off. In the second step, the restraints from the secondary structure were turned on by scaling the force constants from zero to their final values linearly over 2 to 2.5 ns, as indicated in Table II. First, restraints on bases closer in sequence than 40 nts were turned on, and then those for more distant pairs to avoid overly large forces from these restraints and to promote hierarchical structure formation. For the third and fourth steps, the van der Waals forces were restored with soft core over 250 ps, followed by restoration of the electrostatic forces linearly over 250 to 500 ps. In the fifth step, restraints on helical stacking and tertiary interactions were turned on over the course of 0.5 to 1 ns, again with longer times for the larger, more complicated systems. Finally, in the sixth and seventh steps, the system was cooled to 0 K over the course of 2.5 ns, depending on the system size, and ultimately minimized using Poisson-Boltzmann implicit solvation.27,28
Supplementary Material
Table III.
Summary of quality of structure statistics for predicted structures relative to the crystal structures for models assembled with secondary structure restraints only. Mean and best values from the decoys refer only to the set of structures from the pools that satisfied the given restraints
| Secondary Structure only | SRP Alu Domain | HCV IRES | Hammerhead ribozyme | Yeast tRNAPhe | Group I P4-P6 Domain |
|---|---|---|---|---|---|
| Best RMSD | 13.28 | 4.76 | 13.95 | 9.3 | 23.38 |
| Mean RMSD | 17.28 | 11.86 | 20.64 | 15.5 | 40.94 |
| Best Sensitivity | 0.83 | 1 | 0.74 | 0.75 | 0.71 |
| Mean Sensitivity | 0.76 | 83 | 0.68 | 0.70 | 0.68 |
| Best PPV | 0.91 | 0.94 | 0.83 | 0.80 | 0.83 |
| Mean PPV | 0.81 | 0.87 | 0.74 | 0.75 | 0.78 |
Table IV.
Summary of simulation times for each simulated annealing stage per decoy of each molecule. Stages refer to the point in the protocol during which restraints (rsts) are being gradually enforced, forces are being restored, or the system is being heated or cooled. All times are in ns. The far base pair cutoff is the distance in number of nucleotides between two bases in a pair before they are considered “far” and designated for activation later in the protocol.
| Simulation Stage | SRP Alu Domain (ns) | HCV IRES (ns) | Hammerhead ribozyme (ns) | Yeast tRNAPhe (ns) | Group I P4-P6 Domain (ns) | P4-P6 with MOHCA (ns) |
|---|---|---|---|---|---|---|
| Heating | 0.25 | 0.25 | 0.25 | 0.25 | 0.25 | 0.25 |
| Near base pair rsts. | 1 | 1 | 1 | 1 | 1 | 1 |
| Far base par rsts. | 1.5 | 1 | 1 | 1 | 1 | 1 |
| VDW forces | 0.25 | 0.25 | 0.25 | 0.25 | 0.25 | 0.25 |
| Electrostatics | 0.5 | 0.25 | 0.25 | 0.25 | 0.25 | 0.25 |
| MBL & 3° rsts | 0.5 | 1 | 0.5 | 1 | 1 | 1 |
| Cooling | 2.5 | 2.5 | 2.5 | 2.5 | 3.25 | 3.25 |
|
| ||||||
| Total simulation time per decoy (ns) | 6.5 | 6.25 | 5.75 | 6.25 | 7 | 7 |
|
| ||||||
| Far base pair cutoff | 40 | 40 | 40 | 40 | 40 | 40 |
Acknowledgments
The authors thank Alan Grossfield, Tod Romo, and Harry Stern for conversations. This work was funded by National Institutes of Health grant R01 HG004002 to DHM. Computer time was made available by the University of Rochester Center for Research Computing.
Footnotes
Analysis of contacts
A program called rnanativecontacts was written to analyze which bases were in contact in the decoy and native structures. The program was written using the LOOS platform and is available at http://rna.urmc.rochester.edu.43 For the calculation of “unforced” contacts, contacts between a base and its partner if that base is paired, between it the next base in the sequence if that next base is also paired, between it and the base pair partner of the next base in the sequence, and between bases that are restrained to have a tertiary contact are removed from the calculations of sensitivity and PPV.
References
- 1.Michel F, Westhof E. J Mol Biol. 1990:216. doi: 10.1016/0022-2836(90)90386-Z. [DOI] [PubMed] [Google Scholar]
- 2.Guo F, Gooding AR, Cech TR. Mol Cell. 2004:16. doi: 10.1016/j.molcel.2004.10.003. [DOI] [PubMed] [Google Scholar]
- 3.Tinoco I, Jr, Bustamante C. J Mol Biol. 1999:293. doi: 10.1006/jmbi.1999.3001. [DOI] [PubMed] [Google Scholar]
- 4.Parisien M, Major F. Nature. 2008:452. doi: 10.1038/nature06684. [DOI] [PubMed] [Google Scholar]
- 5.Das R, Baker D. Proc Natl Acad Sci USA. 2007:104. [Google Scholar]
- 6.Sharma S, Ding F, Dokholyan NV. Bioinformatics. 2008:24. doi: 10.1093/bioinformatics/btn328. [DOI] [PMC free article] [PubMed] [Google Scholar]
- 7.Ding F, Sharma S, Chalasani P, Demidov VV, Broude NE, Dokholyan NV. RNA. 2008;14:1164. doi: 10.1261/rna.894608. [DOI] [PMC free article] [PubMed] [Google Scholar]
- 8.Jonikas MA, Radmer RJ, Laederach A, Das R, Pearlman S, Herschlag D, Altman RB. RNA. 2009;15:189. doi: 10.1261/rna.1270809. [DOI] [PMC free article] [PubMed] [Google Scholar]
- 9.Malhotra A, Harvey SC. J Mol Biol. 1994;240:308. doi: 10.1006/jmbi.1994.1448. [DOI] [PubMed] [Google Scholar]
- 10.Tan RKZ, Petrov AS, Harvey SC. J Chem Theory Comput. 2006;2:529. doi: 10.1021/ct050323r. [DOI] [PMC free article] [PubMed] [Google Scholar]
- 11.Jonikas MA, Radmer RJ, Altman RB. Bioinformatics. 2009;25:3259. doi: 10.1093/bioinformatics/btp576. [DOI] [PMC free article] [PubMed] [Google Scholar]
- 12.Massire C, Westhof E. J Mol Graph Model. 1998;16:197. doi: 10.1016/s1093-3263(98)80004-1. [DOI] [PubMed] [Google Scholar]
- 13.Martinez HM, Maizel JV, Jr, Shapiro BA. J Biomol Struct Dyn. 2008;25:669. doi: 10.1080/07391102.2008.10531240. [DOI] [PMC free article] [PubMed] [Google Scholar]
- 14.Tyagi R, Mathews DH. RNA. 2007;13:939. doi: 10.1261/rna.305307. [DOI] [PMC free article] [PubMed] [Google Scholar]
- 15.Steinbrecher T, Mobley DL, Case DA. J Chem Phys. 2007;127:214108. doi: 10.1063/1.2799191. [DOI] [PubMed] [Google Scholar]
- 16.Cate JH, Gooding AR, Podell E, Zhou K, Golden BL, Kundrot CE, Cech TR, Doudna JA. Science. 1996:273. doi: 10.1126/science.273.5282.1678. [DOI] [PubMed] [Google Scholar]
- 17.Martick M, Scott WG. Cell. 2006;126:309. doi: 10.1016/j.cell.2006.06.036. [DOI] [PMC free article] [PubMed] [Google Scholar]
- 18.Weichenrieder O, Wild K, Strub K, Cusack S. Nature. 2000;408:167. doi: 10.1038/35041507. [DOI] [PubMed] [Google Scholar]
- 19.Kieft JS, Zhou K, Grech A, Jubin R, Doudna JA. Nat Struct Mol Biol. 2002;9:370. doi: 10.1038/nsb781. [DOI] [PubMed] [Google Scholar]
- 20.Shi HJ, Moore PB. RNA. 2000;6:1091. doi: 10.1017/s1355838200000364. [DOI] [PMC free article] [PubMed] [Google Scholar]
- 21.Case DA, Darden T, III, TEC, Simmerling C, Wang J, Duke RE, Luo R, Crowley M, Walker R, Zhang W, Merz KM, Wang B, Hayik S, Roitberg A, Seabra G, Kolossváry I, Wong KF, Paesani F, Vanicek J, Wu X, Brozell SR, Steinbrecher T, Gohlke H, Yang L, Tan C, Mongan J, Hornak V, Cui G, Mathews DH, Seetin MG, Sagui C, Babin V, Kollman PA. University of California. San Francisco: 2008. [Google Scholar]
- 22.Hawkins GD, Cramer CJ, Truhlar DG. Chem Phys Lett. 1995;246:122. [Google Scholar]
- 23.Hawkins GD, Cramer CJ, Truhlar DG. J Phys Chem. 1996;100:19824. [Google Scholar]
- 24.Tsui V, Case DA. Biopolymers. 2001;56:275. doi: 10.1002/1097-0282(2000)56:4<275::AID-BIP10024>3.0.CO;2-E. [DOI] [PubMed] [Google Scholar]
- 25.Richardson JS, Schneider B, Murray LW, Kapral GJ, Immormino RM, Headd JJ, Richardson DC, Ham D, Hershkovits E, Williams LD, Keating KS, Pyle AM, Micallef D, Westbrook J, Berman HM. RNA. 2008;14:465. doi: 10.1261/rna.657708. [DOI] [PMC free article] [PubMed] [Google Scholar]
- 26.Macke T, Case DA. In: Molecular Modeling of Nucleic Acids. Leontes NB, SantaLucia J, editors. American Chemical Society; Washington, DC: 1998. pp. 379–393. [Google Scholar]
- 27.Luo R, David L, Gilson MK. J Comput Chem. 2002;23:1244. doi: 10.1002/jcc.10120. [DOI] [PubMed] [Google Scholar]
- 28.Lu Q, Luo R. J Chem Phys. 2003;119:11035. [Google Scholar]
- 29.Richards FM. Annu Rev Biophys Bioeng. 1977;6:151. doi: 10.1146/annurev.bb.06.060177.001055. [DOI] [PubMed] [Google Scholar]
- 30.Gutell RR, Power A, Hertz GZ, Putz EJ, Stormo GD. Nucleic Acids Res. 1992;20:5785. doi: 10.1093/nar/20.21.5785. [DOI] [PMC free article] [PubMed] [Google Scholar]
- 31.Griffiths-Jones S, Bateman A, Marshall M, Khanna A, Eddy SR. Nucleic Acids Res. 2003;31:439. doi: 10.1093/nar/gkg006. [DOI] [PMC free article] [PubMed] [Google Scholar]
- 32.Heckman JE, Lambert D, Burke JM. Biochemistry. 2005;44:4148. doi: 10.1021/bi047858b. [DOI] [PubMed] [Google Scholar]
- 33.Hall KB, Sampson JR, Uhlenbeck OC, Redfield AG. Biochemistry. 2002;28:5794. doi: 10.1021/bi00440a014. [DOI] [PubMed] [Google Scholar]
- 34.Sprinzl M, Horn C, Brown M, Ioudovitch A, Steinberg S. Nucleic Acids Res. 1998;26:148. doi: 10.1093/nar/26.1.148. [DOI] [PMC free article] [PubMed] [Google Scholar]
- 35.Murphy FL, Cech TR. J Mol Biol. 1994;236:49. doi: 10.1006/jmbi.1994.1117. [DOI] [PubMed] [Google Scholar]
- 36.Flor PJ, Flanegan JB, Cech TR. EMBO J. 1989;8:3391. doi: 10.1002/j.1460-2075.1989.tb08503.x. [DOI] [PMC free article] [PubMed] [Google Scholar]
- 37.Das R, Kudaravalli M, Jonikas M, Laederach A, Fong R, Schwans JP, Baker D, Piccirilli JA, Altman RB, Herschlag D. Proc Natl Acad Sci USA. 2008;105:4144. doi: 10.1073/pnas.0709032105. [DOI] [PMC free article] [PubMed] [Google Scholar]
- 38.Hajdin CE, Ding F, Dokholyan NV, Weeks KM. RNA. 2010;16:1340. doi: 10.1261/rna.1837410. [DOI] [PMC free article] [PubMed] [Google Scholar]
- 39.Leontis NB, Stombaugh J, Westhof E. Nucleic Acids Res. 2002;30:3497. doi: 10.1093/nar/gkf481. [DOI] [PMC free article] [PubMed] [Google Scholar]
- 40.Pappu RV, Hart RK, Ponder JW. J Phys Chem B. 1998;102:9725. [Google Scholar]
- 41.Hart RK, Pappu RV, Ponder JW. Biophys J. 1998;74:A176. [Google Scholar]
- 42.Ryckaert J, Ciccotti G, Berendsen HJC. J Comput Phys. 1977;23:327. [Google Scholar]
- 43.Romo TD, Grossfield A. 31st Annual International Conference of the IEEE EMBS; 2009. p. 2332. [DOI] [PubMed] [Google Scholar]
- 44.DeLano WL. DeLano Scientific LLC. Palo A., lto, CA, USA: 2008. [Google Scholar]
Associated Data
This section collects any data citations, data availability statements, or supplementary materials included in this article.