

Abstract
The zinc sensing transcriptional repressor Staphylococcus aureus CzrA represents an excellent model system to understand how metal sensor proteins maintain cellular metal homeostasis. Zn(II) binding induces a quaternary structural switch from a “closed” conformation to a more “open” conformation, reducing the DNA binding affinity by four orders of magnitude. In this study, we use classical molecular dynamics and quantum mechanical/molecular mechanical molecular dynamics simulations to investigate the molecular basis for the large conformational motions and allosteric coupling free energy (~6 kcal/mol) associated with Zn(II) binding. Our simulations successfully capture the closed to open allosteric switching in DNA bound CzrA on Zn(II) binding. They reveal that zinc binding quenches global conformational sampling by CzrA, whereas DNA binding enhances the mobility of residues in the allosteric the metal binding sites. These findings are in close agreement with experiments. We also identify networks of residues involved in correlated and anti-correlated motions that connect the metal binding and DNA binding sites. Our analysis of the essential dynamics shows metal ion binding to be the primary driving force for the quaternary structural change in CzrA. We also show that Zn(II) binding limits the conformational space sampled by CzrA, and causes the electrostatic surface potential at the DNA binding interface to become less favorable towards DNA binding. Finally, our simulations provide strong support for a proposed hydrogen-bonding pathway that physically connects the metal binding residue, His97, to the DNA binding interface through the αR helix that is present only in the Zn(II)-bound state. Overall, our simulations provide molecular-level insights into the mechanism of allosteric regulation by CzrA, and demonstrate the importance of protein motion in its biological activity.
1. Introduction
Though transition metal ions play an essential role in many cellular processes, they are extremely toxic at high concentrations. Metal ion homeostasis maintains the intracellular concentrations of these metal ions through a number of metal sensor proteins that regulate the expression of genes that encode specific transition metal efflux and sequestration proteins.1,2 Staphylococcus aureus CzrA (CzrA) is a Zn(II) and Co(II)-responsive transcriptional repressor that derepresses the czr operon upon binding of zinc or cobalt ions.3,4 Derepression of the czr operon increases expression of both czrA and czrB, the latter of which encodes a Zn(II)/Co(II) effluxer from the cation diffusion facilitator family, thereby reducing the metal ion concentration in the cytoplasm.5 CzrA is a homodimeric winged helix-turn-helix protein (Fig. 1).6 CzrA binds to DNA sequences harboring a conserved core sequence (5′-TGAAxxxxxxTTCA-3′) with 1010 M−1 affinity. It functions through a mechanism of allosteric negative regulation in which metal ion binding induces conformational changes that disrupt the distant DNA binding interface, leading to a low binding affinity for DNA and transcriptional derepression.7,8 CzrA is a member of the widely distributed ArsR/SmtB family of prokaryotic metal sensor proteins and as such provides an excellent model system to understand zinc homeostasis model in cell biology.6,9–12
Figure 1.

Cartoon depiction of the biologically active dimeric state of the protein bound to a palindromic DNA molecule. The Zn(II) ion binding α5 regions are shown in green, and the αR region is depicted in orange. The hydrogen-bonding pathway connecting the metal binding residue His97 to His67 of the αR helix is depicted besides the figure.
Crystallographic and NMR structural investigations have identified the distinct conformational states for the allosteric forms of CzrA, providing considerable insight into its mode of action.6,11 The allosteric forms of CzrA include the apo state (Apo•CzrA), the metal ion bound holo state with two Zn(II) ions (Zn2•CzrA), the DNA bound state (CzrA•DNA), and the ternary state in which the protein is bound to both Zn(II) ions and DNA (Zn2•CzrA•DNA) as shown in Figure 2. The X-ray crystallographic structures of Apo•CzrA (pdb code 1R1U) and Zn2•CzrA (pdb code 1R1V) are nearly identical, suggesting that either Zn(II) binding induces a relatively small change in the quaternary structure of Apo•CzrA or, alternatively, the structure of Apo•CzrA is influenced by crystal packing.6 In the Zn(II) bound allosteric forms, two Zn(II) ions bind to the dimeric interface at the anti-parallel α5 helices. At each metal binding site, one protomer contributes Asp84 and His86, while the other protomer contributes His97 and His100 towards the coordination of a Zn(II) ion (Fig. 3). While these residues are largely pre-arranged for metal ion binding in the crystal structure of apo-CzrA, dynamics experiments and chemical shift perturbations studies suggest that there is motional disorder in solution in this region of the molecule in this allosteric form.6,11 The solution structure of the apo-CzrA bound to DNA is also known (pdb code 2KJB) and documents a large quaternary structural conformational change in CzrA upon binding to DNA, but does not include the DNA in the structural model.11 The DNA binding region lies distal to the Zn(II) binding site and is characterized by the residues in α1, α2 and αR helices and the two β-wings. The structure of what is essentially a functional intermediate, the ternary structure of CzrA with both Zn(II) ions and DNA bound, remains to be solved. The interprotomer αR distance in the DNA binding interface differs by ~10 Å among the different allosteric states, roughly dividing them into “open” and “closed” conformations of the repressor. Zn2•CzrA exhibits the open conformation, while the closed conformation of CzrA is associated with the CzrA•DNA complex.
Figure 2.

The four allosteric forms of CzrA examined in this study, and the associated thermodynamic parameters of CzrA mechanism are depicted. The protein, CzrA is shown in red, Zn(II) ions in green and the DNA molecules are colored green. These cartoon depictions are snapshots from our MD simulations of these allosteric forms. A negative cooperative allosteric effect of ~6kcal/mol is observed on Zn(II) binding to CzrA.
Figure 3.

Snapshot of the CzrA metal binding site from the initial structure. The zinc ion is represented as a silver sphere. The metal binding residues include Asp84, His86, His97′ and His100′. These residues also represent the QM region in our QM/MM MD calculations.
These structures of the distinct allosteric states of CzrA provide an excellent starting point for the investigation of conformational dynamics using simulations, and an opportunity to significantly extend previous dynamics and thermodynamics measurements from solution NMR and isothermal titration calorimetry studies.11,12 Indeed, connecting long timescale dynamical simulations to experiments is an emerging area of investigation that potentially provides atomic insights into backbone and side chain motions readily detected over a wide range of timescales by NMR spectroscopy.11 In this paper, we show that explicit all atom MD simulations and quantum-mechanical molecular/mechanical molecular dynamics simulations (QM/MM MD) successfully capture the “closed-to-open” conformational change in CzrA. We analyze the impact of Zn(II) binding on the structure and conformational dynamics of the regulator and provide an explanation for the remarkable adaptability of CzrA to zinc and DNA binding by identifying residues involved in networks of correlated and anti-correlated motions. Our simulations show that a proposed hydrogen-bonding pathway (Fig. 1) connecting the metal recognition site to the DNA binding interface through the αR helix is present only in the Zn(II)-bound state. We also qualitatively show that Zn(II) binding restricts the protein’s ability to sample conformational space. To the best of our knowledge, this is the first such computational simulation of allosteric switching in a DNA-bound metal sensor protein. Our simulations are in close agreement with experimental results11,12 yet provide new insights into the mechanism of allosteric inhibition in CzrA.
2. Methods
The simulation of metal ions in proteins poses a unique set of challenges. A variety of “bonded”13–18, “semi-bonded”19 and “non-bonded”20–23 approaches to modeling Zn(II) ions in classical MD simulations have been proposed. The Zn(II) ions in our simulations of Zn2•CzrA and Zn2•CzrA•DNA were represented by a bonded model.24 In CzrA, Zn(II) ions exist in a tetrahedral coordination environment involving two residues derived from the α5 helix of each protomer. Asp84 (Oδ1) and His86 (Nδ1) residues from the first subunit, and His97′ (Nδ1) and His100′ (Nε2) residues from the second protomer bind to Zn(II) at each metal binding site. His97′ is oriented towards the αR helical region and forms a hydrogen bond with the backbone carbonyl oxygen atom of His67 which is a part of the hydrogen bonding pathway (HBP). The Zn-ligand parameters were calculated using the MTK++ program18 for the 1R1V Zn-crystal structure. The details for these calculations are provided elsewhere.18 In brief, the Zn(II) bonding parameters were obtained by performing a frequency calculation on a DFT optimized structure (TPSSKCIS/LANL2DZ-6-31G*) of the metal binding region using the Gaussian09 program.25–31 The TPSS exchange functional paired with the KCIS correlation functional has been shown to have low average unsigned errors in recent studies predicting heats of formation of Zn(II) complexes.32–34 The charges for the Zn(II) bonded ligands in the Zn(II) bound state were obtained using RESP (B3LYP/6-31G*) within the auspices/confines of the MTK++ program.35–37 The remaining amino acids were treated with standard amberff99SB parameters.38
The protonation states of the non-metal binding residues for the apo- and Zn(II) bound allosteric forms of the protein were obtained from the H++ protonation state calculation server.39 Special care was taken to obtain the correct protonation states for the metal binding ligands in Apo•CzrA. Thermodynamic experiments have determined a net release of ~1 proton on Zn(II) binding at each metal binding site in the CzrA dimer at pH 7.0.12 In addition, the metal binding region is highly mobile in the apo state of the protein, but less so in the Zn(II) bound state. To fulfill both criteria, we simulated various combinations of ligand protonation states for the Zn(II) binding ligands in Apo•CzrA. The remaining charged amino acids in apo CzrA were modeled in their protonation states obtained from the H++ server. Generalized-Born calculations of the 1R1U apo crystal structure for these different protonation states were performed. Each simulated structure was first minimized to remove any bad contacts in the system. The simulated systems were then equilibrated using a simulated annealing like approach in which the temperature of the system was slowly raised to 300K. These systems were next simulated for 2 ns at 300K to check for the stability of the metal binding site. A protonation state of CzrA with deprotonated Asp84 and protonated His97 maintains the orientation of the metal binding region for metal ion capture and simultaneously accounts for proton release on Zn(II) binding.12
The Apo•CzrA, CzrA•DNA, Zn2•CzrA and Zn2•CzrA•DNA allosteric forms were simulated in their biologically active dimeric assembly state in this study. Simulations of the apo protein were initiated from the 1R1U Apo•CzrA crystal structure, while the simulations of the DNA bound state of CzrA were started from a previously created DNA docked structure of CzrA.11 In this structure, a 2 fold symmetric 28 base pair, single fused 5′-TAACATATGAACATATGTTCATATGTTA-TAACATATGAACATATGTTCATATGTTA-3′ palindromic DNA hairpin with a 35° bend was docked into model 1 of the 2KJB ensemble of NMR structures of apo CzrA in the DNA bound closed conformation. This DNA-docked structure of apo-CzrA in the closed conformation is referred to as GDR in this work, and is included in SI. The charged amino acids in these allosteric forms were represented by their protonation states in the apo allosteric form of the protein. Simulations of the Zn(II) ion bound state of the protein were started from the 1R1V Zn crystal structure. A Zn(II) ion was modeled into each metal binding site of the simulated Zn2•CzrA systems based on the parameters derived from the 1R1V Zn crystal structure.
Model 1 of the 2KJB ensemble of NMR structures, solved as the DNA-bound closed conformation of apo-CzrA, was simulated in the apo and Zn(II) ion bound states in an effort to capture the structural changes in moving from a closed to an open state. The mechanism of allosteric switching from CzrA•DNA to Zn2•CzrA•DNA was investigated by simulating the GDR DNA-docked structure in the ternary Zn2•CzrA•DNA state. The protonation states corresponding to Apo•CzrA were applied to the protein in the 2KJB simulation of Apo•CzrA. In both Zn(II) ion bound simulations of allosteric switching, the disordered Zn(II) ion ligating residues were returned to the correct orientation and protonation states for Zn(II) binding based on the 1R1V crystal structure. The MTK++ derived parameters were employed to treat the metal ions in these simulations. The remaining charged amino acids in the protein were modeled in the Zn2•CzrA protonation states.
All simulations were performed using the AMBER 11 suite of programs.40 The AMBER ff99SB force field with parambsc0 modifications for DNA41 was used for the purposes of these simulations. All atoms in these simulated systems, including water molecules and counter-ions were treated explicitly. Non-DNA bound allosteric forms, i.e. Apo•CzrA and Zn2•CzrA were immersed in a periodically replicated rectangular box of SPC/E waters42 extending at least 8.0 Å from the protein surface. Counter ions were added to neutralize the simulated system. For simulations of CzrA•DNA and Zn2•CzrA•DNA, the thickness of the water layer surrounding the solute was increased to 10 Å. A 50 mM NaCl buffer solution was introduced in addition to neutralizing counter ions to mimic conditions under which the NMR samples were analyzed.11 The sizes of all solvated systems ranged from 23000 atoms to 62000 atoms.
Each solvated system was energy minimized and then equilibrated using a standard protocol. Minimization was performed over two stages. In the first stage of minimization the solutes (DNA and CzrA) were restrained with a strong harmonic positional restraint, and bad contacts between water molecules and counter-ions were removed. In the second stage of minimization, the restraints were removed from the solute, and the entire system was energy minimized. A simulated annealing-like methodology was then implemented to equilibrate the minimized system. Each system was gradually heated from 0 K to 300 K over 100 ps of MD for a canonical ensemble (NVT), while a weak harmonic restraint was maintained on the protein. This was followed by 1 ns of equilibration for an isobaric, isothermal ensemble (NPT) at 300 K without any restraints. MD simulations were then propagated for an isobaric, isothermal (NPT) ensemble at 300 K for every system. A time step of 2 fs was employed and frames were collected every 1000 steps. Over the course of these simulations, the SHAKE algorithm was utilized to constrain covalent bonds involving hydrogen atoms.43 Long-range electrostatic interactions were calculated using the particle mesh Ewald method,44 and the temperature of the system was maintained using Langevin Dynamics45,46 with a 1 ps−1 collision frequency. In the end, each system was simulated for 120 ns of production, leading to over 700 ns of total MD for this study.
Quantum-mechanical molecular-mechanical molecular dynamics (QM/MM MD) calculations were performed to supplement and validate our simulation of Zn(II) ions in a bonded model. These calculations were performed to detect any geometric changes and ligand exchanges at the metal binding region that could have been missed in the bonded treatment of Zn(II) ions. The QM/MM MD calculations were performed using the implementation of the third generation self-consistent charge density functional tight-binding (SCC-DFTB), DFTB3 in AMBER 11.47,48 While SCC-DFTB has been reported to inadequately measure relativistic effects and dissociation energies of Zn(II) complexes, it accurately depicts bond distances and Zn(II) complex geometries, while offering us the ability to sample extensively.48,49 A solvated and equilibrated form of the Zn-crystal structure was simulated using this method. The two metal binding sites on the protein were treated quantum mechanically in individual simulations. The QM region in each simulation consisted of a Zn(II) ion and its corresponding metal ligating residues, Asp84, His87, His97′ and His100′. The metal binding residues were introduced by side-chain cuts between the α and β carbon atoms. 1 ns of QM/MM MD with a step-size of 1 fs were performed in each simulation, leading to 2 ns of total QM/MM MD for the simulated system.
A DFT based QM/MM energy minimization calculation was performed as a final validation step for our model to compensate for any possible errors in the SCC-DFTB methodology. In these calculations, which were performed using the Qsite program in the Schrödinger 2011 software suite, both metal ion recognition sites were simultaneously treated at the QM level. The QM/MM calculation was performed on the solvated and well equilibrated protein structure used for the SCC-DFTB calculations. To keep this minimization calculation computationally feasible, it was performed over multiple steps following a scheme that introduced an increasing degree of complexity at each stage. In the first stage of this calculation, the first metal binding site consisting of the Zn(II) ion and the metal binding residues (Asp84, His86, His97′ and His100′) were treated at the QM level (M05-2X/LACVP*) while the remaining system was modeled using the OPLS 2005 force field.27,50–52 The LACVP* basis set applies the LANL2DZ pseudopotential-based basis set for Zn(II) and the 6–31G* basis set for non-metal atoms. A recent study by Sorkin et al. has found that the M05-2X functional adequately represents Zn(II) ions at a bio-metal center.52 Side-chain cuts between the α and β carbons were employed to introduce the metal binding residues into the QM region. All protein residues and water molecules within a 10 Å distance from the metal binding active site were allowed to minimize during this calculation. The choice of a 10 Å cut-off distance allowed the second metal binding site to be kept frozen over the course of this minimization. Upon successful completion of this minimization, the second metal binding site was minimized using the same protocol. In the second stage of this calculation, the His67 and His67′ residues were included into the QM region using backbone cuts. Both metal recognition sites were included in the QM region. Once again, all protein residues and water molecules within a 12 Å distances of the QM region were allowed to minimize in this calculation. In subsequent stages of the calculation, the cut-off distance describing the mobile region of the system was gradually increased until the geometry of the QM region remained largely conserved between consecutive geometry-optimization steps. In the final stage of geometry optimization, all water molecules and protein residues within 17 Å from the QM region were allowed to move. The final structure from these calculations is presented as part of SI.
3. Results and Discussion
We generated over 700 ns of MD data from our simulations of the four allosteric end-states of the zinc sensor CzrA, namely Apo•CzrA, Zn2•CzrA, CzrA•DNA and Zn2•CzrA•DNA (see Fig 2) in an effort to capture the conformational changes in CzrA as it switches between them. In addition to our classical MD simulations, we also carried out 2 ns of QM/MM MD simulations for the Zn(II)-bound CzrA. These QM/MM MD simulations show that the bond distances and angles between the metal ions and the ligating residues remained stable over the course of the simulation, and no changes were observed in the arrangement of ligating residues around the metal ion. Our DFT-QM/MM calculations further validate the choice of a bonded model, and showed that the Zn(II) ion remains bonded to its ligating residues. These results, in conjunction with the high Zn(II) binding affinity of CzrA (ΔG ~ −16 kcal/mol), reveal that the bonded model treatment of Zn(II) ions is a suitable representation of the metal binding site in CzrA. In this study, analyses were performed using the AmberTools40 and VMD53 suite of programs unless otherwise indicated.
3.1 Conformational Changes: Open and Closed Conformations
An initial objective was to probe for the existence of open and closed conformational states of CzrA. A measure of the interprotomer Ser54 Cα distances was used as a simple yet accurate identifier for each conformational state. Ser54 lies at the DNA binding interface of the αR helical region of CzrA, and thus provides a good measure of the distances between the N-terminal tips of the two αR helices. A conformation with an interprotomer Ser54 Cα distance in excess of 43 Å was considered to represent an open conformation of CzrA, while a structure with an interprotomer Ser54 Cα distance shorter than 41 Å was considered to be in the closed form of CzrA (Fig. S1, Supporting Information). Another measure of the conformational state of CzrA exploits the fact that the CzrA dimer adopts a “flat” conformation at the DNA binding interface in the low DNA binding affinity structure, and a “bent” conformation at the interface, which is conducive to high affinity DNA binding. We thus used the average measure of the two αR-αR′ interhelical angles (Ser54-Ser65-Ser54′) as a second metric with which to distinguish the open and closed conformations (Fig. S1).
We do not observe any large conformational changes along the protein backbone in our MD simulations of the apo and Zn(II) bound states of CzrA, starting from the 1R1U apo protein crystal structure and the 1R1V Zn(II) crystal structure, respectively. The αR helices move apart slightly to adopt the open conformation. The interprotomer Ser54 Cα distance fluctuated around 44 Å in both simulations (Fig. 4a), which compares favorably with the crystallographically determined distance of 43.7 Å and 43.5 Å for the apo and Zn(II)-bound forms of CzrA, respectively. In our simulation of Zn2•CzrA, a maximum interprotomer Ser54 Cα distance of 48 Å was observed, and the protein clearly adopts the “flat” or open conformation, rendering it less suitable for binding to canonical B-DNA. In our simulations of Apo•CzrA, the metal binding region was disordered and the Zn(II) coordinating residues appeared to explore regions around the α5 helix. In contrast, the α5 helices were well ordered in our simulations of Zn2•CzrA, and the metal ions held the two monomers together strongly across the dimeric interface. The β-wing regions of the protein were mobile in both allosteric forms. We also observe local disorder in the DNA binding regions of the protein. These simulations suggest that the Zn(II)-bound CzrA is structurally similar to the apo form of the protein.
Figure 4.

(a) Interprotomer Ser54 Cα distances for simulations of Apo•CzrA starting from the apo-crystal structure, Zn2•CzrA starting from the Zn-crystal structure, CzrA•DNA starting from the GDR structure, and Zn2•CzrA•DNA starting from Zn(II) bound GDR structures. (b) Average values of interprotomer angles Ser54-Ser65-Ser’54 and Ser’54-Ser’65-Ser54 angles for the above-mentioned allosteric forms of CzrA.
We performed a 120 ns MD simulation of the CzrA•DNA complex, starting from the DNA-docked structure of CzrA. In our simulation, we find the complex primarily explores the closed conformational form of the protein, adopting a bent DNA binding interface that binds strongly to the palindromic DNA. In line with experimental observations, CzrA binds to DNA in the major groove in a way that places the side chains of Ser54, Ser57 and His58 as interacting strongly with the DNA.11 The αR helices move closer to each other over the course of the simulation, and the residues in the β-wing regions “clamp down” on the DNA. The interprotomer Ser54 Cα distance over the last 40 ns of the simulation oscillated between 37 Å and 40 Å, which is close to the ~40 Å distances observed in the 2KJB ensemble of NMR structures. The interprotomer Ser54 Cα distance and the αR bend angles in this allosteric form are lower than those observed in our simulations of the apo and Zn(II) ion bound states of the protein, showing that our simulations successfully capture the low DNA binding affinity open conformation of Zn2•CzrA and high DNA binding affinity closed conformation of the CzrA•DNA complex (Fig. 4).
3.2 Changes in Phe20 Within the Dimer Interface
The dimer interface in CzrA is characterized by a series of non-polar interactions, one of which is a π-π interaction between the aromatic rings of Phe20 located in the α1 helix of opposite protomers. These side chains lie in a parallel offset stacked position in the crystallographic structures of both Apo•CzrA and Zn2•CzrA (Fig. S2a). We find that this interaction is altered in CzrA•DNA such that these two residues form a T-shape stacking interaction (Fig. S2b) Thus, on DNA binding, the αR helices are pulled closer to each other and the Phe20 residues are preferentially stabilized in the T-stacked perpendicular interaction compared to the parallel-stacked conformation adopted in the absence of DNA. The interprotomer CD2-CD1-CD2′ angle between the two Phe20 residues for Zn(II) bound open and DNA bound closed conformations of the protein over the course of these trajectories is shown in Fig. 5. The corresponding angles for Apo•CzrA are shown in Fig. S3. These phenyl rings are very mobile and flip frequently in the open conformations but never adopt the perpendicular arrangement characterized by DNA-bound CzrA for any length of time; in contrast, they are held rigid in the closed conformation of CzrA in the complex. Since we see no evidence that Phe20 interacts directly with DNA, we attribute this new edge-on interaction to the change in quaternary structure in response to DNA binding. The phenyl ring of the phenylalanine residue stacked perpendicular to the DNA binding interface is situated in the dimer interface between the metal binding α5 helices, and is stabilized in that conformation through numerous non-polar interactions.
Figure 5.

Interprotomer CD2-CD1-CD2′ angle measured for Phe20 and Phe’20 showing the conformational change in Phe20-Phe’20 stacking in Zn2•CzrA and CzrA•DNA.
3.3 Simulations of Allosteric Switching
We next performed simulations of allosteric switching in CzrA to capture the motions in the protein as it transitions from a closed DNA bound conformation towards an open conformation with reduced DNA binding affinity in an effort to understand the mechanism by which Zn(II) drives CzrA off the DNA. As previously mentioned, the closed 2KJB structure of apo-CzrA was simulated as such to capture the transition to an open conformation of apo-CzrA, and with a metal ion in each metal recognition site to simulate the transitions to the Zn(II) bound open state of the protein. Over the course of these simulations, we find that the protein becomes more compact and the metal binding regions become more ordered and less fluxional. The interprotomer Ser54 Cα distance was used as a metric to judge the transition from a closed to an open form and was found to increase from 40 Å to greater than 48 Å in these cases (Figure SI.4), We do not observe the closed conformation in apo CzrA for extended periods of time in these simulations, and believe DNA binding alone may cause the protein to explore the closed conformations consistently. These simulations are consistent with our simulation of Apo•CzrA and Zn2•CzrA initiated from the 1R1U and 1R1V crystal structures respectively. It should be noted that the absence of DNA in these simulations allows the capture of closed to open conformational changes to be achieved rapidly. It is possible that apo CzrA may access these closed conformations in simulations over longer time scales.
We captured the transition from the closed DNA-bound state to the Zn(II)-bound ternary state by simulating the GRD (2KJB docked with DNA) structure with a Zn(II) ion in each metal binding site. The structure of this Zn2- and DNA-bound ternary structural state remains to be determined, so the comparisons were made to the other allosteric forms of CzrA. As previously mentioned, we generated 120 ns of MD trajectories for the ternary state of the protein. The presence of Zn(II) ions causes a large conformational change in the protein, pushing the two αR helices apart from each other, and driving the protein towards the open state with a flatter DNA binding interface. CzrA then samples the open conformation as the Ser54 Cα distances increase from 42 Å to greater than 48 Å over the course of the simulation (Fig. 4(a)) and the αR-αR′ inter-helical angles grew to match values from our simulation of Zn2•CzrA over the course of the simulation (Fig. 4(b)). Zn(II) binding is known to reduce the affinity of CzrA for operator DNA by over four orders of magnitude at 0.4 M NaCl, from ≈1010 to ≈106 M−1. At times in our simulations, we observe DNA “peeling off” from one end of the protein, but do not see it disassociate altogether over these time scales. These simulations document the flexibility of CzrA as it transitions between the different allosteric states in response to metal ion or DNA binding. Furthermore, they also provide evidence for the existence of open and closed conformations. These findings are in agreement with recent studies performed by Arunkumar et al. that captured the dynamics of CzrA using NMR methods.11
3.4 Root Mean Square Fluctuations
Zn(II) binding to CzrA has been shown to reduce the mobility of selected regions, while DNA binding has the opposite effect.11 It has been suggested that these changes in conformational dynamics contribute towards the large allosteric coupling free energy associated with Zn(II) binding.12 We calculated the root mean square fluctuation (RMSF) values of the Cα backbone atoms for the simulations of the allosteric forms of the protein to investigate the influence of Zn(II) binding on the mobility of these residues (Fig. 6). We find that the metal binding region is highly mobile and disordered in the DNA bound state of the protein and considerable mobility remains in that region in the apo state as well.11 Upon Zn(II) binding to the either CzrA•DNA complex or Apo•CzrA, the “backbone” stiffens and the α5 helices become well ordered. This region is most rigid in the Zn2•CzrA allosteric form. These results are qualitatively consistent with results from experiments performed by Arunkumar et al.11 Interestingly, the side chains of the charged β-wing residues interact with DNA electrostatically and consequently induce more backbone rigidity in the CzrA•DNA and Zn2•CzrA•DNA complexes. These regions are obviously unencumbered and are more mobile in Apo•CzrA and Zn2•CzrA. In close agreement with NMR experiments, we find that Zn(II) binding rigidifies the αR region in both Zn2•CzrA and Zn2•CzrA•DNA, locking down the residues in this region into a low DNA binding affinity open state with a flat DNA binding interface. Interestingly, the residues in the α2 and α3 regions of CzrA remain flexible in all allosteric forms of the protein. We find a high degree of disorder in the DNA and Zn(II) binding sites in apo CzrA suggesting that a combination of induced fit and conformational selection may operate at the ligand binding sites in apo CzrA.
Figure 6.

Plot of Cα atoms RMSF values from simulations of Apo•CzrA starting from the apo-crystal structure, Zn2•CzrA starting from the Zn-crystal structure, CzrA•DNA starting from the GDR structure, and Zn2•CzrA•DNA starting from Zn(II) bound GDR structures. The αR, β2 and α5 regions of the protein are shown.
3.5 Calculation of Cross Correlation Matrices
We next investigated the impact of Zn(II) binding on the internal motions of CzrA by analyzing the networks of residues involved in correlated and anti-correlated motions in each allosteric form of CzrA (Fig. 7). In these cross-correlation plots of the backbone Cα carbon atoms, the values range from 1 for perfect correlation (shaded red, Fig. 7), i.e., residues that move together, to −1 for perfect anti-correlation (shaded blue, Fig. 7). These plots reveal that CzrA exhibits a hierarchy of residue networks of correlated and anti-correlated motions that connect the metal and DNA binding regions. These networks are already evident in the apo state of the protein. In Fig. 7a, the two metal binding regions in Apo•CzrA are shown in black dotted boxes. Both metal binding sites move in a strongly correlated manner, even in the apo state of the protein, and influence the conformational motions of CzrA through these networks. The movements in each metal binding region are correlated with motions within the α1 and α2 helical regions of both protomers, and are anti-correlated to those in the core areas of the protein. We find the residues in the β2 wing regions move in a correlated manner with respect to the core of the protein, but are anti-correlated to the metal binding regions and the α1 and α2 helical regions.
Figure 7.

The cross-correlation matrices for Cα atoms from simulations of Apo•CzrA starting from the apo-crystal structure, Zn2•CzrA starting from the Zn-crystal structure, CzrA•DNA starting from the GDR structure, and Zn2•CzrA•DNA starting from Zn(II) bound GDR structures are illustrated. Residues within the orange blocks belong to the first monomer, while those in the pink blocks belong to the second monomer. The αR, β2 and α5 regions of the protein are indicated in the cross-correlation matrix from the simulations of the apo state of the protein.
Upon metal ion binding, the extent of residue-specific correlations quantitatively decrease, as Zn(II) binding clearly dampens conformational sampling by CzrA. This is especially noticeable in both metal-binding regions (Fig. S5). Zn(II) binding rigidifies the metal binding region, and reduces the extent of correlation in the metal binding region. This impacts the various regions of the protein, as is reflected in these matrices. The correlated and anti-correlated motions in the CzrA•DNA complex are captured in Fig. 7c. We observe two large expanses of anti-correlation as CzrA samples the closed conformation bound to DNA. The picture that emerges is that the closed conformation is a disordered and highly mobile state of the protein. The αR helices move towards each other near the DNA binding interface, causing the two monomers to move closer together in an anti-correlated manner; in contrast, the residues in the β wing regions of each protomer clamp down on the DNA and move in a correlated manner. Fig. 7d illustrates the impact of Zn(II) binding on CzrA•DNA. In the ternary state of the protein, the matrix takes the familiar form observed in Apo•CzrA and Zn2•CzrA, as the protein residues respond to Zn(II) addition and move in a manner similar to those states. In this allosteric form, the protein tries to return to the open conformation while maintaining its interactions with the DNA molecule.
3.6 Hydrogen-Bonding Pathway
We next examined a hydrogen-bonding pathway connecting each metal binding site to the DNA binding αR helix in our simulations of the allosteric forms of CzrA. Such a pathway was observed in the 1R1V Zn-crystal structure and extends from the metal binding residue, His97 through its imidazole Nε2 bound hydrogen atom to the αR helix of the other protomer by a hydrogen bond with the carbonyl oxygen of His67′.6 (Fig. 1 and Fig. 8 respectively) We find that this pathway exists in both metal-binding sites in our MD, QM/MM MD, and QM/MM calculations of Zn2•CzrA. These pathways were occasionally disrupted by water molecules, but were soon re-established. Our simulation of Apo•CzrA shows that a longer and presumably weaker hydrogen bond exists between His97 and His67′ in the apo allosteric state. A similar hydrogen-bonding pattern did not emerge in our simulations of DNA-bound CzrA in agreement with experimental results. In our simulations of Zn2•CzrA•DNA we were unable to detect the presence of such a network, though we find the αR helix comes closer to the α5 helix.
Figure 8.

Illustration of the hydrogen bond distances between His97-HE2 and His67-O in the hydrogen bonding pathway from simulations of Apo•CzrA starting from the apo-crystal structure, Zn2•CzrA starting from the Zn-crystal structure, CzrA•DNA starting from the GDR structure, and Zn2•CzrA•DNA starting from Zn(II) bound GDR structures.
3.7 Electrostatic Surface Potential
We calculated the electrostatic surface potential (ESP) for the open and closed conformational states of CzrA using the DCQTP program.54–56 DCQTP uses a divide and conquer approach that allows for a fast and accurate calculation of the ESP at a semi-empirical level by solving the linear Poisson-Boltzmann equations. We calculated representative structures over 10 ns periods for the last 30 ns of the simulated runs for the allosterically inhibited open Zn2•CzrA•DNA complex vs. the closed CzrA•DNA simulations; DNA was not included in these calculations (Fig. 9 and Fig. S6, respectively). The DNA binding interface of CzrA is lined with charged residues that interact with the negatively charged DNA molecule. In the closed, high affinity DNA-binding state (Fig. 9a), a large contiguous patch of positive ESP is observed in the DNA binding interface of the protein. In contrast, the open state complex of CzrA bound to DNA, Zn2•CzrA•DNA, is characterized by a disruption of the contiguous positively charged potential, that potentially reduces the DNA binding affinity of CzrA upon addition of Zn(II) ions, thus helping to drive CzrA off the DNA.
Figure 9.
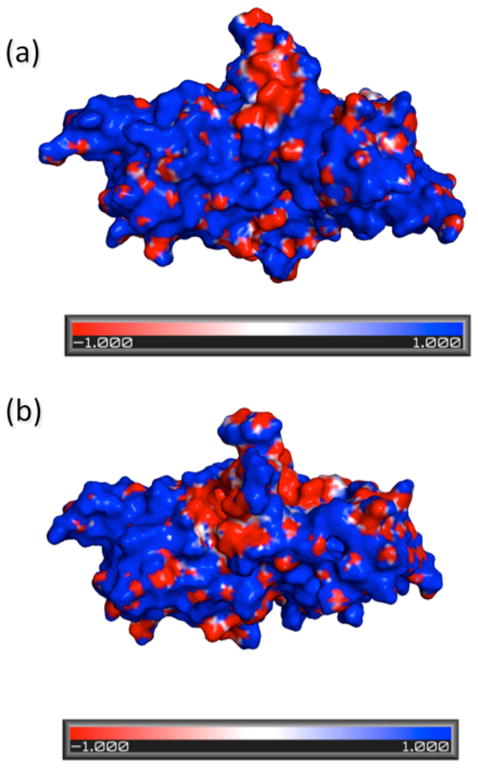
Electrostatic Potential Energy Surfaces of the DNA binding interface for the open (panel a) and closed (panel b) conformations of CzrA. The blue regions indicate a positively charged area, while the red regions indicate a negatively charged region.
3.8 Essential Dynamics Analysis
We performed an essential dynamics analysis57 on our simulation of Zn2•CzrA started from a closed conformation of apo CzrA to identify the structural changes in the protein that are directly influenced by Zn(II) binding. As previously mentioned, we successfully captured the closed to open transition in this simulation started from the 2KJB NMR structure. Using this principal-component analysis like method, we calculated and diagonalized the covariance matrix for Cα carbon atoms for all protein residues to obtain the first eigenvector of the protein from these simulations. A similar analysis along different eigenvectors of the protein is not possible in NMR experiments. The RMSF values for the Cα carbon atoms obtained along the first eigenvector of the protein (Fig. 10) show large changes in the β wing, α2, αR and α5 regions of the protein. Conformational changes in these protein regions form the bulk of changes in the protein structure while transitioning between the open and closed allosteric forms. A comparative analysis performed on our simulation of apo CzrA starting from the 1R1U crystal structure was not found to have major structural changes associated with its first eigenvector. These results, in conjunction with our analysis of cross-correlation matrices, suggest that that Zn(II) binding provides the driving force for conformational change in the CzrA homodimer.
Figure 10.

Essential Dynamics Analysis: Plot of RMSF values for the lowest mode of the protein from simulation of Apo•CzrA starting from the apo-crystal structure, and simulation of allosteric switching for Zn2•CzrA starting from the 2KJB NMR structure of apo-CzrA in a closed conformation.
3.9 Conformational Ensembles
We next calculated the protein backbone RMSD distributions for our simulations of Apo•CzrA and Zn2•CzrA to examine the extent of conformational sampling in these allosteric forms. The RMSD values for the last 100 ns of Apo•CzrA and Zn2•CzrA simulations were calculated against the starting 1R1U and 1R1V crystal structures, respectively (Fig. 11a) The population distributions for these allosteric forms report on the influence of zinc binding on allowing CzrA to sample conformational space in a qualitative manner (Fig. 11(b)). The RMSD distributions reveal that Zn2•CzrA exists in a single conformational state situated in a deep potential well with very steep walls; this ensures that a severe energetic penalty is incurred for moving away from the minima in this allosterically inhibited form.58 In striking contrast, the population distribution for Apo•CzrA suggests at least three distinguishable conformational states defined by a shallow potential well with each state separated by a few kcal/mol from the minima. One of these states qualitatively resembles the Zn(II) bound allosteric state consistent with the idea that apo-CzrA is capable of making conformational excursions into a Zn(II) bound like structure. This enables Apo•CzrA to sample more families of conformations than Zn2•CzrA, which is likely important for binding tightly to Zn(II) or DNA. Simulations of Apo•CzrA over longer time scales could determine if DNA binds to apo-CzrA by a mechanism of induced-fit binding or conformational selection.59
Figure 11.

(a) PMF calculated from backbone protein RMSD distributions from simulations of Apo•CzrA starting from the apo-crystal structure and Zn2•CzrA starting from the Zn-crystal structure. (b) Protein backbone RMSD distribution for the above-mentioned simulations.
We further performed a detailed clustering analysis to identify unique states sampled over the course of our simulations of apo- and Zn(II)-bound CzrA. The implementation of the “mean” algorithm in ptraj60 was employed to cluster snap-shots from our simulations based on their RMSD values. We performed the analysis over multiple runs. In this calculation we first distributed the data into 10 clusters against an average structure from the trajectory. In this calculation, representative structures and average structures were obtained for each cluster. We reduced or increased the number of discrete clusters till a RMSD difference of greater than 1 Å was obtained between the structures from these clusters themselves and the starting crystal structure. These analyses found the existence of three unique states in our simulations of Apo•CzrA, with a population distribution of 51.5%, 16.5% and 32%, consistent with the findings above. In contrast, a single state was detected for Zn2•CzrA that corresponds to state 1 of Apo•CzrA. The representative structures obtained from the clustering analysis are presented in SI.
5. Conclusions
In this work, we present all atom simulations of the allosteric forms of the paradigm ArsR/SmtB family zinc sensor CzrA in explicit solvent. Our simulations provide new insights into the mechanism of allosteric regulation in CzrA and are in close agreement with the extensive experimental findings for this system.6,7,11,12 We find that large quaternary structural conformational transitions of CzrA play an essential role in the ability of CzrA to function as an allosterically regulated transcriptional repressor. In complete agreement with experimental data, our simulations reveal that apo and Zn(II)-bound CzrA each adopt a stable open conformation while high affinity DNA binding stabilizes the closed conformation. Our simulations of allosteric switching in CzrA successfully capture this structural transition between closed to open conformations upon Zn(II) binding to CzrA bound to the DNA, prior to dissociation, on a timescale of hundreds of nanoseconds. We found that the disordered α5 metal binding region became more ordered in response to metal ion binding and the residues in the β-wing regions reduced their interactions with the DNA molecule over the course of the simulations. The αR helices at the DNA binding interface moved away from each other in this conformational form, and the protein switched to the low DNA-binding affinity open state in which the DNA binding interface adopted a flat conformation less suitable for DNA binding.
In addition, we analyzed the structure and conformational dynamics of CzrA, and by doing so obtained a better understanding of the relationship between Zn(II) binding at a distal location and the associated reduction in DNA binding affinity. We examined the mobility of residues in all allosteric forms of the protein and observed an increase in the rigidity of the metal binding α5 helices in the Zn(II) bound allosteric forms. We also found the residues in the β-wing regions became more flexible in the open conformations of the protein. We identified groups of residues that are involved in hierarchical networks of correlated and anti-correlated motions that clearly connect the metal binding and DNA binding sites in functionally important ways. These networks are present in all allosteric forms of the protein, but are greatly attenuated in the Zn(II)-bound state. They are indicative of communications channels that help to account for the structural sensitivity of CzrA to both metal and operator DNA binding. Our simulations support the existence of a functionally important hydrogen-bonding pathway that connects the first coordination shell of the Zn(II) complex to the DNA binding site through the αR helices.6 This pathway was stable only in Zn2•CzrA, but was destabilized or absent in all other allosteric forms, including the intermediate Zn2•CzrA•DNA complex. Our data suggest the possibility that this pathway “rigidifies” the structure CzrA, and ultimately prevents it from closing to a high DNA binding affinity conformation. The essential dynamics reveal that Zn(II) binding to a closed conformation of the protein drives the β-wing regions and the core of the protein to adopt a more open quaternary structure. In the Zn(II)-bound state, the internal dynamics of CzrA are reduced leading to significantly less sampling of conformational space relative to apo-CzrA. We show that the structural changes in CzrA on Zn(II) binding are accompanied by changes in the electrostatic potential energy surface, particularly in the DNA-binding interface, in a manner that should destabilize the protein-DNA complex.
In summary, our simulations provide new perspectives into allosteric switching by a metal sensor protein. These studies take on added significance when one considers that the crystal structures of apo- and Zn(II)-bound CzrA are so similar.6 The ability of CzrA to transition from a flexible protein in its apo form into one in which conformational dynamics are strongly quenched on Zn(II) binding is an important regulatory characteristic of CzrA and perhaps other metalloregulatory proteins in which metal ion binding allosterically activates or inhibits operator DNA binding. Clearly, residues at the metal binding site and the DNA binding interface of CzrA are not pre-organized for binding, and thus remain mobile in their search for ligands. The exact nature of the capture of these molecules by CzrA is an interesting facet of the CzrA mechanism that remains a subject for future study. In this work, we lay the foundation for simulations capable of exploring the conformational changes occurring over the microsecond timescale in the protein. In all, large-scale global conformational changes superimposed on local dynamics dominate the biological function of CzrA, and highlight the general role of protein motion in biological regulation.
Supplementary Material
Acknowledgments
We thank Dr. Xue Li for aiding in the preparation of the 1R1V crystal structure for simulations. We thank Prof. Peter Ortoleva, Yinglong Miao and Abhishekh Singha Roy for their assistance in generating the GDR structure. We thank the High-Performance Computing Center at the University of Florida for providing the computational resources used in this study. We thank Yue Yang, Benjamin Roberts, Greg Campanello and Sarah Gordon for helpful discussions. We gratefully acknowledge financial support for this project from the United States National Institutes of Health (K.M.M.; GM044974 and GM066859 and D.P.G.; GM042569).
Abbreviations
- CzrA
Staphylococcus aureus CzrA
- MD
molecular dynamics
- QM/MM
quantum-mechanical molecular-mechanical
- QM/MM MD
quantum-mechanical molecular-mechanical molecular dynamics
- NMR
nuclear magnetic resonance
- SI
- PMF
potential of mean force
- RMSF
root mean square fluctuations
- HBP
hydrogen-bonding pathway
- SCC-DFTB
self-consistent charge density functional tight-binding
- ESP
electrostatic surface potential
- DFT
density functional theory
Footnotes
Figures, plots, snapshots from trajectories, protein structures from population analysis and QM/MM calculations, citation for reference 25, and force-field files are presented in this section.
References
- 1.O’Halloran TV. Science. 1993;261:715. doi: 10.1126/science.8342038. [DOI] [PubMed] [Google Scholar]
- 2.Finney LA, O’Halloran TV. Science. 2003;300:931. doi: 10.1126/science.1085049. [DOI] [PubMed] [Google Scholar]
- 3.Xiong AM, Jayaswal RK. J of Bacteriol. 1998;180:4024. doi: 10.1128/jb.180.16.4024-4029.1998. [DOI] [PMC free article] [PubMed] [Google Scholar]
- 4.Kuroda M, Hayashi H, Ohta T. Microbio Immunol. 1999;43:115. doi: 10.1111/j.1348-0421.1999.tb02382.x. [DOI] [PubMed] [Google Scholar]
- 5.Cherezov V, Hofer N, Szebenyi DME, Kolaj O, Wall JG, Gillilan R, Srinivasan V, Jaroniec CP, Caffrey M. Structure. 2008;16:1378. doi: 10.1016/j.str.2008.05.014. [DOI] [PMC free article] [PubMed] [Google Scholar]
- 6.Eicken C, Pennella MA, Chen XH, Koshlap KM, VanZile ML, Sacchettini JC, Giedroc DP. J Mol Biol. 2003;333:683. doi: 10.1016/j.jmb.2003.09.007. [DOI] [PubMed] [Google Scholar]
- 7.Giedroc DP, Arunkumar AI. Dalton Trans. 2007:3107. doi: 10.1039/b706769k. [DOI] [PubMed] [Google Scholar]
- 8.Ma Z, Jacobsen FE, Giedroc DP. Chem Rev. 2009;109:4644. doi: 10.1021/cr900077w. [DOI] [PMC free article] [PubMed] [Google Scholar]
- 9.Lee S, Arunkumar AI, Chen XH, Giedroc DP. J Am Chem Soc. 2006;128:1937. doi: 10.1021/ja0546828. [DOI] [PubMed] [Google Scholar]
- 10.Pennella MA, Arunkumar AI, Giedroc DP. J Mol Biol. 2006;356:1124. doi: 10.1016/j.jmb.2005.12.019. [DOI] [PubMed] [Google Scholar]
- 11.Arunkumar AI, Campanello GC, Giedroc DP. Proc Natl Acad Sci USA. 2009;106:18177. doi: 10.1073/pnas.0905558106. [DOI] [PMC free article] [PubMed] [Google Scholar]
- 12.Grossoehme NE, Giedroc DP. J Am Chem Soc. 2009;131:17860. doi: 10.1021/ja906131b. [DOI] [PMC free article] [PubMed] [Google Scholar]
- 13.Vedani A, Huhta DW. J Am Chem Soc. 1990;112:4759. [Google Scholar]
- 14.Hoops SC, Anderson KW, Merz KM. J Am Chem Soc. 1991;113:8262. [Google Scholar]
- 15.Bredenberg J, Nilsson L. Int J Quantum Chem. 2001;83:230. [Google Scholar]
- 16.Li W, Zhang J, Wang J, Wang W. J Am Chem Soc. 2008;130:892. doi: 10.1021/ja075302g. [DOI] [PubMed] [Google Scholar]
- 17.Lin F, Wang RX. J Chem Theory Comput. 2010;6:1852. doi: 10.1021/ct900454q. [DOI] [PubMed] [Google Scholar]
- 18.Peters MB, Yang Y, Wang B, Fusti-Molnar L, Weaver MN, Merz KM. J Chem Theory and Comput. 2010;6:2935. doi: 10.1021/ct1002626. [DOI] [PMC free article] [PubMed] [Google Scholar]
- 19.Pang YP. Proteins-Structure Function and Genetics. 2001;45:183. [Google Scholar]
- 20.Deeth RJ, Anastasi A, Diedrich C, Randell K. Coordin Chem Rev. 2009;253:795. [Google Scholar]
- 21.Stote RH, Karplus M. Proteins-Structure Function and Genetics. 1995;23:12. doi: 10.1002/prot.340230104. [DOI] [PubMed] [Google Scholar]
- 22.Wu RB, Lu ZY, Cao ZX, Zhang YK. J Chem Theory Comput. 2011;7:433. doi: 10.1021/ct100525r. [DOI] [PMC free article] [PubMed] [Google Scholar]
- 23.Dudev T, Lim C. Ann Rev Biophys. 2008;37:97. doi: 10.1146/annurev.biophys.37.032807.125811. [DOI] [PubMed] [Google Scholar]
- 24.Yang Y, Chakravorty DK, Merz KM., Jr Biochemistry. 2010;49:9658. doi: 10.1021/bi1008358. [DOI] [PMC free article] [PubMed] [Google Scholar]
- 25.Rey J, Savin A. Int J Quantum Chem. 1998;69:581. [Google Scholar]
- 26.Frisch MJ, et al. Gaussian, Inc. A.01. Wallingford, CT: 2009. [Google Scholar]
- 27.Cramer CJ, Truhlar DG. Phys Chem Chem Phys. 2009;11:10757. doi: 10.1039/b907148b. [DOI] [PubMed] [Google Scholar]
- 28.Ditchfie R, Hehre WJ, Pople JA. J Chem Phys. 1971;54:724. [Google Scholar]
- 29.Wadt WR, Hay PJ. J Chem Phys. 1985;82:284. [Google Scholar]
- 30.Tao JM, Perdew JP, Staroverov VN, Scuseria GE. Phys Rev Lett. 2003;91 doi: 10.1103/PhysRevLett.91.146401. [DOI] [PubMed] [Google Scholar]
- 31.Toulouse J, Savin A, Adamo C. J Chem Phys. 2002;117:10465. [Google Scholar]
- 32.Yang Y, Weaver MN, Merz KM. J Phys Chem A. 2009;113:9843. doi: 10.1021/jp807643p. [DOI] [PMC free article] [PubMed] [Google Scholar]
- 33.Weaver MNMKM., Jr Unpublished Results. 2011 [Google Scholar]
- 34.Riley KE, Merz KM. J of Phys Chem A. 2007;111:6044. doi: 10.1021/jp0705931. [DOI] [PubMed] [Google Scholar]
- 35.Bayly CI, Cieplak P, Cornell WD, Kollman PA. J Phys Chem. 1993;97:10269. [Google Scholar]
- 36.Cieplak P, Cornell WD, Bayly C, Kollman PA. J Comp Chem. 1995;16:1357. [Google Scholar]
- 37.Becke AD. J Chem Phys. 1993;98:5648. [Google Scholar]
- 38.Hornak V, Abel R, Okur A, Strockbine B, Roitberg A, Simmerling C. Proteins. 2006;65:712. doi: 10.1002/prot.21123. [DOI] [PMC free article] [PubMed] [Google Scholar]
- 39.Gordon JC, Myers JB, Folta T, Shoja V, Heath LS, Onufriev A. Nucl Acids Res. 2005;33:W368. doi: 10.1093/nar/gki464. [DOI] [PMC free article] [PubMed] [Google Scholar]
- 40.Case DA, Cheatham TE, 3rd, Darden T, Gohlke H, Luo R, Merz KM, Jr, Onufriev A, Simmerling C, Wang B, Woods RJ. J Comput Chem. 2005;26:1668. doi: 10.1002/jcc.20290. [DOI] [PMC free article] [PubMed] [Google Scholar]
- 41.Perez A, Marchan I, Svozil D, Sponer J, Cheatham TE, Laughton CA, Orozco M. Biophys Journal. 2007;92:3817. doi: 10.1529/biophysj.106.097782. [DOI] [PMC free article] [PubMed] [Google Scholar]
- 42.Berendsen HJC, Grigera JR, Straatsma TP. J of Phys Chem. 1987;91:6269. [Google Scholar]
- 43.Allen MP, Tildesley DJ. Computer Simulations of Liquids. Clarendon Press; Oxford: 1987. [Google Scholar]
- 44.Darden T, York D, Pedersen L. J Chem Phys. 1993;98:10089. [Google Scholar]
- 45.Adelman SA, Doll JD. J Chem Phys. 1976;64:2375. [Google Scholar]
- 46.Doll JD, Dion DR. J Chem Phys. 1976;65:3762. [Google Scholar]
- 47.Seabra GD, Walker RC, Elstner M, Case DA, Roitberg AE. J Phys Chem A. 2007;111:5655. doi: 10.1021/jp070071l. [DOI] [PMC free article] [PubMed] [Google Scholar]
- 48.Gaus M, Cui QA, Elstner M. J Chem Theory Comput. 2011;7:931. doi: 10.1021/ct100684s. [DOI] [PMC free article] [PubMed] [Google Scholar]
- 49.Amin EA, Truhlar DG. J Chem Theory and Comput. 2008;4:75. doi: 10.1021/ct700205n. [DOI] [PubMed] [Google Scholar]
- 50.Jorgensen WLT-RJ. Proc Natl Acad Sci USA. 2005;102:6665. [Google Scholar]
- 51.Qsite. 5.7. Schrodinger, I; N. Y., NY: 2011. [Google Scholar]
- 52.Sorkin A, Truhlar DG, Amin EA. J Chem Theory Comput. 2009;5:1254. doi: 10.1021/ct900038m. [DOI] [PubMed] [Google Scholar]
- 53.Humphrey W, Dalke A, Schulten K. J Molec Graphics. 1996;14:33. doi: 10.1016/0263-7855(96)00018-5. [DOI] [PubMed] [Google Scholar]
- 54.Wang B, Raha K, Liao N, Peters MB, Kim H, Westerhoff LM, Wollacott AM, van de Vaart A, Gogonea V, Suarez D, Dixon SL, Vincent JJ, Brothers EN, Merz KM. DCQTP User Manual. 2005 [Google Scholar]
- 55.Dixon SL, Merz KM. J Chem Phys. 1996;104:6643. [Google Scholar]
- 56.Dixon SL, Merz KM. J Chem Phys. 1997;107:879. [Google Scholar]
- 57.Amadei A, Linssen ABM, Berendsen HJC. Proteins-Structure Function and Genetics. 1993;17:412. [Google Scholar]
- 58.Chakravorty DK, Kumarasiri M, Soudackov AV, Hammes-Schiffer S. J Chem Theory Comput. 2008;4:1974. doi: 10.1021/ct8003386. [DOI] [PMC free article] [PubMed] [Google Scholar]
- 59.Stein A, Rueda M, Panjkovich A, Orozco M, Aloy P. Structure. 2011;19:881. doi: 10.1016/j.str.2011.03.009. [DOI] [PubMed] [Google Scholar]
- 60.Shao JY, Tanner SW, Thompson N, Cheatham TE. J Chem Theory Comput. 2007;3:2312. doi: 10.1021/ct700119m. [DOI] [PubMed] [Google Scholar]
Associated Data
This section collects any data citations, data availability statements, or supplementary materials included in this article.