

Abstract
Please cite this paper as: Chu et al. (2011) Performance of rapid influenza H1N1 diagnostic tests: a meta‐analysis. Influenza and Other Respiratory Viruses DOI: 10.1111/j.1750‐2659.2011.00284.x.
Background Following the outbreaks of 2009 pandemic H1N1 infection, rapid influenza diagnostic tests have been used to detect H1N1 infection. However, no meta‐analysis has been undertaken to assess the diagnostic accuracy when this manuscript was drafted.
Methods The literature was systematically searched to identify studies that reported the performance of rapid tests. Random effects meta‐analyses were conducted to summarize the overall performance.
Results Seventeen studies were selected with 1879 cases and 3477 non‐cases. The overall sensitivity and specificity estimates of the rapid tests were 0·51 (95%CI: 0·41, 0·60) and 0·98 (95%CI: 0·94, 0·99). Studies reported heterogeneous sensitivity estimates, ranging from 0·11 to 0·88. If the prevalence was 30%, the overall positive and negative predictive values were 0·94 (95%CI: 0·85, 0·98) and 0·82 (95%CI: 0·79, 0·85). The overall specificities from different manufacturers were comparable, while there were some differences for the overall sensitivity estimates. BinaxNOW had a lower overall sensitivity of 0·39 (95%CI: 0·24, 0·57) compared with all the others (P‐value <0·001), whereas QuickVue had a higher overall sensitivity of 0·57 (95%CI: 0·50, 0·63) compared with all the others (P‐value = 0·005).
Conclusions Rapid tests have high specificity but low sensitivity and thus limited usefulness.
Keywords: Diagnostic tests, H1N1, meta‐analysis, rapid tests, sensitivity and specificity
Introduction
Real‐time reverse‐transcriptase polymerase chain reaction (rRT‐PCR) is the most accurate method in detecting influenza A (H1N1) virus infection in respiratory specimens. However, the facilities and expertise for performing rRT‐PCR are not uniformly available, and the results from rRT‐PCR are generally not immediately accessible, which poses challenges in establishing a diagnosis, especially in patients presenting late in their clinical course. 1 Rapid influenza diagnostic tests (henceforth, rapid tests) that detect influenza viral antigens produce quick results that can be used to screen patients with suspected influenza. Although as the 2009 pandemic H1N1 progressed, some new rapid tests were developed, the rapid tests used in the majority of studies were already in use and not developed specifically to detect H1N1. Specifically, during the beginning of the pandemic, their performance for the detection of 2009 pandemic H1N1 was not known. The lack of specific rapid and accurate diagnostics for H1N1 has been a major concern for monitoring and controlling outbreaks of 2009 pandemic influenza A (H1N1) infection. When they were developed, rapid influenza diagnostic tests were introduced as promising novel approach to detect this virus. Several commercial antigen assays, although not specifically designed for diagnosing 2009 pandemic H1N1, were quickly introduced to the market. However, rapid test performance has been less than optimal. 1 Compared to rRT‐PCR, several previous studies reported consistently high specificity but inconsistent estimates of sensitivity using rapid tests to detect 2009 H1N1 virus infection in upper respiratory specimens. 2 , 3 When this manuscript was drafted, no meta‐analysis of the diagnostic accuracy of rapid tests for diagnosing 2009 H1N1 had been reported, although Babin et al 4 published a meta‐analysis recently. Here, we use a comprehensive search strategy and meta‐analytic methods to determine the accuracy of existing rapid tests for diagnosing 2009 H1N1 virus infection.
Methods
Findings are reported according to the Quality of Reporting of Meta‐Analysis (QUOROM) statement 5 and the Standards for Reporting of Diagnostic Accuracy (STARD) statement. 6
Search strategy
The literature was systematically searched using predetermined inclusion criteria. Studies were included that reported the sensitivity and/or specificity of an influenza rapid test to detect the presence of 2009 pandemic influenza (H1N1) infection or contained sufficient information to calculate the sensitivity and specificity based on diagnosis of clinical specimens using the rRT‐PCR as a gold standard reference test. No language restrictions were applied. Studies were identified eligible for inclusion by searching the databases MEDLINE (NLOM, Bethesda, MD, USA) and EMBASE (Elsevier, Amsterdam, the Netherlands) using PUBMED and OVID interfaces, respectively. Publication dates were restricted to between 1/1/2009 and 1/15/2010, inclusive. Search terms for each database included the following: “influenza diagnostic,”“influenza rapid test,”“rapid test H1N1,” and “influenza rapid”. Subsequently, the title and abstract of each potential study were screened to determine potential eligibility, which was then confirmed by a review of the full text. References from eligible studies were also examined for additional potential studies, and papers referencing eligible studies were identified using Google Scholar and considered for inclusion.
Data synthesis and meta‐analysis
Data synthesis was performed according to guidelines on systematic reviews of diagnostic accuracy studies. 7 , 8 The bivariate logit‐normal random effects meta‐analyses were conducted to summarize the overall sensitivity and specificity of rapid tests. 9 , 10 , 11 , 12 , 13 , 14 Compared to fixed effects models, the random effects models typically provide conservative estimates with wider confidence intervals because it assumes that the meta‐analysis includes only a sample of all possible studies. In addition, the random effects models appropriately account for the difference in study sample sizes, both within‐study variability (random error) and between‐study variability (heterogeneity). 15 , 16 In general, the bivariate approach offers some advantages over separate univariate random effects meta‐analysis by accounting for the correlation between sensitivity and specificity. 17 , 18 , 19 This correlation will exist if the different studies use different test‐thresholds and thus are operating at different points along the underlying receiver operating characteristic (ROC) curve for the test. However, one study reported that the differences between univariate and bivariate random effects models for summarizing pooled sensitivity and specificity are trivial based on extensive simulations. 20 Thus, we utilized the univariate logit‐normal random effects meta‐analyses to generate forest plots (i.e., graphical display designed to illustrate the relative strength in meta‐analysis of multiple quantitative scientific studies addressing the same question) with overall and rapid test‐specific pooled estimates for both sensitivity and specificity. Parameters used to summarize diagnostic accuracy include the following: sensitivity and specificity directly estimated from the univariate and/or bivariate random effects models; positive and negative likelihood ratio, positive and negative predictive values, and the diagnostic odds ratio (DOR) derived from parameter estimates from the bivariate random effects models accounting for potential correlation between sensitivity and specificity estimates. In addition to reporting pooled sensitivity and specificity, which are often regarded as intrinsic properties of a diagnostic test, we also report other metrics because they are clinically more meaningful in some settings. Sensitivity is estimated by the proportion of positive tests among those with the disease of interest, whereas specificity is estimated by the proportion of negative tests among those without the disease. The positive (or negative) likelihood ratio is estimated by the ratio of the proportion of positive (or negative) tests in the diseased versus non‐diseased subjects. The positive (or negative) predictive value is estimated by the proportion of subjects with a positive (or negative) test who have (or do not have) the disease. The DOR, commonly considered a global measure of test performance, is estimated by the ratio of the odds of a positive test result in diseased subjects to the odds of a positive test result in non‐diseased subjects.
The Begg‐ and Mazumdar‐adjusted rank correlation test 21 and the Egger et al. 22 regression asymmetry test were used to assess publication bias for sensitivity and specificity, respectively. The Cochran’s Q‐test was used to detect heterogeneity. 23 Location (US versus non‐US) and rapid test manufacturer were included as covariates to examine their possibility as factors causing heterogeneity. Tests for small‐study effects were employed only when at least four studies were available. The univariate logit‐normal random effects meta‐analyses were implemented in r version 2·12·1 (http://cran.r‐project.org/) meta package, 24 , 25 and the bivariate random effects models were fitted using the NLMIXED procedure in sas version 9·2 (SAS Institute, Cary, NC, USA). The summary ROC curve was plotted based on the regression line of sensitivity on the false‐positive rate (1–Sp) in logit scale using the estimates from the bivariate random effects models 12 rather than the line proposed by Rutter and Gatsonis. 26 , 27
Results
We identified 2054 citations from MEDLINE and 775 citations from EMBASE, with overlap from the initial search. After screening titles and abstracts, 85 articles were eligible for full‐text review. Of these, 68 articles were excluded, and 17 articles 11 on the sensitivity (specificity) of rapid influenza H1N1 diagnostic test were included, as presented in Table 1. Three studies have contributed results for multiple rapid tests 28 , 29 , 30 producing a total of 22 sensitivity estimates and 12 specificity estimates. Specifically, six (three) studies reported sensitivity (specificity) estimates of BinaxNOW Influenza A & B 2 , 28 , 29 , 30 , 31 , 32 ; seven (four) studies reported sensitivity (specificity) estimates of QuickVue Influenza A + B 28 , 30 , 33 , 34 , 35 , 36 , 37 ; four (two) studies reported sensitivity (specificity) estimates of BD Directigen EZ Flu A + B test 28 , 30 , 38 , 39 ; two (one) studies reported sensitivity (specificity) estimates of Espline Influenza A & B 29 , 40 ; and one study reported sensitivity and specificity estimates of Xpect Flu A & B. 41 The seven (four) studies reporting sensitivity (specificity) of BD Directigen, Espline, and Xpect were grouped together because of small numbers of studies for these tests. One study reported sensitivity and specificity estimates of either BinaxNOW Influenza A & B test or the 3M Rapid Detection Flu A + B test, 42 and one study reported sensitivity estimate of either QuickVue Influenza A + B or SD Bioline Influenza Antigen test. These two studies are excluded for the analyses of pooled sensitivities and specificities of QuickVue Influenza A + B test and BinaxNOW Influenza A & B test as we cannot calculate the number of false positives, true negatives, false negatives, and true positives for either test. However, we included them for the analyses of pooled overall sensitivity and specificity of rapid tests.
Table 1.
Study details of articles that reported (or with enough information to back calculate) the number of true positives (TP), false negatives (FN), false positives (FP), and true negatives (TN) of rapid test for diagnosis of 2009 pandemic H1N1 on clinical specimens
| ID | First author | Month/year | Rapid tests | Population | Specimen type | Prospective | TP | FN | FP | TN |
|---|---|---|---|---|---|---|---|---|---|---|
| 1 | Balish | 08/2009 | BinaxNOW Influenza A & B | USA | Nasopharyngeal samples | Yes | 18 | 27 | ||
| QuickVue A + B | 31 | 14 | ||||||||
| Directigen EZ Flu A + B | 22 | 23 | ||||||||
| 2 | Blyth | 11/2009 | QuickVue A + B | Australia | Samples from nose and throat | Yes | 5 | 12 | ||
| 3 | Brouqui | 10/2009 | Directigen EZ Flu A + B | France | Source unspecified | Yes | 19 | 12 | 2 | 270 |
| 4 | Cheng | 02/2010 | Espline Influenza A & B | Hong Kong | Nasopharyngeal samples | Yes | 37 | 23 | ||
| 5 | Drexler | 10/2009 | BinaxNOW Influenza A & B | Germany | Samples from nose and throat | No | 16 | 128 | ||
| 6 | Faix | 08/2009 | QuickVue A + B | CA, USA | Source unspecified | Yes | 20 | 19 | 2 | 100 |
| 7 | Fuenzalida | 12/2009 | BinaxNOW Influenza A & B | Spain | Nasopharyngeal samples | Yes | 137 | 90 | 18 | 267 |
| 8 | Ginocchio | 06/2009 | BinaxNOW Influenza A & B or 3M Rapid Detection Flu A + B | NY, USA | Nasopharyngeal samples | Yes | 26 | 97 | 9 | 1699 |
| 9 | Karre | 11/2009 | Directigen EZ Flu A + B | CO, USA | Nasopharyngeal samples | Yes | 39 | 41 | 5 | 140 |
| 10 | Kok | 01/2010 | QuickVue A + B | Australia | Samples from nose and throat | Yes | 93 | 81 | 0 | 326 |
| 11 | Leveque | 01/2010 | BinaxNOW Influenza A & B | France | Nasal samples only | No | 9 | 16 | 0 | 5 |
| Espline Influenza A & B | 16 | 9 | 0 | 5 | ||||||
| 12 | Likitnukul | 11/2009 | QuickVue A + B or SD Bioline Influenza Antigen | Thailand | Nasal samples only | Yes | 376 | 53 | ||
| 13 | Sabetta | 11/2009 | Xpect Flu A & B | CT, USA | Nasopharyngeal samples | Yes | 23 | 26 | 2 | 12 |
| 14 | Sandora | 03/2010 | BinaxNOW Influenza A & B | MA, USA | Nasopharyngeal samples | Yes | 124 | 84 | 1 | 332 |
| 15 | Suntarattiwong | 04/2010 | QuickVue A + B | Thailand | Samples from nose and throat | Yes | 89 | 53 | 2 | 234 |
| 16 | Vasoo* | 10/2009 | BinaxNOW Influenza A & B | IL, USA | Nasopharyngeal samples | No | 23 | 37 | ||
| QuickVue A + B | 32 | 28 | ||||||||
| Directigen EZ Flu A + B | 28 | 32 | ||||||||
| 17 | Watcharananan | 01/2010 | QuickVue A + B | Thailand | Nasopharyngeal samples | Yes | 16 | 10 | 10 | 41 |
*Vasoo et al. incorrectly reported specificity for rapid tests on all confirmed positive specimens.
The average sample size of the included seventeen studies was 315 (range 17–1831), with a total of 1879 cases and 3477 non‐cases confirmed by rRT‐PCR. The majority (82% = 14 of 17) of the studies were prospective. The overall sensitivity and specificity estimates were 0·51 (95% CI: 0·41, 0·60; range 0·11–0·88) and 0·99 (95% CI: 0·94, 0·99; range 0·80–1·00) from the univariate random effects models. 1, 2 show the diagnostic accuracy measures from all the studies, stratified by the rapid test manufacturer using the bivariate random effects models. Based on the Q statistics, both the sensitivity and specificity showed highly significant between‐study heterogeneity in the summary results (P‐value <0·001).
Figure 1.
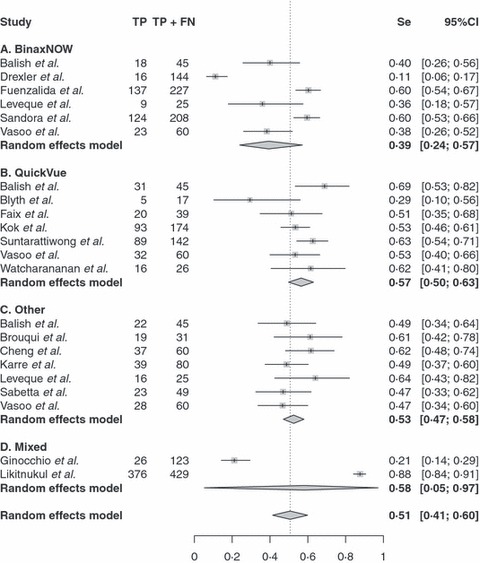
Forest plot of sensitivity estimates and 95% confidence intervals (CI). Point estimates of sensitivity from each study are shown as solid squares. Solid lines represent the 95% CIs. Squares are proportional to weights based on the random effects model. The pooled estimate and 95% CI is denoted by the diamond at the bottom. Se, sensitivity; TP, true positives; FN, false negatives.
Figure 2.

Forest plot of specificity estimates and 95% confidence intervals (CI). Point estimates of sensitivity from each study are shown as solid squares. Solid lines represent the 95% CIs. Squares are proportional to weights based on the random effects model. The pooled estimate and 95% CI is denoted by the diamond at the bottom. Sp, specificity; TN, true negatives; FP, false positives.
Specificity appeared to be more consistent than sensitivity from different manufacturers. The overall specificities from different manufacturers were comparable as seen in Figure 2. However, there were some differences for the overall sensitivity estimates from different manufacturers. BinaxNOW had a lower overall sensitivity (0·39 with 95%CI: 0·24, 0·57) compared with all the others (P‐value <0·001), whereas QuickVue had a higher overall sensitivity (0·57 with 95%CI: 0·50, 0·63) compared with all the others (P‐value = 0·005) from the bivariate random effects model.
Begg’s adjusted rank correlation test (P‐value = 0·40 and 0·53) showed no evidence of publication bias for both sensitivity and specificity, whereas the Egger’s regression asymmetry test (P‐value = 0·07 and 0·06) suggested that some publication bias may exist for both sensitivity and specificity. Because we had a total of 22 sensitivity estimates but only had 12 specificity estimates, we did not consider the modified Begg‐ and Mazumdar‐adjusted rank correlation test and the modified Egger et al. regression asymmetry test to detect the publication bias in log DOR scale, which has been shown to perform slightly better by simulations when equal sensitivity and specificity estimates are available. 43
Based on the bivariate logit‐normal random effects models, the correlation between sensitivity and specificity was only 0·32 (95%CI −0·64, 0·89) on the logit scale, suggesting no evidence of strong correlation. The overall positive likelihood ratio was 34·5 (95% CI: 12·7, 93·6), and the overall negative likelihood ratio was 0·48 (95%CI: 0·39, 0·60). The DOR was 71·6 (95%CI: 26·3, 194·6). Study location (US versus non‐US) was not associated with sensitivity and specificity (P‐value = 0·41 and 0·86, respectively). Sampling type (Nasopharyngeal samples versus the other) was not associated with sensitivity (P‐value = 0·95), but associated with specificity (P‐value = 0·03). Nasopharyngeal samples have a specificity of 0·97 (95%CI: 0·90, 0·99), and the other samples have a specificity of 1·00 (95%CI: 0·98, 1·00).
Figure 3A presents the 95% confidence region of the summary point, the 95% prediction region and the summary receiver operating characteristic curve. 44 The area under the curve was 0·68 (95%CI: 0·20, 0·92). Figure 3B shows the estimated positive and negative predictive values with their point‐wise 95% confidence intervals based on the overall estimates of sensitivity and specificity. For example, when the prevalence was 30%, the estimated overall positive and negative predictive values were 0·94 (95%CI: 0·85, 0·98) and 0·82 (95%CI: 0·79, 0·85), suggesting limited usefulness.
Figure 3.
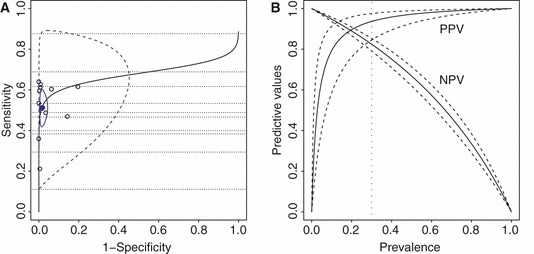
The summary receiver operating characteristic plot (panel A) and the overall PPV and NPV plot (panel B) based on the bivariate random effects model. In panel A, each open circle represents a study in the meta‐analysis with both sensitivity and specificity estimates of a rapid test; dotted lines represent those studies with only a sensitivity estimate of a rapid test; the solid circle represents the overall summary point; blue colored solid and dashed contour curves denote the boundaries of the 95% confidence region of the summary point and the 95% prediction region, respectively; black solid lines represent the summary receiver operating characteristic curve. In panel B, solid and dashed lines denote the estimate and 95% confidence interval; PPV, positive predictive value; NPV, negative predictive value.
Discussion
An extensive literature search indentified 17 articles that reported rapid test results from clinical specimens. Meta‐analysis results showed that the specificity estimates for existing commercial rapid tests are high and relatively consistent ranging from 0·80 to 1·00. However, the sensitivity is low and highly variable ranging from 0·11 to 0·88. A lack of sensitivity is of particular concern in the present setting. Rapid tests are useful as a screening device to the extent that they identify possible cases. Therefore, high sensitivity is essential.
Rapid tests with improved performance are needed. Alternatively, testing strategies that employ multiple rapid tests may improve sensitivity. For example, use of two different rapid tests on sequential biologic samples of the same individual may provide partially independent information. If an individual is defined as positive when at least one of the rapid tests is positive, the upper bound on improved sensitivity is the complement of the probability that both tests yield false‐negative results. Using the overall sensitivity estimates from QuickVue and other manufactures, this would yield an possibly acceptable sensitivity of 0·80 = 1−(1−0·57) × (1−0·53) if the tests work independently. However, this strategy would double the cost of testing and would also require the collection of a second sample, delaying time to results.
In conclusion, real‐time reverse‐transcriptase polymerase chain reaction remains the most accurate method for detecting 2009 pandemic influenza A (H1N1) virus infection. Because rRT‐PCR results are not immediately accessible, and a laboratory with the necessary equipment and required skill level to avoid common technical errors that may occur with rRT‐PCR may not be available, rapid procedures with adequate diagnostic test characteristics are needed, and existing rapid tests are inadequate. Alternative solutions to address poor test sensitivity are needed.
Funding statement
Dr. Haitao Chu was supported in part by the U.S. Department of Health and Human Services Agency for Healthcare Research and Quality Grant R03HS020666 and P01CA142538 from the U.S. National Cancer Institute.
Financial disclosures
None reported.
Conflicts of interests
None reported.
Acknowledgements
The authors would like to thank Drs. Dennis Faix, Thomas Sandora, and Alex McAdam for their contribution of additional data, as well as Drs. Hugo Lopez‐Gatell, Guido Schwarzer, and Loic Desquilbet for expert advice.
References
- 1. Uyeki T. Diagnostic testing for 2009 pandemic influenza A (H1N1) virus infection in hospitalized patients. N Engl J Med 2009; 361:e114. [DOI] [PubMed] [Google Scholar]
- 2. Drexler JF, Helmer A, Kirberg H et al. Poor clinical sensitivity of rapid antigen test for influenza A pandemic (H1N1) 2009 virus. Emerg Infect Dis 2009; 15:1662–1664. [DOI] [PMC free article] [PubMed] [Google Scholar]
- 3. Likitnukul S, Boonsiri K, Tangsuksant Y. Evaluation of sensitivity and specificity of rapid influenza diagnostic tests for novel swine‐origin influenza A (H1N1) Virus. Pediatr Infect Dis J 2009; 28:1038–1039. [DOI] [PubMed] [Google Scholar]
- 4. Babin SM, Hsieh YH, Rothman RE, Gaydos CA. A meta‐analysis of point‐of‐care laboratory tests in the diagnosis of novel 2009 swine‐lineage pandemic influenza A (H1N1). Diagn Microbiol Infect Dis 2011; 69:410–418. [DOI] [PMC free article] [PubMed] [Google Scholar]
- 5. Moher D, Cook DJ, Eastwood S, Olkin I, Rennie D, Stroup DF. Improving the quality of reports of meta‐analyses of randomised controlled trials: the QUOROM statement. Lancet 1999; 354:1896–1900. [DOI] [PubMed] [Google Scholar]
- 6. Bossuyt PM, Reitsma JB, Bruns DE et al. Towards complete and accurate reporting of studies of diagnostic accuracy: the STARD Initiative. Ann Intern Med 2003; 138:40–44. [DOI] [PubMed] [Google Scholar]
- 7. Irwig L, Tosteson ANA, Gatsonis C et al. Guidelines for meta‐analyses evaluating diagnostic tests. Ann Intern Med 1994; 120:667–676. [DOI] [PubMed] [Google Scholar]
- 8. Gatsonis C, Paliwal P. Meta‐analysis of diagnostic and screening test accuracy evaluations: methodologic primer. Am J Roentgenol 2006; 187:271–281. [DOI] [PubMed] [Google Scholar]
- 9. Dersimonian R, Laird N. Meta‐analysis in clinical trials. Control Clin Trials 1986; 7:177–188. [DOI] [PubMed] [Google Scholar]
- 10. Chu H, Cole SR. Bivariate meta‐analysis of sensitivity and specificity with sparse data: a generalized linear mixed model approach. J Clin Epidemiol 2006; 59:1331–1332. [DOI] [PubMed] [Google Scholar]
- 11. Harbord RM, Deeks JJ, Egger M, Whiting P, Sterne JAC. A unification of models for meta‐analysis of diagnostic accuracy studies. Biostatistics 2007; 8:239–251. [DOI] [PubMed] [Google Scholar]
- 12. Chu H, Guo H. Letter to the editor: a unification of models for meta‐analysis of diagnostic accuracy studies. Biostatistics 2009; 10:201–203. [DOI] [PMC free article] [PubMed] [Google Scholar]
- 13. Zwinderman AH, Bossuyt PM. We should not pool diagnostic likelihood ratios in systematic reviews. Stat Med 2008; 27:687–697. [DOI] [PubMed] [Google Scholar]
- 14. Chu H, Guo H, Zhou Y. Bivariate random effects meta‐analysis of diagnostic studies using generalized linear mixed models. Med Decis Making 2010; 30:499–508. [DOI] [PMC free article] [PubMed] [Google Scholar]
- 15. Poole C, Greenland S. Random‐effects meta‐analyses are not always conservative. Am J Epidemiol 1999; 150:469–475. [DOI] [PubMed] [Google Scholar]
- 16. Lau J, Ioannidis JPA, Schmid CH. Quantitative synthesis in systematic reviews. Ann Intern Med 1997; 127:820–826. [DOI] [PubMed] [Google Scholar]
- 17. Riley R, Abrams K, Sutton A, Lambert P, Thompson J. Bivariate random‐effects meta‐analysis and the estimation of between‐study correlation. BMC Med Res Methodol 2007; 7:3. [DOI] [PMC free article] [PubMed] [Google Scholar]
- 18. Riley RD, Thompson JR, Abrams KR. An alternative model for bivariate random‐effects meta‐analysis when the within‐study correlations are unknown. Biostatistics 2008; 9:172–186. [DOI] [PubMed] [Google Scholar]
- 19. Hamza TH, van Houwelingen HC, Stijnen T. The binomial distribution of meta‐analysis was preferred to model within‐study variability. J Clin Epidemiol 2008; 61:41–51. [DOI] [PubMed] [Google Scholar]
- 20. Simel DL, Bossuyt PMM. Differences between univariate and bivariate models for summarizing diagnostic accuracy may not be large. J Clin Epidemiol 2009; 62:1292–1300. [DOI] [PubMed] [Google Scholar]
- 21. Begg CB, Mazumdar M. Operating characteristics of a rank correlation test for publication bias. Biometrics 1994; 50(4):1088–1101. [PubMed] [Google Scholar]
- 22. Egger M, Smith GD, Schneider M, Minder C. Bias in meta‐analysis detected by a simple, graphical test. BMJ 1997; 315:629–634. [DOI] [PMC free article] [PubMed] [Google Scholar]
- 23. Egger M, Smith GD, Altman DG. Systematic Reviews in Health Care: Meta‐Analysis in Context, 2nd edn London: BMJ Publishing Group, 2001. [Google Scholar]
- 24. Ihaka R, Gentleman R. R: a language for data analysis and graphics. J Comput Graph Stat 1996; 5(3):299–314. [Google Scholar]
- 25. Schwarzer G. Meta: an R package for meta‐analysis. R News 2007; 7(3):40–45. [Google Scholar]
- 26. Rutter CA, Gatsonis CA. A hierarchical regression approach to meta‐analysis of diagnostic test accuracy evaluations. Stat Med 2001; 20:2865–2884. [DOI] [PubMed] [Google Scholar]
- 27. Rucker G, Schumacher M. Letter to the editor. Biostatistics 2009; 10:806–807. [DOI] [PubMed] [Google Scholar]
- 28. Balish A, Warnes CM, Wu K et al. Evaluation of rapid influenza diagnostic tests for detection of novel influenza A (H1N1) virus‐United States, 2009 (reprinted from MMWR, vol 58, pg 826‐829, 2009). J Am Med Assoc 2009; 302:1163–1164. [Google Scholar]
- 29. Leveque N, Coste JF, Renois F, Brodard V, De Champs C, Andreoletti L. Preliminary evaluation of two rapid antigen assays for novel influenza A (H1N1) virus detection from clinical specimens. J Med Microbiol 2010; 59:508–509. [DOI] [PubMed] [Google Scholar]
- 30. Vasoo S, Stevens J, Singh K. Rapid antigen tests for diagnosis of pandemic (swine) influenza A/H1N1. Clin Infect Dis 2009; 49:1090–1093. [DOI] [PMC free article] [PubMed] [Google Scholar]
- 31. Fuenzalida L, Blanco S, Prat C et al. Utility of the rapid antigen detection BinaxNOW A&B test for detection of novel influenza A (H1N1) virus. Clin Microbiol Infect. 2010; 16:1574–1576. [DOI] [PubMed] [Google Scholar]
- 32. Sandora TJ, Smole SC, Lee GM, Chung S, Williams L, McAdam AJ. Test characteristics of commercial influenza assays for detecting pandemic influenza A (H1N1) in children. Pediatr Infect Dis J 2010; 29:261–262. [DOI] [PubMed] [Google Scholar]
- 33. Blyth CC, Iredell JR, Dwyer DE. Rapid‐test sensitivity for novel swine‐origin influenza A (H1N1) virus in humans. N Engl J Med 2009; 361:2493. [DOI] [PubMed] [Google Scholar]
- 34. Faix DJ, Sherman SS. Rapid‐test sensitivity for novel swine‐origin influenza A (H1N1) virus in humans. N Engl J Med 2009; 361:728–729. [DOI] [PubMed] [Google Scholar]
- 35. Kok J, Blyth CC, Foo H et al. Comparison of a rapid antigen test with nucleic acid testing during co‐circulation of pandemic influenza A/H1N1 2009 and seasonal influenza A/H3N2. J Clin Microbiol 2010; 48:290–291. [DOI] [PMC free article] [PubMed] [Google Scholar]
- 36. Suntarattiwong P, Jarman RG, Levy J et al. Clinical performance of a rapid influenza test and comparison of nasal versus throat swabs to detect 2009 pandemic influenza A (H1N1) infection in Thai children. Pediatr Infect Dis J 2010; 29:366–367. [DOI] [PubMed] [Google Scholar]
- 37. Watcharananan S, Kiertiburanakul S, Chantratita W. Rapid influenza diagnostic test during the outbreak of the novel influenza A/H1N1 2009 in Thailand: an experience with better test performance in resource limited setting. J Infect 2010; 60:86–87. [DOI] [PubMed] [Google Scholar]
- 38. Brouqui P, Vu Hai V, Nougairede A et al. Improving the diagnostic efficiency of H1N1 2009 pandemic flu: analysis of predictive clinical signs through a prospective cohort. PLoS curr Influenza 2009; 1:RRN1120. [DOI] [PMC free article] [PubMed] [Google Scholar]
- 39. Karre T, Maguire HF, Butcher D, Graepler A, Weed D, Wilson ML. Comparison of Becton Dickinson Directigen EZ Flu A+B test against the CDC real‐time PCR assay for detection of 2009 pandemic influenza A/H1N1 virus. J Clin Microbiol 2010; 48(1):343–344. [DOI] [PMC free article] [PubMed] [Google Scholar]
- 40. Cheng PK, Wong KK, Mak GC et al. Performance of laboratory diagnostics for the detection of influenza A(H1N1)v virus as correlated with the time after symptom onset and viral load. J Clin Virol 2010; 47:182–185. [DOI] [PubMed] [Google Scholar]
- 41. Sabetta JR, Smardin J, Burns L et al. Performance of rapid influenza diagnostic tests during two school outbreaks of 2009 pandemic influenza A (H1N1) virus infection‐Connecticut, 2009 (Reprinted from MMWR, vol 58, pg 1029–1032, 2009). J Am Med Assoc 2009; 302:1962–1964. [PubMed] [Google Scholar]
- 42. Ginocchio CC, Zhang F, Manji R et al. Evaluation of multiple test methods for the detection of the novel 2009 influenza A (H1N1) during the New York City outbreak. J Clin Virol 2009; 45:191–195. [DOI] [PMC free article] [PubMed] [Google Scholar]
- 43. Deeks JJ, Macaskill P, Irwig L. The performance of tests of publication bias and other sample size effects in systematic reviews of diagnostic test accuracy was assessed. J Clin Epidemiol 2005; 58:882–893. [DOI] [PubMed] [Google Scholar]
- 44. Hanley JA, McNeil BJ. The meaning and use of the area under a receiver operating characteristic (ROC) curve. Radiology 1982; 143:29–36. [DOI] [PubMed] [Google Scholar]