

Abstract
Although differences among people are frequently assumed to increase with age, cross-sectional comparisons of measures of brain structure and measures of cognitive functioning often reveal similar magnitudes of between-person variability across most of adulthood. The phenomenon of nearly constant variability despite systematically lower means with increased age suggests that individual differences in rates of aging may be relatively small, particularly compared to the individual differences apparent at any age. The current study examined between-person variability in cross-sectional means and in short-term longitudinal changes in five cognitive abilities at different ages in adulthood. The variability in both level and change in cognitive performance was found to be similar among healthy adults from 25 to 75 years of age in all five cognitive abilities. Furthermore, the correlations between scores at the first and second occasions were very high, and nearly the same magnitude at all ages. The results indicate that between-person differences in short-term cognitive changes are not inevitably greater among healthy older adults than among young adults.
An intriguing pattern of negative age trends on measures of central tendency with little or no relation of age on indices of between-person variability is often apparent in measures of brain structure among samples of healthy adults spanning a wide age range. Few direct quantitative comparisons have been reported, but scatter plots in the published articles frequently reveal negative cross-sectional age trends with little age-related increase in between-person variability. This pattern is illustrated in the top two panels of Figure 1 with data on cerebral volume and cortical thickness, and similar figures with these characteristics have been reported in studies of total or regional brain volume (e.g., Abe, et al. 2008; Allen, et al. 2005; DeCarli, et al. 2005; Fotenos, et al. 2005; 2008; Good, et al. 2001; Kennedy et al. 2009; Kruggel, 2006; Lemaitre et al. 2010; Salat, et al. 2009; Sowell, et al. 2003; Terribilli et al. 2009; Zimmerman, et al. 2006), studies of cortical thickness (e.g., Ecker, et al. 2009; Lemaitre, et al. 2010; Salat, et al. 2004), and studies of white matter integrity based on diffusion tensor imaging (e.g., Abe, et al. 2008; Charlton, et al. 2006; Grieve, et al. 2007; Hsu, et al. 2008; Michiliese, et al. 2010; Rovaris, et al. 2003; Salat, et al. 2005; Stadlbauer, et al. 2008; Sullivan & Pfefferbaum, 2006; Voineskos, et al. 2010; Westlye, et al. 2010).
Figure 1.
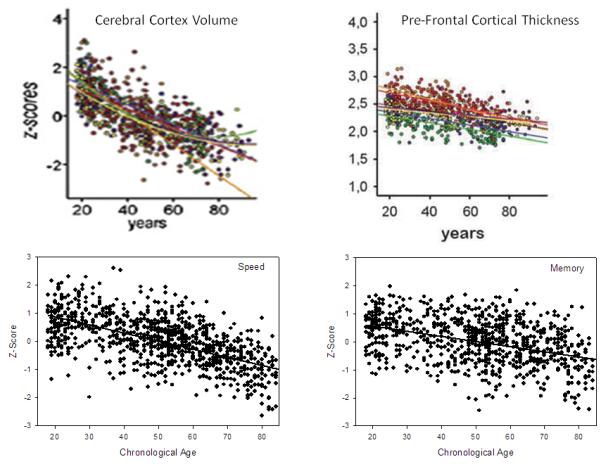
Top panel. Scatter plots of cerebral cortex volume (Walhovd, et al. in press) and cortical thickness (Fjell, et al. 2009) as a function of age. Bottom panel. Scatter plots of memory and speed composite scores for a random 25% of the VCAP sample as a function of age. Note that although the values in each panel are lower with increased age, the variability in the scores is similar at all ages.
The phenomenon of negative relations between age and level of performance with little or no relations of age on between-person variability is also evident with a variety of cognitive variables in moderately large samples of healthy adults (cf. Figures 1.12 to 1.15 in Salthouse, 2010a). This pattern is illustrated in the bottom two panels of Figure 1 which portray composite scores for speed and memory abilities from a random 25% of the participants in the current project.
The nearly constant variability at different ages is surprising because it is often assumed that individual differences in rates of aging are superimposed on pre-existing individual differences to produce greater between-person variability at older ages. It is likely that variability does increase with age in samples containing substantial numbers of individuals with various health conditions that affect cognitive functioning or who are in the early stages of dementia. Nevertheless, the available evidence suggests that age-related decreases in mean values are not inevitably accompanied by age-related increases in between-person variability.
Although reports of nearly constant variability with increased age are well documented in cross-sectional studies of brain structure (see earlier citations) and of cognitive functioning (e.g., Johnson, et al. 2010; Salthouse, 2010a), comparisons of variability in level of performance at different ages provide only indirect evidence of individual differences in rates of change. That is, the lack of an age-related increase in variability is consistent with an inference that there was little variability in the changes from Time 1 to Time 2, but longitudinal data are needed to allow direct examination of individual differences in within-person changes.
Only limited information about variability of longitudinal changes at different ages in adulthood has been reported, but what is available suggests that individual differences in change may be nearly constant across adulthood. For example, little indication of an increase with age in measures of between-person variability in cognitive change was evident in two analyses of data from the Baltimore Longitudinal Study of Aging (i.e., Alder, et al. 1990; Giambra, et al. 1995). Furthermore, the standard deviations for measures of cognitive change were similar at different ages in reports of a project by Ronnlund and colleagues (i.e., Ronnlund, et al. 2005; Ronnlund & Nilsson, 2006; also see Figure 2 in Salthouse, 2011a).
Information about variability in longitudinal change is also available from correlations between the scores across two occasions (i.e., T1 and T2) because these stability coefficients are inversely related to the variability of change across the T1-T2 interval. Stability coefficients with measures of cognitive functioning are often quite high, particularly when they are based on composite or factor scores that minimize measurement error. For example, Ronnlund, et al. (2005) reported 5-year stability coefficients of .80 for an episodic memory factor and .89 for a semantic memory factor. The estimated correlation for a latent construct of fluid intelligence over a 5-year interval was .98 in a study by Raz, et al. (2008), and Zimprich and Mascherek (2010) recently reported 12-year stabilities of .95 for a fluid intelligence construct, .93 for a crystallized intelligence construct, .91 for a speed construct, and .58 for a memory construct. Only two reports could be found in which stability coefficients were computed for adults in different age groups, and both suggested little or no age differences in the magnitude of stability. Hertzog and Schaie (1986) reported stability coefficients across a 7-year interval for a latent construct representing general cognitive ability of .89, .93, and .94 for adults aged 30 to 39, 42 to 53, and 53 to 74, respectively. In a later analysis of data from the same project (Schaie, 2005, Table 8.10), the median 7-year stabilities for six cognitive abilities were .88 for adults age 32 to 39, .93 for adults age 46 to 74, and .98 for adults age 76 to 83.
The existing results raise the possibility that age-related influences on cognitive functioning are operating in a similar manner among healthy adults across most of adulthood. The major goal of the current project was to investigate this implication in more detail by examining relations of age on measures of central tendency (i.e., mean) and variability (i.e., standard deviation) for the cross-sectional differences and longitudinal changes in five cognitive abilities. Because measurement error can inflate estimates of variability and attenuate stability correlations, the analyses were carried out on composite scores, which tend to reduce measurement error because of the principle of aggregation (i.e., Rushton et al., 1983), and on latent constructs, which eliminate measurement error because only reliable variance can be shared to form constructs.
Method
Participants
The data were derived from the Virginia Cognitive Aging Project (VCAP), which is an ongoing cross-sectional and longitudinal study of cognitive aging (Salthouse, 2010b; Salthouse & Tucker-Drob, 2008). As of December 2010, a total of 3,781 adults between 18 and 98 years of age had participated at least once, and 1,623 of them had returned for at least one additional longitudinal session, with intervals between the first and second occasions ranging from less than 1 year to over 9 years.
Because analyses of variability are most stable when the samples are relatively large, the cross-sectional VCAP sample was divided into four nearly equal-sized groups of over 900 individuals each. The distribution of ages in the sample was not completely rectangular, and therefore the mean ages of the groups were not equally spaced (i.e., mean ages of 26, 46, 58, and 75). Characteristics of the participants in the four age groups are summarized in Table 1. It can be seen that the majority of the participants were female, that the average self-reported health was in the very good range, and that the participants had completed an average of over 15 years of education.
Table 1.
Characteristics of participants in four age groups
| Age Group | ||||
|---|---|---|---|---|
| 18-36 | 37-52 | 53-65 | 66-97 | |
| Number | ||||
| Cross-Sectional | 955 | 939 | 975 | 912 |
| Longitudinal | 280 | 445 | 462 | 436 |
| Age | ||||
| Cross-Sectional | 25.8 (5.4) | 46.0 (4.3) | 58.4 (3.7) | 75.1 (6.5) |
| Longitudinal | 25.9 (5.9) | 46.0 (4.3) | 58.5 (3.7) | 74.3 (6.1) |
| Proportion Female | ||||
| Cross-Sectional | .60 | .74 | .69 | .57 |
| Longitudinal | .58 | .74 | .68 | .56 |
| Self-Rated Health (1= “excellent”, 5 = “poor”) | ||||
| Cross-Sectional | 2.0 (0.8) | 2.1 (0.9) | 2.1 (0.9) | 2.4 (0.9) |
| Longitudinal | 2.1 (0.9) | 2.1 (0.9) | 2.1 (0.9) | 2.4 (0.9) |
| Years of Education | ||||
| Cross-Sectional | 15.1 (2.4) | 15.4 (2.6) | 16.1 (2.7) | 16.0 (2.9) |
| Longitudinal | 14.6 (2.2) | 15.5 (2.5) | 16.3 (2.6) | 16.0 (3.0) |
| Scaled Scores Vocabulary |
||||
| Cross-Sectional | 12.9 (3.3) | 11.5 (3.1) | 12.8 (2.7) | 13.0 (2.8) |
| Longitudinal | 12.7 (3.2) | 11.8 (3.0) | 13.3 (2.5) | 13.4 (2.9) |
| Digit Symbol | ||||
| Cross-Sectional | 11.3 (2.9) | 10.8 (2.9) | 11.5 (2.8) | 11.6 (2.8) |
| Longitudinal | 11.0 (2.8) | 11.2 (2.9) | 11.8 (2.8) | 11.9 (2.7) |
| Logical Memory | ||||
| Cross-Sectional | 11.6 (2.8) | 11.3 (2.9) | 12.1 (2.9) | 12.1(2.9) |
| Longitudinal | 11.3 (2.9) | 11.5 (2.8) | 12.5 (2.7) | 12.6 (2.8) |
| Word Recall | ||||
| Cross-Sectional | 12.3 (3.1) | 11.8 (3.5) | 12.6 (3.3) | 12.0 (3.4) |
| Longitudinal | 11.9 (3.3) | 12.2 (3.5) | 13.1 (3.0) | 12.5 (3.2) |
| T1-T2 Interval (years) | 2.4 (1.0) | 2.8 (1.3) | 2.6 (1.1) | 2.5 (1.1) |
Note: Values in parentheses are standard deviations. Longitudinal participants are a subset of the cross-sectional participants. Scaled scores are age-adjusted scores from Wechsler (1997a, 1997b).
As a means of evaluating the representativeness of the sample, age-adjusted scaled scores are reported for four tests from the Wechsler Adult Intelligence Scale III (Wechsler, 1997a) and the Wechsler Memory Scale III (Wechsler, 1997b). These age-adjusted scores have means of 10 and standard deviations of 3 in the nationally representative normative samples, and therefore it can be inferred that participants in the current sample were functioning between .5 and 1 standard deviation above the national norms. Importantly for the age comparisons, however, is that there were relatively small relations of age to the age-adjusted scaled scores for four cognitive variables, indicating roughly comparable positive selection at all ages. Details on selective attrition at different ages in the longitudinal sample have been reported elsewhere (Salthouse, 2010b).
Cognitive tests
Each participant completed 16 cognitive tests designed to represent five cognitive abilities. Reasoning was assessed with the Raven’s Advanced Progressive Matrices (Raven, 1962), Shipley Abstraction (Zachary, 1986), and Letter Sets (Ekstrom, et al. 1976) tests. Spatial visualization was assessed with the Spatial Relations test from the Differential Aptitude Test Battery (Bennett, et al. 1997), the Paper Folding test from the Educational Testing Service Kit of Factor-Referenced Cognitive Tests (Ekstrom, et al. 1976), and the Form Boards test (Ekstrom, et al. 1976). Speed was measured with Digit Symbol (Wechsler, 1997a), Letter Comparison (Salthouse & Babcock, 1991), and Pattern Comparison (Salthouse & Babcock, 1991) tests. Episodic memory was assessed with the Logical Memory and Word List tests from the Wechsler Memory Scale III (Wechsler, 1997b), and with a locally developed Paired Associates test (Salthouse, Fristoe & Rhee, 1996). Vocabulary was measured with Wechsler Adult Intelligence Scale III Vocabulary (Wechsler, 1997a), Picture Vocabulary from the Woodcock-Johnson Cognitive Ability test (Woodcock & Johnson, 1989), Antonym Vocabulary (Salthouse, 1993), and Synonym Vocabulary tests (Salthouse, 1993). Descriptions of the tests and their sources, as well as information about reliability and validity in the form of confirmatory factor analyses indicating the pattern of relations of variables to ability constructs, are contained in other articles (Salthouse, 2004, 2005, 2010b; Salthouse & Ferrer-Caja, 2003; Salthouse et al. 2008).
Analyses
Scores of each test were converted to z scores based on the distribution of scores in the entire sample at T1, and then two sets of analyses were conducted. One set was conducted on composite scores formed by averaging the z-scores for the variables representing the vocabulary, reasoning, spatial visualization, memory, and speed abilities. Longitudinal change was then computed for each of the five cognitive abilities by subtracting the T1 composite score from the T2 composite score, and stability coefficients were obtained by computing correlations between the composite scores at T1 and T2.
A second set of analyses was based on latent constructs defined by the variance common to the relevant variables for each cognitive ability. Correlations were computed between constructs at T1 and T2, and latent change models (i.e., Ferrer & McArdle, 2010) were also used to examine the relation of age to the latent level and latent change parameters, and to estimates of the variability in those parameters. Finally, the T1 construct, age, the interval between the T1 and T2 measurements, and the interaction of age and the T1-T2 interval were used as predictors of the T2 construct to investigate effects of the length of the longitudinal interval on the relation between the T1 and T2 scores.
Results
Between-Person Variability
The top left panel of Figure 2 contains standard deviations of the T1 composite scores in the four age groups, and the top right panel contains the standard deviations of the T2-T1 differences in the composite scores in the four age groups. Note that there was no systematic relation of age on the measures of between-person variability in either the level (T1) or change (T2-T1) scores. Similar information for the estimated standard deviations (i.e., square root of the estimated variances) of the latent level and latent change parameters are portrayed in the bottom two panels of Figure 2. As with the composite scores, age differences on the measures of variability were small to non-existent for both the level and change parameters.
Figure 2.
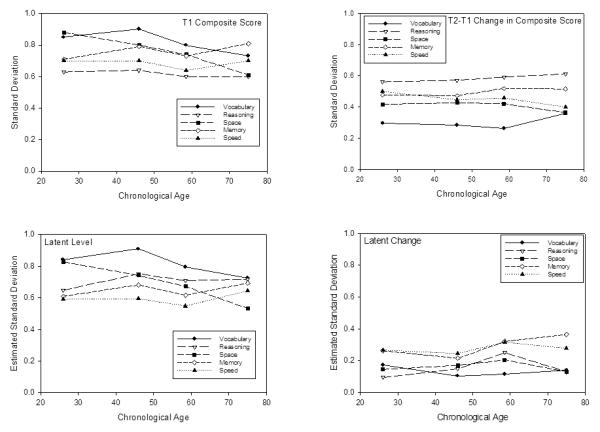
Standard deviations of T1 composite scores (top left) and of T2-T1 changes in composite scores (top right) for five cognitive abilities in four age groups. The bottom left and bottom right panels contain estimated standard deviations for latent level and latent change parameters derived from latent change models (cf. Ferrer & McArdle, 2010) separately applied to the five abilities and four age groups.
It is important to note that the lack of an age relation on between-person variability in Figure 2 occurs despite systematic relations of age on the T1 scores and on the T2-T1 changes. That is, Table 2 contains correlations of age with T1 composites and T2-T1 changes in the composites, and with the latent level and latent change parameters from the latent change models, and all correlations were significantly negative. Age-related effects on the changes were evident in both the direction and magnitude of change as paired t-tests revealed that the T2-T1 changes in the composite scores were significantly positive in the youngest (18-36) group for all cognitive abilities except speed, and were significantly negative in the oldest (66-97) group for all abilities except spatial visualization.
Table 2.
Correlations of age with T1 level and T2-T1 change in composite scores and with level and change parameters from latent change models
| Composite Scores | Latent Change | |||
|---|---|---|---|---|
| T1 | T2-T1 | Level | Change | |
| Vocabulary | .25* | −.20* | .26* | −.46* |
| Reasoning | −.42* | −.29* | −.54* | −.18* |
| Space | −.48* | −.17* | −.51* | −.35* |
| Memory | −.44* | −.24* | −.51* | −.36* |
| Speed | −.63* | −.17* | −.69* | −.28* |
p<.01
Stability Coefficients
Correlations between T1 and T2 of composite scores and of latent constructs in the five abilities are presented in Table 3 for the four age groups. The correlations involving composite scores were likely attenuated because of the presence of measurement error, but because only reliable variance can be shared, latent constructs have no measurement error and thus their correlations are not attenuated by measurement error. It is therefore noteworthy that all of the stability coefficients for the latent constructs in Table 3 were very close to 1, and only those for memory ability exhibited a trend toward lower stability at older ages.
Table 3.
Stability coefficients (T1-T2 correlations) in five cognitive abilities
| Composite scores | ||||
| 18-36 | 37-52 | 53-65 | 66-97 | |
| Vocabulary | .94 | .94 | .93 | .87 |
| Reasoning | .72 | .72 | .65 | .60 |
| Space | .91 | .86 | .84 | .83 |
| Memory | .80 | .82 | .72 | .77 |
| Speed | .78 | .81 | .77 | .81 |
| Latent Constructs | ||||
| 18-36 | 37-52 | 53-65 | 66-97 | |
| Vocabulary | .98 | .99 | .99 | .98 |
| Reasoning | .99 | .98 | .94 | .99 |
| Space | .99 | .97 | .96 | .97 |
| Memory | .93 | .95 | .86 | .87 |
| Speed | .92 | .93 | .84 | .91 |
Note: All correlations significantly greater than zero at p<.01.
Influence of T1-T2 Interval
Because the interval between the T1 and T2 assessments varied across participants (cf. Salthouse, 2011b), the influence of the length of the T1-T2 interval on the relations between the T1 and T2 scores was also examined. The analyses consisted of using the interval, age, and the cross-product age-by-interval interaction terms in addition to the T1 construct as predictors of the T2 latent construct.
As one would expect from the high stability coefficients, the T1 construct was a strong predictor of the T2 construct with every cognitive ability, as the standardized regression coefficients were 1.0 for vocabulary, .96 for reasoning, .94 for spatial visualization, .84 for memory, and .90 for speed. Importantly, however, neither age nor the length of the interval between the T1 and T2 assessments were significant predictors of the T2 construct when they were considered simultaneously with the T1 construct. The interaction of age and interval was significant only with the memory ability construct, in the direction of weaker T1-T2 relations with longer intervals at older ages. This pattern was manifested in the stability coefficients as all of the stability coefficients for the memory construct were greater than .89, except among older adults with intervals longer than the median, in which the stability coefficients were .80 for the age 53-65 group and .78 for the age 66-97 group.
Relations of age on different regions of the distributions
Additional analyses were carried out to examine the distributions of change within each age group in more detail. Although there is little evidence in Figure 2 of relations between age and variability, it is possible that the overall variance could have remained constant if the relations of age varied across different regions of the distribution. For example, age-related increases in variability could have been obscured if a functional floor was operating to limit the lowest values in the distribution, or if there was greater attrition among the lowest performing older adults such that the lower region of the initial distribution was not represented in the longitudinal sample. One method of investigating these possibilities is to examine performance at different percentiles within the distributions of longitudinal changes at each age. The rationale is that if there are differential age-related influences on particular regions of the distribution, then the functions relating performance at different percentiles should either diverge or converge with increased age, and should not be parallel.
The five panels of Figure 3 portray the T2-T1 composite score differences at the 10th, 25th, 50th, 75th, and 90th percentiles in each age group. It can be seen that the age trends in each percentile were nearly parallel, with approximately the same age relation at every percentile in the distribution. In particular, although there were age differences in the absolute magnitudes of change, the relations of age on the 50th percentile scores were remarkably similar to those on the 10th and 90th percentiles in every cognitive ability. These data therefore suggest that the nearly constant variability across adulthood is not an artifact of differential influences on some regions of the distribution, but instead seems to reflect a nearly uniform downward shift of the entire distribution without appreciable distortions of the shape of the distribution.
Figure 3.
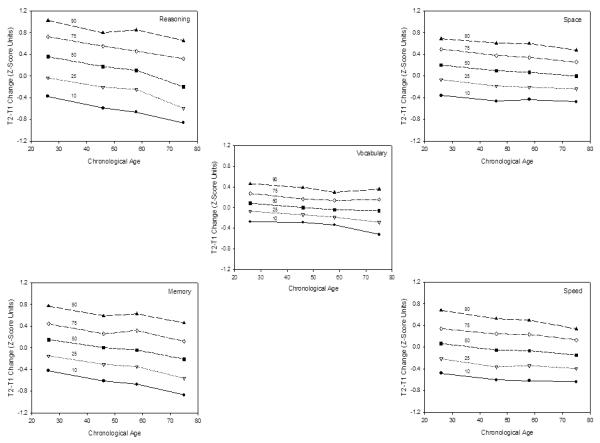
Longitudinal changes (T2-T1 differences) in composite scores at the 10th, 25th, 50th, 75th, and 90th percentiles within the distribution at each age for the five cognitive abilities.
Discussion
Despite negative relations between age and both level and change in cognitive performance, the results of this study indicate that there is little evidence of an age-related increase in the magnitude of individual differences in either the cross-sectional differences or longitudinal changes in five cognitive abilities. Furthermore, the lack of systematic age differences on the estimates of change variance in Figure 2, on the stability coefficients in Table 3, or on the distribution percentiles in Figure 3, suggests that whatever is contributing to change or stability may be operating in a similar fashion throughout adulthood.
The results in Figure 2 indicate that the individual differences in change over time are much smaller than the individual differences in the level of performance at a single point in time. Moreover, the stability coefficients were very close to 1.0 when measurement error was taken into consideration with latent constructs. This combination of high stability and small variance in change indicates that only a small portion of the individual differences apparent at any given age are attributable to individual differences in rates of short-term change. Importantly from the current perspective, not only were the absolute levels of variability and stability quite high, but the values were very similar across a large span of adulthood.
Memory ability is somewhat of an exception to the general pattern as it had lower stability and higher change variability at older ages and longer T1-T2 intervals. Schaie (2005) and Zimprich and Marcherek (2010) also reported lower stability coefficients for memory ability than for other cognitive abilities, and therefore episodic memory may be a special case in which individual differences in change are more pronounced than with other abilities, particularly among older adults. The greater variability and lower stability for memory may reflect the presence of some individuals with pre-clinical dementia in the older sample as memory decline is recognized as one of the earliest symptoms of dementia. Unfortunately, this possibility could not be examined in the current study because no measure of current or subsequent dementia status was available.
The regression analyses revealed little evidence that the stability coefficients varied as a function of the length of the T1-T2 interval. The absence of an interval effect in the current study could be attributable to restricted range, because although the intervals ranged from .2 to 9.2 years, the median was only 2.2, and 90% of the intervals were less than 4 years. However, the stability coefficient of .98 for the reasoning/fluid ability construct in this study was similar to the coefficients for a similar construct of .98 reported by Raz, et al. (2008) over a 5-year interval, and .94 reported by Zimprich and Marcherek (2010) over a 12-year interval, and therefore high stability may persist over much longer time periods than those examined here for some cognitive abilities.
In summary, previous studies have revealed similar levels of between-person variability in cognitive functioning at different ages, and the current analyses not only confirmed this finding, but in addition revealed that the variability in short-term longitudinal change was also similar across most of adulthood. It is an open question whether longitudinal analyses of brain structure or various biomarkers of aging would reveal similar magnitudes of change variability and T1-T2 correlations across the adult years. At least for measures of cognitive functioning in this sample of healthy adults, however, the results reported here indicate that systematic relations of age on longitudinal change can occur without larger individual differences in rates of aging at older ages.
Acknowledgements
Supported by Grant R37AG024270 from the National Institute on Aging.
Institutional Review Board approval: The research described in this report was conducted with approval of the Institutional Review Board at The University of Virginia.
Footnotes
Conflict of interest statement The author has no financial or other conflicts related to this research.
Publisher's Disclaimer: This is a PDF file of an unedited manuscript that has been accepted for publication. As a service to our customers we are providing this early version of the manuscript. The manuscript will undergo copyediting, typesetting, and review of the resulting proof before it is published in its final citable form. Please note that during the production process errors may be discovered which could affect the content, and all legal disclaimers that apply to the journal pertain.
References
- Abe O, Yamasue H, Aoki S, Suga M, Yamada H, Kasai K, Masutani Y, Kato N, Kato N, Ohtomo K. Aging in the CNS: Comparison of gray/white matter volume and diffusion tensor data. Neurobiology of Aging. 2008;29:102–116. doi: 10.1016/j.neurobiolaging.2006.09.003. [DOI] [PubMed] [Google Scholar]
- Alder AG, Adam J, Arenberg D. Individual-differences assessment of the relationship between change in and initial level of adult cognitive functioning. Psychology and Aging. 1990;5:560–568. doi: 10.1037//0882-7974.5.4.560. [DOI] [PubMed] [Google Scholar]
- Allen JS, Bruss J, Brown CK, Damasio H. Normal neuroanatomical variation due to age: The major lobes and a parcellation of the temporal region. Neurobiology of Aging. 2005;26:1245–1260. doi: 10.1016/j.neurobiolaging.2005.05.023. [DOI] [PubMed] [Google Scholar]
- Bennett GK, Seashore HG, Wesman AG. Differential Aptitude Test. Psychological Corporation; San Antonio, TX: 1997. [Google Scholar]
- Charlton RA, Barrick TR, McIntyre DJ, Shen Y, O’Sullivan M, Howe FA, Clark CA, Morris RG, Markus HS. White matter damage on diffusion tensor imaging correlates with age-related cognitive decline. Neurology. 2006;66:217–222. doi: 10.1212/01.wnl.0000194256.15247.83. [DOI] [PubMed] [Google Scholar]
- DeCarli C, Massaro J, Harvey D, Hald J, Tullberg M, Au R, Beiser A, D’Agostino R, Wolf PA. Measures of brain morphology and infarction in the Framingham heart study: Establishing what is normal. Neurobiology of Aging. 2005;26:491–510. doi: 10.1016/j.neurobiolaging.2004.05.004. [DOI] [PubMed] [Google Scholar]
- Ecker C, Stahl D, Daly E, Johnston P, Thomson A, Murphy DGM. Is there a common underlying mechanism for age-related decline in cortical thickness? NeuroReport. 2009;20:1155–1160. doi: 10.1097/WNR.0b013e32832ec181. [DOI] [PubMed] [Google Scholar]
- Ekstrom RB, French JW, Harman HH, Dermen D. Manual for Kit of Factor-Referenced Cognitive Tests. Educational Testing Service; Princeton, NJ: 1976. [Google Scholar]
- Ferrer E, McArdle JJ. Longitudinal modeling of developmental changes in psychological research. Current Directions in Psychological Science. 2010;19:149–154. [Google Scholar]
- Fjell AM, Westlye LT, Amlien I, Espeseth T, Reinvang I, Raz N, Agartz I, Salat DH, Greve DN, Fischl B, Dale AM, Walhovd KB. High consistency of regional cortical thinning in aging across multiple samples. Cerebral Cortex. 2009;19:2001–2012. doi: 10.1093/cercor/bhn232. [DOI] [PMC free article] [PubMed] [Google Scholar]
- Fotenos AF, Mintun MA, Snyder AZ, Morris JC, Buckner RL. Brain volume decline in aging: Evidence for a relation between socioeconomic status, preclinical Alzheimer Disease and reserve. Archives of Neurology. 2008;65:113–120. doi: 10.1001/archneurol.2007.27. [DOI] [PubMed] [Google Scholar]
- Fotenos AF, Snyder AZ, Girton LE, Morris JC, Buckner RL. Normative estimates of cross-sectional and longitudinal brain volume decline in aging and AD. Neurology. 2005;64:1032–1039. doi: 10.1212/01.WNL.0000154530.72969.11. [DOI] [PubMed] [Google Scholar]
- Giambra LM, Arenberg D, Kawas C, Zonderman AB. Adult life span changes in immediate visual memory and verbal intelligence. Psychology and Aging. 1995;10:123–139. doi: 10.1037//0882-7974.10.1.123. [DOI] [PubMed] [Google Scholar]
- Good CD, Johnsrude IS, Ashburner J, Henson RNA, Friston KJ, Frackowiak RSJ. A voxel-based morphometric study of ageing in 465 normal adult brains. NeuroImage. 2001;14:21–36. doi: 10.1006/nimg.2001.0786. [DOI] [PubMed] [Google Scholar]
- Grieve SM, Williams LM, Paul RH, Clark CR, Gordon E. Cognitive aging, executive function, and fractional anisotropy: A diffusion tensor MR imaging study. American Journal of Neuroradiology. 2007;28:226–235. [PMC free article] [PubMed] [Google Scholar]
- Hertzog C, Schaie KW. Stability and change in adult intelligence: 1. Analysis of longitudinal covariance structures. Psychology and Aging. 1986;1:159–171. doi: 10.1037//0882-7974.1.2.159. [DOI] [PubMed] [Google Scholar]
- Hsu J-L, Leemans A, Bai C-H, Lee C-H, Tsai Y-F, Chiu H-C, Chen W-H. Gender differences and age-related white matter changes of the human brain: A diffusion tensor imaging study. NeuroImage. 2008;39:566–577. doi: 10.1016/j.neuroimage.2007.09.017. [DOI] [PubMed] [Google Scholar]
- Johnson W, Logie RH, Brockmole JR. Working memory tasks differ in factor structure across age cohorts: Implications for dedifferentiation. Intelligence. 2010;38:513–528. [Google Scholar]
- Kennedy KM, Erickson KI, Rodrigue KM, Voss MW, Colcombe SJ, Kramer AF, Acker JD, Raz N. Age-related differences in regional brain volumes: A comparison of optimized voxel-based morphometry to manual volumetry. Neurobiology of Aging. 2009;30:1657–1676. doi: 10.1016/j.neurobiolaging.2007.12.020. [DOI] [PMC free article] [PubMed] [Google Scholar]
- Kruggel F. MRI-based volumetry of head compartments: Normative values of healthy adults. NeuroImage. 2006;30:1–11. doi: 10.1016/j.neuroimage.2005.09.063. [DOI] [PubMed] [Google Scholar]
- Lemaitre H, Goldman AL, Sambataro F, Verchinski BA, Meyer-Lindenberg A, Weinberger DR, Mattay VS. Normal age-related brain morphometric changes: nonuniformity across cortical thickness, surface area and gray matter volume? Neurobiology of Aging. doi: 10.1016/j.neurobiolaging.2010.07.013. (in press) [DOI] [PMC free article] [PubMed] [Google Scholar]
- Michielse S, Coupland N, Camicioli R, Carter R, Seres P, Sabino J, Malykhin N. Selective effects of aging on brain white matter microstructure: A diffusion tensor imaging tractography study. NeuroImage. 2010;52:1190–1201. doi: 10.1016/j.neuroimage.2010.05.019. [DOI] [PubMed] [Google Scholar]
- Raven J. Advanced Progressive Matrices, Set II. H. K. Lewis; London: 1962. [Google Scholar]
- Raz N, Lindenberger U, Ghisletta P, Rodrigue KM, Kennedy KM, Acker JD. Neuroanatomical correlates of fluid intelligence in healthy adults and persons with vascular risk factors. Cerebral Cortex. 2008;18:718–726. doi: 10.1093/cercor/bhm108. [DOI] [PMC free article] [PubMed] [Google Scholar]
- Ronnlund M, Nilsson L-G. Adult life-span patterns in WAIS-R Block Design performance: Cross-sectional versus longitudinal age gradients and relations to demographic factors. Intelligence. 2006;34:63–78. [Google Scholar]
- Ronnlund M, Nyberg L, Backman L, Nilsson L-G. Stability, growth, and decline in adult life span development of declarative memory: Cross-sectional and longitudinal data from a population-based study. Psychology and Aging. 2005;20:3–18. doi: 10.1037/0882-7974.20.1.3. [DOI] [PubMed] [Google Scholar]
- Rovaris M, Iannucci G, Cercignani M, Sormani MP, de Stefano N, Gerevini S, Coml G, Fillippi M. Age-related changes in conventional, magnetization transfer, and diffusion-tensor MR imaging findings: Study with whole-brain tissue histogram analysis. Radiology. 2003;227:731–738. doi: 10.1148/radiol.2273020721. [DOI] [PubMed] [Google Scholar]
- Rushton JP, Brainerd CJ, Pressley M. Behavioral development and construct validity: The principle of aggregation. Psychological Bulletin. 1983;94:18–38. [Google Scholar]
- Salat DH, Buckner RL, Snyder AZ, Greve DN, Desikan RSR, Busa E, Morris JC, Dale AM, Fischl B. Thinning of the cerebral cortex in aging. Cerebral Cortex. 2004;14:721–730. doi: 10.1093/cercor/bhh032. [DOI] [PubMed] [Google Scholar]
- Salat DH, Greve DN, Pacheco JL, Quinn BT, Helmer KG, Buckner RL, Fischl BG. Regional white matter volume differences in nondemented aging and Alzheimer’s disease. NeuroImage. 2009;44:1247–1258. doi: 10.1016/j.neuroimage.2008.10.030. [DOI] [PMC free article] [PubMed] [Google Scholar]
- Salat DH, Tuch DS, Greve DN, van der Kouwe AJW, Hevelone ND, Zaleta AK, Rosen BR, Fischl B, Corkin S, Rosas HD, Dale AM. Age-related alterations in white matter microstructure measured by diffusion tensor imaging. Neurobiology of Aging. 2005;26:1215–1227. doi: 10.1016/j.neurobiolaging.2004.09.017. [DOI] [PubMed] [Google Scholar]
- Salthouse TA. Speed and knowledge as determinants of adult age differences in verbal tasks. Journal of Gerontology: Psychological Sciences. 1993;48:P29–P36. doi: 10.1093/geronj/48.1.p29. [DOI] [PubMed] [Google Scholar]
- Salthouse TA. Localizing age-related individual differences in a hierarchical structure. Intelligence. 2004;32:541–561. doi: 10.1016/j.intell.2004.07.003. [DOI] [PMC free article] [PubMed] [Google Scholar]
- Salthouse TA. Relations between cognitive abilities and measures of executive functioning. Neuropsychology. 2005;19:532–545. doi: 10.1037/0894-4105.19.4.532. [DOI] [PubMed] [Google Scholar]
- Salthouse TA. Major Issues in Cognitive Aging. Oxford University Press; New York: 2010a. [Google Scholar]
- Salthouse TA. Influence of age on practice effects in longitudinal neurocognitive change. Neuropsychology. 2010b;24:563–572. doi: 10.1037/a0019026. [DOI] [PMC free article] [PubMed] [Google Scholar]
- Salthouse TA. Neuroanatomical substrates of age-related cognitive decline. Psychological Bulletin. 2011a;137:753–784. doi: 10.1037/a0023262. [DOI] [PMC free article] [PubMed] [Google Scholar]
- Salthouse TA. Effects of age on time-dependent change. Psychological Science. 2011b;22:682–688. doi: 10.1177/0956797611404900. [DOI] [PMC free article] [PubMed] [Google Scholar]
- Salthouse TA, Babcock RL. Decomposing adult age differences in working memory. Developmental Psychology. 1991;27:763–776. [Google Scholar]
- Salthouse TA, Ferrer-Caja E. What needs to be explained to account for age-related effects on multiple cognitive variables? Psychology and Aging. 2003;18:91–110. doi: 10.1037/0882-7974.18.1.91. [DOI] [PubMed] [Google Scholar]
- Salthouse TA, Fristoe N, Rhee SH. How localized are age-related effects on neuropsychological measures? Neuropsychology. 1996;10:272–285. [Google Scholar]
- Salthouse TA, Pink JE, Tucker-Drob EM. Contextual analysis of fluid intelligence. Intelligence. 2008;36:464–486. doi: 10.1016/j.intell.2007.10.003. [DOI] [PMC free article] [PubMed] [Google Scholar]
- Salthouse TA, Tucker-Drob EM. Implications of short-term retest effects for the interpretation of longitudinal change. Neuropsychology. 2008;22:800–811. doi: 10.1037/a0013091. [DOI] [PMC free article] [PubMed] [Google Scholar]
- Schaie KW. Developmental influences on adult intelligence: The Seattle Longitudinal Study. Oxford University Press; New York: 2005. [Google Scholar]
- Stadlbauer A, Salomonowitz E, Strunk G, Hammen T, Ganslandt O. Age-related degradation in the central nervous system: Assessment with diffusion-tensor imaging and quantitative fiber tracking. Radiology. 2008;247:179–188. doi: 10.1148/radiol.2471070707. [DOI] [PubMed] [Google Scholar]
- Sullivan EV, Pfefferbaum A. Diffusion tensor imaging and aging. Neuroscience and Biobehavioral Reviews. 2006;30:749–761. doi: 10.1016/j.neubiorev.2006.06.002. [DOI] [PubMed] [Google Scholar]
- Sowell ER, Peterson BS, Thompson PM, Welcome SE, Henkenius AL, Toga AW. Mapping cortical change across the human life span. Nature Neuroscience. 2003;6:309–315. doi: 10.1038/nn1008. [DOI] [PubMed] [Google Scholar]
- Terribilli D, Schaufelberger MS, Duran FLS, Zanetti MV, Curiati PK, Menezes PR, Scazufca M, Amaro E, Leite CC, Busatto GF. Age-related gray matter volume changes in the brain during non-elderly adulthood. Neurobiology of Aging. 2011;32:354–368. doi: 10.1016/j.neurobiolaging.2009.02.008. [DOI] [PMC free article] [PubMed] [Google Scholar]
- Voineskos AN, Rajji TK, Lobaugh NJ, Miranda D, Shenton ME, Kennedy JL, Pollock BG, Mulsant BH. Age-related decline in white matter tract integrity and cognitive performance: A DTI tractography and structural equation modeling study. Neurobiology of Aging. doi: 10.1016/j.neurobiolaging.2010.02.009. (in press) [DOI] [PMC free article] [PubMed] [Google Scholar]
- Walhovd KB, Westlye LT, Amlien I, Espeseth T, Reinvang I, Raz N, Agartz I, Salat DH, Greve DN, Fischl B, Dale AM, Fjell AM. Consistent neuroanatomical age-related volume differences across multiple samples. Neurobiology of Aging. doi: 10.1016/j.neurobiolaging.2009.05.013. (in press) [DOI] [PMC free article] [PubMed] [Google Scholar]
- Wechsler D. Wechsler Adult Intelligence Scale—Third Edition. The Psychological Corporation; San Antonio, TX: 1997a. [Google Scholar]
- Wechsler D. Wechsler Memory Scale—Third Edition. The Psychological Corporation; San Antonio, TX: 1997b. [Google Scholar]
- Westlye LT, Walhovd KB, Dale AM, Bjornerud A, Due-Tonnessen P, Engvig A, Grydeland H, Tamnes CK, Ostby Y, Fjell AM. Life-span changes of the human brain white matter: Diffusion tensor imaging (DTI) and volumetry. Cerebral Cortex. 2010;20:2055–2068. doi: 10.1093/cercor/bhp280. [DOI] [PubMed] [Google Scholar]
- Woodcock RW, Johnson MB. Woodcock–Johnson psycho-educational battery—Revised. DLM; Allen, TX: 1989. [Google Scholar]
- Zachary RA. Shipley Institute of Living Scale—Revised. Western Psychological Services; Los Angeles, CA: 1986. [Google Scholar]
- Zimmerman ME, Brickman AM, Paul RH, Grieve SM, Tate DF, Gunstad J, Cohen RA, Aloia MS, Williams LM, Clark CR, Whitford TJ, Gordon E. The relationship between frontal gray matter volume and cognition varies across the healthy adult lifespan. American Journal of Geriatric Psychiatry. 2006;14:823–833. doi: 10.1097/01.JGP.0000238502.40963.ac. [DOI] [PubMed] [Google Scholar]
- Zimprich D, Mascherek A. Five views of a secret: does cognition change during middle adulthood? European Journal of Ageing. 2010;7:135–146. doi: 10.1007/s10433-010-0161-5. [DOI] [PMC free article] [PubMed] [Google Scholar]