

Abstract
Posttranslational arginylation mediated by arginyltransferase (ATE1) is an emerging major regulator of embryogenesis and cell physiology. Impairments of ATE1 are implicated in congenital heart defects, obesity, cancer, and neurodegeneration making this enzyme an important therapeutic target, whose potential has been virtually unexplored. Here we report the development of a biochemical assay for identification of small molecule inhibitors of ATE1 and application of this assay to screen a library of 3280 compounds. Our screen identified two compounds which specifically affect ATE1-regulated processes in vivo, including tannic acid, which has been previously shown to inhibit protein degradation and angiogenesis and to act as a therapeutic agent in heart disease and cancer. Our data suggest that these actions of tannic acid are mediated by its direct effect on ATE1, which regulates protein degradation and angiogenesis in vivo.
Keywords: ATE1 inhibitors, arginylation, tannic acid, cell motility, angiogenesis
1. Introduction
Posttranslational arginylation is a protein modification of emerging global importance, implicated as a key regulator of embryogenesis and cell physiology. Knockout of arginyltransferase (Ate1) causes embryonic lethality in mice with severe defects in cardiovascular development and angiogenesis [1]. A large number of cytoskeleton proteins are arginylated in vivo[2] and arginylation of β-actin is found to be critical for cell motility and the formation of the cell leading edge [3]. Arginylation has also been shown to regulate actin polymer level and the structure of the intracellular actin network [4], and affect cell adhesion, cell migration speeds, and migration-dependent tissue morphogenesis during development [3]. Thus, arginylation plays major roles in cell migratory processes and exerts at least some of its effects through the modulation of the actin cytoskeleton, however the underlying molecular mechanisms are poorly understood.
ATE1 is a highly functionally conserved enzyme in all eukaryotic species, essential for normal development and functioning of mammalian organisms. Impairments in ATE1 regulation have been implicated in such major diseases as congenital heart defects[1], obesity[5], cancer, and neurodegeneration [6, 7], making this enzyme a potentially critical target for the development of therapeutics that could modulate these disease conditions and prevent their progression in humans. However, since the molecular properties and structure of this enzyme are not well understood, targeted approaches to modulation of ATE1 activity and functions in vitro and in vivo have never been undertaken before.
Several natural and artificial compounds that influence ATE1 activity in various systems have been identified through the past studies of ATE1-regulated processes, however none of these compounds have high specificity for ATE1 enzyme and most of them have none, or very limited activity in cells. Tri-peptide Glu-Val-Phe can inhibit arginylation by acting as a substrate mimic that saturates ATE1, making it unavailable for arginyl transfer to its natural targets [8], however this peptide acts only at high concentrations and is not very effective in biological assays [8, 9]. Bifunctional phenylarsenoxide was shown to inhibit ATE1 through interaction with reactive Cys residues in the critical positions within the molecule [10], however this inhibitor is not only toxic but relatively non-specific, since it exerts its effect similarly on all proteins whose activity is dependent on reactive Cys groups. Heparin, a widely used anticoagulant, inhibits ATE1 reaction in vitro [11], possibly through its action on Arg-tRNA synthetase (RRS) which produces Arg-charged tRNA used for arginyl transfer [12]. Similarly protease inhibitors indirectly inhibit protein arginylation in brain extracts by interfering with the charging of tRNA [13]. Finally, hemin, the Fe3+ form of heme, was shown to inhibit ATE1 and promote its degradation in cells through ubiquitin-dependent proteolysis – an indirect effect, likely linked to hemin's action on proteasome, and possibly on RRS [14]. Thus, no natural or artificial compounds are known to date which could specifically modulate ATE1 activity and/or its intracellular functions.
Here we report the development of a chemical assay for identification of small molecule inhibitors of ATE1 and application of this assay to screening of a small molecule library of 3280 known chemicals. Our screen identified four molecules that can specifically inhibit the activity of ATE1, including two compounds which specifically affect ATE1-regulated processes in cells. One of these compounds – tannic acid – has been previously shown to inhibit protein degradation and angiogenesis in cell and mouse models and to act as a therapeutic agent in prevention and treatment of heart disease and cancer. Our data suggest that these actions of tannic acid are mediated by its direct effect on ATE1, which regulates protein degradation and angiogenesis in vivo.
2. Material and methods
2.1. Antibody generation and purification
N-terminally arginylated β actin peptide `RDDIAALC' was used to raise polyclonal anti-R-β antibody in rabbits. Immunizations and collection of antisera were performed by Sigma Genosys (http://www.sigmaaldrich.com/Brands/Sigma_Genosys.html). Crude antisera was first affinity purified using the immunization peptide immobilized on Aminolink resin (Pierce), and then further purified by immunodepletion with Aminolink-coupled non-arginylated peptide, in which the N-terminal R was replaced with acetylated Asp (ac-D) -- `Ac-DDDIAALC' – a sequence corresponding to the nonarginylated β actin N-terminus in vivo.
2.2 ATE1 assay in microplates and small molecule screen
384-well high binding white plates (Corning) were coated with 1 μg of `DDIAALVVDNGSGMCK' peptide per well by incubating in 25 μl 23 μM peptide solution in carbonate/bicarbonate buffer (28.6 mM Na2CO3/71.4mM NaHCO3, pH 9.6) at 25°C for 90 min. After coating, plates were blocked with 5% milk in PBS at 37°C for 1 hr followed by three washes with PBS at room temperature.
For ATE1 assay, 25 μl reaction mix (50 mM HEPES pH 7.5, 25 mM KCl, 15 mM MgCl2, 0.1 mM DTT, 6 mM ATP, 100nM tRNAArg, 0.5 mM Arginine, 66 nM RRS, and 250 nM ATE1) was added to each well and incubated for 30 min at 37°C. After the completion of the reaction, plates were washed three times with PBS containing 0.05% Tween 20 (PBST). For detection of arginylated products and measuring the reaction efficiency and ATE1 inhibition, plates were incubated first with anti-R-β antibody (1 hr, room temperature), washed three times with PBST, and incubated with HRP-conjugated anti rabbit IgG (1 hr, room temperature). After the final incubation plates were washed again 3× with PBST, 25 μl of chemiluminescence substrate (Thermo SuperSignal ELISA Femto, Thermo Fisher) was added to each well and readings were collected between 5 and 15 min of substrate addition. Readings were performed by the Envision 2103 Multilabel Reader (Perkin Elmer) equipped with Enhanced Luminescence sensor. For the control experiments shown in Figure 2B, individual components of the assay were omitted and/or 1% of DMSO was added to the wells, as indicated.
Figure 2. Summary of the small molecule library screen to identify ATE1 inhibitors.

A. Schematic representation of the ELISA-based ATE1 activity assay. Screening of the small molecule library was done in two steps. In the first round (SCREEN 1) a coupled reaction was employed, using a mixture of Arg-tRNA synthetase (RRS), Arg, tRNA, and ATE1. In the counterscreen (SCREEN 2), pre-synthesized purified Arg-tRNA was used in the reaction. B. An example of the ELISA readings in the presence and absence of key reaction components to evaluate the specificity of the assay. C. Summary of the screen results. D. Representative readings from two inhibitory reactions with the molecules that inhibited ATE1 in both the primary screen and the counterscreen (tannic acid and suramin, left) and two that inhibited the reaction only in the primary screen but were not validated in the counterscreen (aurothioglucose and disulfiram, right).
Small molecule screen was performed using this assay system with the following modifications. For the initial screen (SCREEN1), the ATE1 reaction mix was prepared in two parts: (1) a mixture of all the components listed above except arginine, and (2) a separate solution of Arg. Part 1 was added first, followed by the addition of the drug (dissolved in DMSO) delivered by JANUS automated liquid handling system (Perkin Elmer) equipped with 384-well pin tool (V&P Scientific, Inc.), at an approximate volume of 30 nl/well. Final concentration of drugs and DMSO in the assay was 14 μM and 0.14% respectively. Arg was added afterwards to start the reaction. In the repeated screen, 8.3 μM of the drugs was used and the compounds that did not inhibit ATE1 reaction at this reduced concentration were discarded as the likely non-specific inhibitors. For the counterscreen (SCREEN 2), the RRS reaction was performed separately by mixing all the components from the ATE1 reaction mix (see above) except ATE1, followed by EtOH precipitation to isolate charged Arg-tRNA as described in [15]. The counterscreen was performed by adding ATE1 to the wells, followed by the addition of the drug, and finally the addition of 3 μM purified Arg-tRNA to start the reaction. The molecules which showed 94% or higher inhibitory activity compared to the positive control were selected for further analysis.
2.3. Cell culture, transfection and drug treatment
Immortalized wild-type (WT) and Ate1 KO mouse embryonic fibroblasts [1, 3] were grown in DMEM/F10 medium with 10% serum. For RGS4 degradation assays, cells at 60% confluency were transfected with RGS4-His-V5 construct[16] using Lipofectamine reagent (Invitrogen). After 18 hr of transfection, cells were split and seeded at 1.25 × 10⁵ cells into individual wells of 24-well plates, and grown for additional 24 hrs, with or without the addition of the drug (added to the media at the concentrations indicated in Figure 4B). The entire well contents was then collected for each data point, by resuspending cells directly in 2× SDS loading buffer, and analyzed by Western blots using anti V5 antibody as described in[16]. For wound healing assays, 0.3×10⁶ cells were seeded in 35 mm glass bottom dishes (MatTek Corporation) to make confluent monolayers. After 16–18 hrs, drugs were added to the experimental cultures as indicated in Figure 5 and control and drug-treated cells were incubated for additional 24 hrs, followed by scratch wounding and 2 hr recovery before performing live imaging or fixing for fluorescence staining. Cell migration speed was measured by time lapse imaging of cell movement into the wound area over 8 hrs, acquired at the rate of 1 frame per 10 min; distance between the wound edge at the start and end of the movie was divided by the overall acquisition time to obtain the μm/hr values shown in Figure 5B, D.
Figure 4. Identified ATE1 inhibitors can inhibit ATE1-mediated degradation of RGS4 in cells.
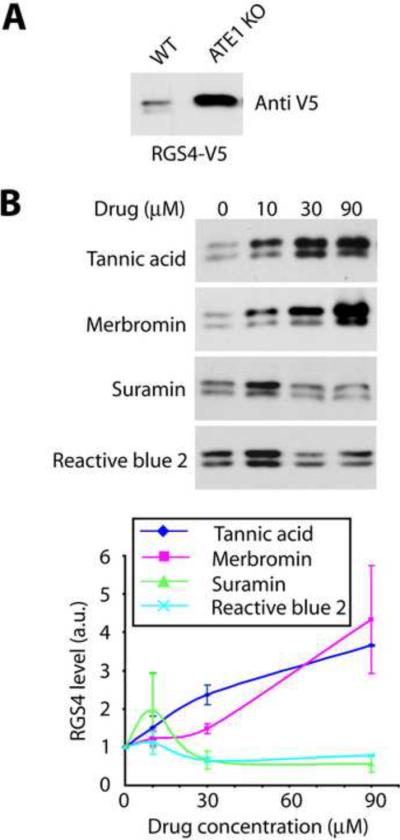
A. Western blots of the extracts of wild type (WT) and Ate1 knockout mouse embryonic fibroblasts transfected with RGS4-V5 fusion construct, probed with anti-V5 antibodies to detect the RGS4 levels. Ate1 deletion results in a dramatic increase in RGS4 due to inhibition of ATE1-mediated degradation. B. Dose-dependent inhibition of RGS4 degradation after 24 h of treatment of RGS4-transfected WT fibroblasts by increasing doses of the inhibitors. Top, Western blot images; bottom, Western blots quantifications. (n=2+/−SEM).
Figure 5. ATE1 inhibitors affect lamella formation and cell motility.

A. Images of scarce cultures of wild type mouse embryonic fibroblasts visualized by phase contrast (left) and alexa 488-phalloidin staining to detect actin polymer (middle and right), in the absence (top) and presence (bottom) of 10 μM merbromin. Rightmost panel shows the magnified image of the regions boxed in the middle images, with the dotted line outlining the position of the cell leading edge detected by phase contrast. Merbromin treatment dramatically inhibits actin polymerization at the cell leading edge. B. Cell migration speeds of wild type mouse embryonic fibroblasts in presence and absence of 30μM merbromin in wound healing assays (n=4+/−SEM, two-tailed t-test p=0.057). C. Images of alexa 488-phalloidin stained cells in scarce cultures (left) and at the wound edge (right) of wild type mouse embryonic fibroblasts in the absence and presence of 30 μM tannic acid. Tannic acid treatment inhibits the lamella formation at the cell leading edge. D. Cell migration speeds of wild type mouse embryonic fibroblasts in presence and absence of 30 μM tannic acid in wound healing assays (n=3+/− SEM, two-tailed t-test p=0.008). Scale bar, 25 μm.
2.4. Immunofluorescence
Confluent or scarce cells after 24 hr of drug treatment were fixed by addition of 4% paraformaldehyde in PBS for 30 min at room temperature, followed by permeabilization by 0.2% Triton X100 in PBS containing 0.2% BSA for 10 min and were blocking with 1% BSA/0.02% Triton X100 in PBS 30min. Actin filaments were visualized by staining with alexa488-labeled phalloidin.
2.5. Angiogenesis assay
Angiogenesis assay was performed as described [17]. Briefly, 1ml of collagen/media solution was prepared on ice by adding 340μl of type I rat tail collagen (BD Biosciences), 76μl 10× M199 (Invitrogen), 136μl serum free DMEM, 100μl FBS, and 340μl of phosphate buffered saline (PBS). The pH was adjusted to 7.2 with NaOH. 1 × 10⁶/ml human umbilical vein endothelial cells (HUVECs) were added to make up the final collagen concentration of 1.25mg/ml. 30μl of collagen/cell mixture was spotted on to a 5-mm woven nylon mesh ring (Tetko Inc.), which provided structural support. Collagen was allowed to polymerize for 60 min at 37°C in a humidified 5% CO2 incubator, and each ring was then transferred into an individual well of a 96-well culture plate pre-filled with media that consisted of EBM-2 supplemented with all “bullet kit” components except FBS, VEGF and bFGF, followed by subsequent addition of 1% FBS and 30ng/ml VEGF-A165 (Peprotech) to induce angiogenic cell outgrowth. Collagen-embedded cells were incubated for 5 days in the absence or presence of merbromin and tannic acid at varied concentrations (2, 10, and 30 μM for tannic acid and 10, 30, and 90 μM for merbromin; data from 10 μM concentrations is shown in Figure 6), fixed in 4% formaldehyde, and stained with 10μg/ml TRITC labeled-lectin (Ulex europaeus UEA-I) (Sigma). Samples were mounted in AquaMount (Lerner Labs) and analyzed by confocal microscopy.
Figure 6. Tannic acid inhibits angiogenesis.

Human Umbilical Vein Endothelial Cells (HUVEC) stained with TRITC labeled-lectin in an angiogenesis assay in absence or presence of the drugs.
2.6. Statistical analysis
In all the experiments where quantitative measurements were made, the variability in data point values were measured and represented as SEM. Student's t test was used to calculate p values. Curves of the log value of drug concentration vs % inhibition were fitted as Sigmoidal dose-response (variable slope) equation using Graph Pad software to generate the IC50 values.
2.7. Materials
3280 compounds in two libraries of biologically active compounds, LOPAC1280 by Sigma-Aldrich (1280 compounds) and Spectrum Collection by MicroSource Discovery Systems, Inc. (2000 compounds) were used for the screen. The specific drugs were procured from the following suppliers: Tannic acid (Sigma, Cat# 403040), Merbromin (Sigma, Cat# M7011), Suramin (EMD Chemicals, Cat# 574625), and Reactive blue 2 (International Laboratory USA, Cat# 1213709).
3. Results
3.1. Development of a high throughput ATE1 activity screen
In vitro arginylation reaction requires only a limited number of purified components essential for Arg transfer from tRNA onto a test substrate [15]. Mixing bacterially expressed purified ATE1 with Arg, tRNA, ATP, Arg-tRNA synthethase (RRS), test substrate (BSA), and buffer components, enables direct observation of the addition of Arg to proteins by incorporation of radioactive label (from labeled Arg) into BSA. However, the radioactivity detection step, and the relative inefficiency of BSA as an Arg acceptor, preclude such a reaction from being used in high throughput screening. To develop a high throughput screen for ATE1 activity, we utilized a similar principle, eliminating the radioactivity detection step and replacing the test substrate with a peptide derived from another known arginylated protein – β-actin. In the final assay, β -actin N-terminal peptide immobilized in wells of the screening plates was used as the test substrate of the reaction.
To replace the radioactive detection with a more standard and user-friendly ELISA-based output, we raised a rabbit polyclonal antibody to the arginylated β -actin N-terminal peptide (anti R-β), using our previously developed strategy of raising antibodies to N-terminally arginylated peptides[2] (see Figure 1A for the antibody design). The resulting anti-R-β antibody was highly specific to the arginylated actin peptide, could reliably distinguish between arginylated and non-arginylated actin-GFP fusion proteins in cell extracts by Western blots (R-β vs. M-β, respectively, in Figure 1B) and specifically detect the N-terminal β-actin peptide after, but not before enzymatic arginylation in vitro (Figure 1C).
Figure 1. Characterization of the antibody against arginylated β-actin N-terminal peptide (Anti Rβ).

A. Peptide sequences used for immunization and purification of the antibody (Ac- denotes the N-terminal acetyl group found on the native β-actin in vivo). B. Western blot of the extracts of HEK 293 cells transfected with an empty vector (C) and the GFP fusion constructs encoding non-arginylated (M-β) and arginylated (R-β) actin, probed with anti R-β and anti GFP antibodies. C. Dot-blots using anti R-β against actin N-terminal peptide (with the sequence written on top), incubated in the absence or in the presence of ATE1 to induce enzymatic arginylation.
For the final assay used in the high throughput screens, we immobilized β-actin N-terminal peptide in the wells of the screening plates, subjected it to arginylation by addition of soluble ATE1 reaction mix described above, and then treated with anti-R-β antibody, followed by a secondary antibody detection by ELISA in a luminescence plate reader (Figure 2A) (Table S1). The assay was highly sensitive, with the signal/background ratios of 10 fold or higher (Figure 2B). The assay output was not affected by 1% of DMSO (Figure 2B) and thus was suitable for high throughput screening of small molecule libraries.
3.2. Identification of small molecule inhibitors of ATE1
To identify ATE1 inhibitors, we used the assay described above to screen two libraries containing a total of 3280 biologically active small molecules: LOPAC (Sigma) and Spectrum (MSD Scientific, Inc.) (Table S1). In the initial screen, (SCREEN 1, Figure 2A) the reaction mix in addition to ATE1 also contained RRS, Arg, and tRNA, so that the arginyl transfer reaction was coupled to RRS-mediated synthesis of charged tRNA. This screen yielded the initial list of 60 positives, selected by their ability to inhibit the ATE1 reaction by 94% or higher. 33 of these compounds performed similarly in a repeated screen, using lower concentrations of the inhibitors. These compounds were further validated using a counterscreen (SCREEN 2, Figure 2A), in which Arg was pre-charged to tRNA and purified away from the RRS enzyme, leaving ATE1 the only enzyme in the mixture. In this counterscreen, only 4 molecules showed specific activity toward ATE1 (Figure 2C, 2D), suggesting that the other molecules likely inhibited the RRS-mediated Arg-tRNA synthesis rather than the subsequent Arg transfer (see Figure 2D for an example of molecules which inhibited arginylation in both screens (left) or only in SCREEN 1 but not in SCREEN2 (right)).
The final four molecules showing ATE1-specific activity in the screen included tannic acid, merbromin, suramin, and reactive blue 2 (Figure 3A). Further tests showed that the IC50 for all four inhibitors in presence of 0.25 μM ATE1 were in the nanomolar to low micromolar range (Figure 3B), and that at these concentrations the identified compounds did not inhibit the RRS-mediated synthesis of Arg-tRNA (Figure S3). These four molecules were used in the subsequent analysis.
Figure 3. ATE1 inhibitors identified in the screen can inhibit purified ATE1.

A. Chemical structure of the identified ATE1 inhibitors. B. Dose-dependent inhibition of 0.25 μM ATE1 by each of the compounds. The inset panel shows the estimated IC50 for each drug. (n=3+/−SEM).
3.3. Small molecule inhibitors of ATE1 inhibit ATE1-mediated protein degradation
Among its many biological effects, ATE1 has been shown to play a role in facilitating protein recognition by the ubiquitin conjugation machinery and ubiquitin-dependent protein degradation [18] [19]. One of the mammalian substrates of such ATE1-mediated degradation is the regulator of G-protein signaling, RGS4 [20] [21]. This protein is rapidly degraded in cells in the presence of ATE1 and becomes metabolically stable in Ate1 knockout cells, resulting in higher levels of its intracellular accumulation [21] [16] (Figure 4A). To test whether any of the identified ATE1 inhibitors can modulate its intracellular effects on RGS4 protein stability, we treated RGS4-transfected cells with increasing amounts of each inhibitor for 24 hrs and tested the RGS4 fusion protein levels in cell extracts after these treatments. Strikingly, while neither of the four identified inhibitors affected cell viability (except merbromin which induced some toxicity at 90 μM), all four compounds were able to at least partially inhibit RGS4 degradation at 10 μM, and tannic acid and merbromin showed a truly dose-dependent inhibition, significantly protecting RGS4 from degradation at increasing concentrations (Figure 4B). Suramin and reactive blue 2 had no apparent effect at higher concentrations (Figure 4B), suggesting that these two inhibitors cannot be used as potent modulators of ATE1 activity in cells. For this reason, only tannic acid and merbromin were used during further analysis.
3.4. ATE1 inhibitors affect actin cytoskeleton, cell leading edge, and cell motility
Since lack of arginylation has been previously shown to affect the structure and activity of the cell leading edge [3, 4] and the speed of directional cell migration in culture [22], we tested the effect of the Ate1 inhibitors on actin cytoskeleton and cell motility of cultured mouse embryonic fibroblasts. Strikingly, both merbromin and tannic acid indeed affected cell lamella and migration speeds, however these two inhibitors exerted different effects on cell morphology and actin cytoskeleton, both implicated in ATE1-dependent responses. Addition of 10 μM merbromin for 24 hrs caused severe depletion of the cortical actin cytoskeleton, resulting in the formation of lamellipodia apparently devoid of the actin filaments (Figure 5A). This effect was reminiscent of one of the phenotypes in Ate1 knockout fibroblasts, which have severely lowered actin polymer levels and severely reduced actin network at the cell leading edge [4]. In contrast, addition of tannic acid did not appear to affect actin polymer levels, but resulted in severe inhibition of the lamella formation (Figure 5C) – another effect that is prominently seen in Ate1 knockout cells [3, 4].
Tests of directional cell migration using wound healing assays in culture showed significant effects after treatment with both inhibitors. Merbromin addition decreased cell migration speed at the wound edge by ~30% (Figure 5B and Figure S1). Treatment with tannic acid resulted in ~60% decrease in cell migration speed (Figure 5D and Figure S1). In comparison, Ate1 knockout cells in culture move at speeds reduced by 60–75% compared to wild type [22].
Thus, mebromin and tannic acid exert prominent but differential effects on the cell leading edge, actin cytoskeleton, and directional cell motility, that are also observed in Ate1 knockout cells.
3.5. Tannic acid inhibits angiogenesis
One of the most prominent biological roles of ATE1 is its ability to regulate embryonic angiogenesis – a key developmental process of capillary growth and remodeling during mid-gestation. In Ate1 knockout embryos, angiogenesis is severely impaired, resulting in a reduced capillary network, abnormal branching, and premature termination of the outgrowing blood vessels [1]. To test if this ATE1-regulated process can be inhibited by our identified compounds, we performed VEGF-A165 induced angiogenesis assay in culture, using human endothelial cells (HUVECs) grown in 3D collagen gels [17]. In this assay, addition of VEGF induces rapid outgrowth of blood vessel-like structures, resulting in the formation of a 3D network that could be visualized with TRITC-labeled lectin (Figure 6, left). Addition of 10 μM merbromin did not result in any visible reduction of such outgrowth (Figure 6, middle), suggesting that this molecule did not inhibit angiogenesis in our assay. However, addition of tannic acid at varied concentrations, starting with as low as 2 μM, completely inhibited VEGF-induced blood vessel remodeling in culture without affecting cell morphology or viability (Figure 6, right, and Figure S2).
4. Discussion
Our study demonstrates a successful development of a high throughput ATE1 activity assay, which can be used to perform a variety of screens to test ATE1 activation, inhibition, substrate specificity, and function under highly controlled conditions in a time- and cost-effective way. This assay can also be employed on a larger scale to screen small molecule libraries and identify potential therapeutic agents for ATE1-regulated disease processes, including heart failure, birth defects, wound healing, and cancer. This is the first high efficiency biochemical assay that enables the screening of the small molecule inhibitors of ATE1, that can be widely employed because of its ease, high signal/background ratio, and the use of non-hazardous compounds. This assay for the first time enables identification of the therapeutic agents that target ATE1-regulated biological processes and affect heart disease, cancer, neurodegeneration and other disorders through arginylation-dependent mechanisms.
The four inhibitors of ATE1 identified in the current screen belong to very diverse classes of molecules. One commonality observed among the identified molecules is the presence of acidic functional groups in them. However, they appear structurally different, suggesting that they might have very different mechanisms of function. Tannic acid, a polyphenolic compound present in tea, coffee, and red wine, is a potent antioxidant which has been suggested in multiple studies to have significant benefits in preventing and treatment of severe health conditions, including cancer [23] [24]. Merbromin is an organomercuric compound with close similarity to fluorescein and eosin, which is sometimes used as a topical antiseptic[25]. Suramin (polysulfonated napthylurea) and reactive blue 2 (a protein binding dye with high affinity to nucleotide binding sites) are known antagonists of purinoceptors[26]. Of these four compounds, tannic acid, merbromin and suramin have IC50 values close to the concentration of ATE1 in the reaction, suggesting a possible 1:1 stoichiometry of interaction with the enzyme. Reactive blue 2, however, has a significantly higher IC50, suggesting its lower affinity for the enzyme or its preferential interaction with more than one molecule of ATE1 at the same time.
While tannic acid and merbromin could inhibit ATE1-mediated degradation of RGS4 in cells, suramin and reactive blue 2 showed a poor ability to do it in a dose-dependent manner. It is possible that in the case of reactive blue 2 such failure was due to its lower affinity for ATE1 and its sequestering by other known intracellular targets, such as purinoceptors [26, 27]. In the case of suramin, the reasons could be due to its interaction with serum albumin[28] – a regular component of culture media, introduced from the added serum. It has been shown that in the presence of serum albumin, suramin uptake by cells is reduced, and its residual amount tends to accumulate in the lysosomes[28], greatly diminishing its ability to exert biological effects. If these two compounds are to be further considered as inhibitors of arginylation in relevant biological processes, further optimization to modulate their uptake by cells and targeting to the proper intracellular compartments is required. Optimization and/or possible chemical modifications may also be required for the biological use of merbromin -- a mercury-containing compound, barred in the USA for therapeutic use. Thus, out of the four identified compounds, tannic acid appears to be the most prominent – and the most potent -- ATE1 inhibitor.
While both merbromin and tannic acid appear to have the same specificity with purified ATE1 and the same effects on ATE1-mediated degradation of RGS4, our cell-based assays show that these two compounds exert differential effects on cell motility, actin cytoskeleton, and angiogenesis. Interestingly, merbromin treatment dramatically reduces actin leading edge network without apparent effects on the lamella formation, while tannic acid virtually abolishes the lamella without affecting actin polymer level. Since lamella formation and actin polymer network are believed to be closely linked to each other, the use of these compounds to uncouple these two processes may provide important insights into the regulation of cell migration and the role of actin at the cell leading edge. The fact that these two compounds have different intracellular effects while acting on the same enzyme, could be explained by the existence of additional ATE1-independent non-overlapping targets for merbromin and tannic acid in vivo. However given the range of ATE1-specific effects that they can influence and their close correspondence to the in vivo roles of ATE1 itself, a more likely possibility appears to be that both compounds are specific for ATE1 but affect different regions of the ATE1 molecule and thus regulate different but overlapping ATE1-mediated functions. At present there is no sufficient data that could shed light on the sites and molecular interactions mediating the effects of these two compounds, but a future study solving ATE1 structure could provide insights into the role of these compounds in its regulation.
Ate1 knockout in mice heavily affects angiogenesis by inhibiting the formation of new branching vessels and affecting their directionality and overall organization [1]. Like many other developmental processes, angiogenesis depends on cell migration and can be inhibited by treatments that suppress cell motility (reviewed in [29]). Interestingly, RGS4, 5, and 16, whose metabolic stability is regulated by ATE1, are known to inhibit VEGF induced angiogenesis [30] [31] . Moreover, a previous study demonstrates that tannic acid could inhibit tubule formation of bovine aorta endothelial cells induced by the cytokine CXCL12 , but not by ECGS or bFGF [32]. Our study provides a new molecular link between these effects and suggests that both of them are regulated by ATE1 and respond to tannic acid-induced ATE1 inhibition.
In addition to its other effects, tannic acid has been previously shown to inhibit adipogenesis by affecting adipocyte differentiation-related genes[24]. A recent study showed that Ate1 knockout induced in mice after birth causes significant inhibition of white adipose tissue formation resulting from a high fat diet[5]. Thus, it is likely that tannic acid-mediated inhibition of adipogenesis is also happening through its inhibition of ATE1.
Arginylation is an emerging global regulator of developmental and physiological processes including glucose and fat metabolism, angiogenesis, and cardiovascular development, making ATE1 a potential key target of major therapeutic interventions. ATE1 high throughput assay and the inhibitors identified in this study will help in understanding the role of ATE1 in physiological and developmental processes and promote development of ATE1 regulators for future treatment of major developmental, physiological, and metabolic diseases.
Supplementary Material
Acknowledgments
Chemical screening was performed at the Small Molecule Screening Core Facility of the Roswell Park Cancer Institute, Buffalo, NY. This work was supported by NIH grant 5R01HL084419, W.W.Smith Charitable Trust, and Philip Morris Research Management Group awards to A.K
Abbreviations List
- Ate1
arginine transfer enzyme 1 or arginyltransferase 1
- RRS
Arg-tRNA synthethase
- BSA
bovine serum albumin
- RGS4
regulator of G protein signaling 4
- VEGF-A165
vascular endothelial growth factor A165
- HUVEC
Human Umbilical Vein Endothelial Cells
- TRITC
retramethyl rhodamine isothiocyanate
- CXCL12
C-X-C motif ligand 12
- ECGS
endothelial cell growth supplement
- bFGF
basic fibroblast growth factor
Footnotes
Publisher's Disclaimer: This is a PDF file of an unedited manuscript that has been accepted for publication. As a service to our customers we are providing this early version of the manuscript. The manuscript will undergo copyediting, typesetting, and review of the resulting proof before it is published in its final citable form. Please note that during the production process errors may be discovered which could affect the content, and all legal disclaimers that apply to the journal pertain.
References
- [1].Kwon YT, Kashina AS, Davydov IV, Hu RG, An JY, Seo JW, et al. An essential role of N-terminal arginylation in cardiovascular development. Science. 2002;297:96–9. doi: 10.1126/science.1069531. [DOI] [PubMed] [Google Scholar]
- [2].Wong CC, Xu T, Rai R, Bailey AO, Yates JR, 3rd, Wolf YI, et al. Global analysis of posttranslational protein arginylation. PLoS Biol. 2007;5:e258. doi: 10.1371/journal.pbio.0050258. [DOI] [PMC free article] [PubMed] [Google Scholar]
- [3].Karakozova M, Kozak M, Wong CC, Bailey AO, Yates JR, 3rd, Mogilner A, et al. Arginylation of beta-actin regulates actin cytoskeleton and cell motility. Science. 2006;313:192–6. doi: 10.1126/science.1129344. [DOI] [PubMed] [Google Scholar]
- [4].Saha S, Mundia MM, Zhang F, Demers RW, Korobova F, Svitkina T, et al. Arginylation regulates intracellular actin polymer level by modulating actin properties and binding of capping and severing proteins. Mol Biol Cell. 2010;21:1350–61. doi: 10.1091/mbc.E09-09-0829. [DOI] [PMC free article] [PubMed] [Google Scholar]
- [5].Brower CS, Varshavsky A. Ablation of arginylation in the mouse N-end rule pathway: loss of fat, higher metabolic rate, damaged spermatogenesis, and neurological perturbations. PLoS One. 2009;4:e7757. doi: 10.1371/journal.pone.0007757. [DOI] [PMC free article] [PubMed] [Google Scholar]
- [6].Bongiovanni G, Fidelio GD, Barra HS, Hallak ME. The post-translational incorporation of arginine into a beta-amyloid peptide increases the probability of alpha-helix formation. Neuroreport. 1995;7:326–8. [PubMed] [Google Scholar]
- [7].Mutsuddi M, Marshall CM, Benzow KA, Koob MD, Rebay I. The spinocerebellar ataxia 8 noncoding RNA causes neurodegeneration and associates with staufen in Drosophila. Curr Biol. 2004;14:302–8. doi: 10.1016/j.cub.2004.01.034. [DOI] [PubMed] [Google Scholar]
- [8].Ciechanover A, Ferber S, Ganoth D, Elias S, Hershko A, Arfin S. Purification and characterization of arginyl-tRNA-protein transferase from rabbit reticulocytes. Its involvement in post-translational modification and degradation of acidic NH2 termini substrates of the ubiquitin pathway. J Biol Chem. 1988;263:11155–67. [PubMed] [Google Scholar]
- [9].Kopitz J, Rist B, Bohley P. Post-translational arginylation of ornithine decarboxylase from rat hepatocytes. Biochem J. 1990;267:343–8. doi: 10.1042/bj2670343. [DOI] [PMC free article] [PubMed] [Google Scholar]
- [10].Li J, Pickart CM. nactivation of arginyl-tRNA protein transferase by a bifunctional arsenoxide: identification of residues proximal to the arsenoxide site. Biochemistry. 1995;34:39–47. doi: 10.1021/bi00001a017. [DOI] [PubMed] [Google Scholar]
- [11].Kato M. Heparin as an inhibitor of L-arginyl-tRNA: protein arginyltransferase. J Biochem. 1983;94:2015–22. doi: 10.1093/oxfordjournals.jbchem.a134556. [DOI] [PubMed] [Google Scholar]
- [12].Yang F, Xia X, Lei HY, Wang ED. Hemin binds to human cytoplasmic arginyl-tRNA synthetase and inhibits its catalytic activity. J Biol Chem. 2010;285:39437–46. doi: 10.1074/jbc.M110.159913. [DOI] [PMC free article] [PubMed] [Google Scholar]
- [13].Yu M, Chakraborty G, Grabow M, Ingoglia NA. Serine protease inhibitors block N-terminal arginylation of proteins by inhibiting the arginylation of tRNA in rat brains. Neurochem Res. 1994;19:105–10. doi: 10.1007/BF00966736. [DOI] [PubMed] [Google Scholar]
- [14].Hu RG, Wang H, Xia Z, Varshavsky A. The N-end rule pathway is a sensor of heme. Proc Natl Acad Sci U S A. 2008;105:76–81. doi: 10.1073/pnas.0710568105. [DOI] [PMC free article] [PubMed] [Google Scholar]
- [15].Wang J, Han X, Saha S, Xu T, Rai R, Zhang F, et al. Arginyltransferase Is an ATP-Independent Self-Regulating Enzyme that Forms Distinct Functional Complexes In Vivo. Chem Biol. 2011;18:121–30. doi: 10.1016/j.chembiol.2010.10.016. [DOI] [PMC free article] [PubMed] [Google Scholar]
- [16].Rai R, Kashina A. Identification of mammalian arginyltransferases that modify a specific subset of protein substrates. Proc Natl Acad Sci U S A. 2005;102:10123–8. doi: 10.1073/pnas.0504500102. [DOI] [PMC free article] [PubMed] [Google Scholar]
- [17].Liu H, Chen B, Lilly B. Fibroblasts potentiate blood vessel formation partially through secreted factor TIMP-1. Angiogenesis. 2008;11:223–34. doi: 10.1007/s10456-008-9102-8. [DOI] [PubMed] [Google Scholar]
- [18].Elias S, Ciechanover A. Post-translational addition of an arginine moiety to acidic NH2 termini of proteins is required for their recognition by ubiquitin-protein ligase. J Biol Chem. 1990;265:15511–7. [PubMed] [Google Scholar]
- [19].Bachmair A, Finley D, Varshavsky A. In vivo half-life of a protein is a function of its amino-terminal residue. Science. 1986;234:179–86. doi: 10.1126/science.3018930. [DOI] [PubMed] [Google Scholar]
- [20].Davydov IV, Varshavsky A. RGS4 is arginylated and degraded by the N-end rule pathway in vitro. J Biol Chem. 2000;275:22931–41. doi: 10.1074/jbc.M001605200. [DOI] [PubMed] [Google Scholar]
- [21].Lee MJ, Tasaki T, Moroi K, An JY, Kimura S, Davydov IV, et al. RGS4 and RGS5 are in vivo substrates of the N-end rule pathway. Proc Natl Acad Sci U S A. 2005;102:15030–5. doi: 10.1073/pnas.0507533102. [DOI] [PMC free article] [PubMed] [Google Scholar]
- [22].Kurosaka S, Leu NA, Zhang F, Bunte R, Saha S, Wang J, et al. Arginylation-dependent neural crest cell migration is essential for mouse development. PLoS Genet. 2010;6:e1000878. doi: 10.1371/journal.pgen.1000878. [DOI] [PMC free article] [PubMed] [Google Scholar]
- [23].Kamei H, Koide T, Hashimoto Y, Kojima T, Hasegawa M. Tumor cell growth suppression by tannic acid. Cancer Biother Radiopharm. 1999;14:135–8. doi: 10.1089/cbr.1999.14.135. [DOI] [PubMed] [Google Scholar]
- [24].Liu X, Kim JK, Li Y, Li J, Liu F, Chen X. Tannic acid stimulates glucose transport and inhibits adipocyte differentiation in 3T3-L1 cells. J Nutr. 2005;135:165–71. doi: 10.1093/jn/135.2.165. [DOI] [PubMed] [Google Scholar]
- [25].Trabucchi E, Preis Baruffaldi F, Baratti C, Montorsi W. Topical treatment of experimental skin lesions in rats: macroscopic, microscopic and scanning electron-microscopic evaluation of the healing process. Int J Tissue React. 1986;8:533–44. [PubMed] [Google Scholar]
- [26].Uneyama H, Uneyama C, Ebihara S, Akaike N. Suramin and reactive blue 2 are antagonists for a newly identified purinoceptor on rat megakaryocyte. Br J Pharmacol. 1994;111:245–9. doi: 10.1111/j.1476-5381.1994.tb14051.x. [DOI] [PMC free article] [PubMed] [Google Scholar]
- [27].Rice WR, Singleton FM. Reactive blue 2 selectively inhibits P2y-purinoceptor-stimulated surfactant phospholipid secretion from rat isolated alveolar type II cells. Br J Pharmacol. 1989;97:158–62. doi: 10.1111/j.1476-5381.1989.tb11937.x. [DOI] [PMC free article] [PubMed] [Google Scholar]
- [28].Baghdiguian S, Boudier JL, Boudier JA, Fantini J. Intracellular localisation of suramin, an anticancer drug, in human colon adenocarcinoma cells: a study by quantitative autoradiography. Eur J Cancer. 1996;32A:525–32. doi: 10.1016/0959-8049(95)00588-9. [DOI] [PubMed] [Google Scholar]
- [29].Lamalice L, Le Boeuf F, Huot J. Endothelial cell migration during angiogenesis. Circ Res. 2007;100:782–94. doi: 10.1161/01.RES.0000259593.07661.1e. [DOI] [PubMed] [Google Scholar]
- [30].Albig AR, Schiemann WP. Identification and characterization of regulator of G protein signaling 4 (RGS4) as a novel inhibitor of tubulogenesis: RGS4 inhibits mitogen-activated protein kinases and vascular endothelial growth factor signaling. Mol Biol Cell. 2005;16:609–25. doi: 10.1091/mbc.E04-06-0479. [DOI] [PMC free article] [PubMed] [Google Scholar]
- [31].Jin Y, An X, Ye Z, Cully B, Wu J, Li J. RGS5, a hypoxia-inducible apoptotic stimulator in endothelial cells. J Biol Chem. 2009;284:23436–43. doi: 10.1074/jbc.M109.032664. [DOI] [PMC free article] [PubMed] [Google Scholar]
- [32].Chen X, Beutler JA, McCloud TG, Loehfelm A, Yang L, Dong HF, et al. Tannic acid is an inhibitor of CXCL12 (SDF-1alpha)/CXCR4 with antiangiogenic activity. Clin Cancer Res. 2003;9:3115–23. [PubMed] [Google Scholar]
Associated Data
This section collects any data citations, data availability statements, or supplementary materials included in this article.