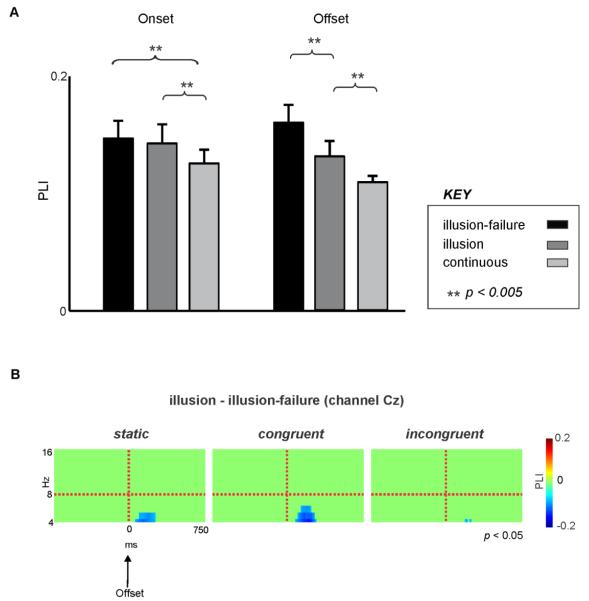
Figure 4. Phase-locking dynamics at onset and offset of interruptions.
A. Theta PLIs following the onset and offset of interruptions for the “illusion-failure”, “illusion”, and “continuous” percept types, averaged across all visual conditions. Error bars indicate 1 SE. B. Spectrograms showing the statistically significant differences between the PLIs of “illusion” and “illusion-failure” for all three visual conditions time-locked to the offset of interruptions. Cool colors indicate that the “illusion” had smaller activity than “illusion-failure” (suppression) and warm colors indicate the opposite. Time and frequency bins which did not reach significance were deliberately set to 0 (pure green color).

