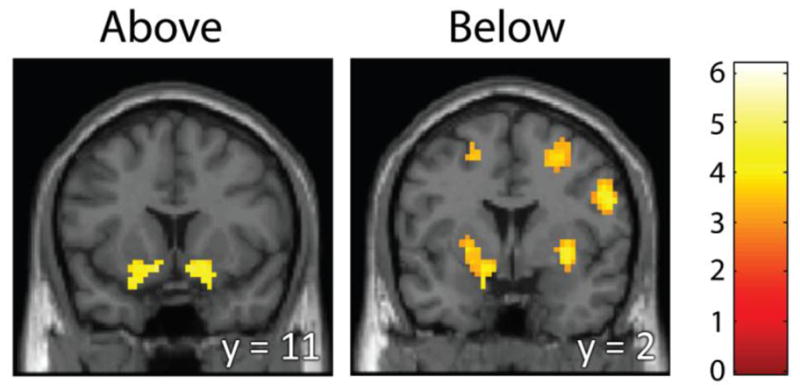
Figure 2.

Whole-brain analysis for identifying brain regions responding to positive delta. Regions are shown whose BOLD response increased with an increase in asset price from the previous period, above (left) and below (right) the purchase price. We find ventral striatal activity both above and below the purchase price in response to upticks in value. Below the asset price, we also find DLPFC and motor area activation. Coronal sections are shown here (MNI y = 11 above, and y = 2 below). Statistical thresholding was set at p < 0.001, k ≥ 53 (above), and k ≥ 42 (below), resulting in a whole-brain FDR<0.05 for both contrasts.
