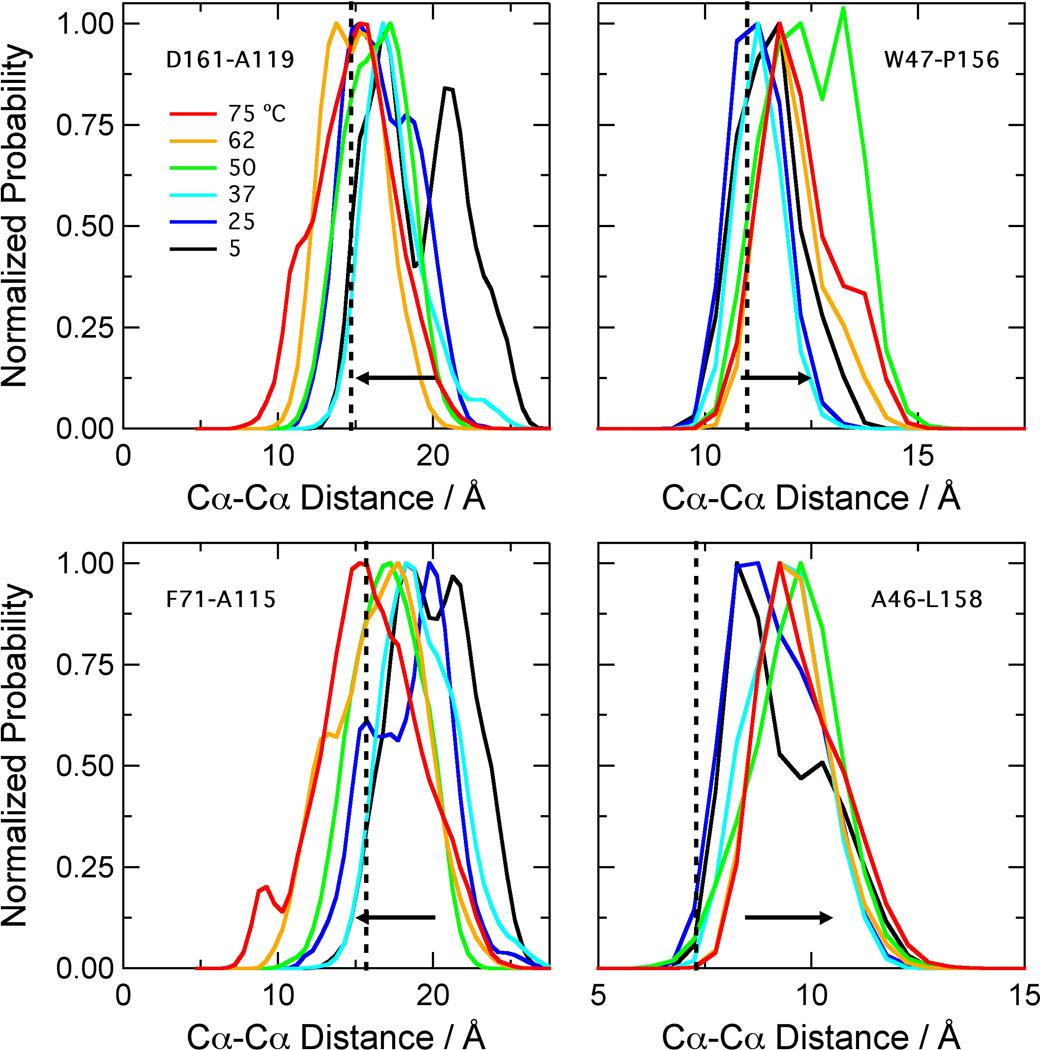
Figure 2.
Distributions of backbone distances across the FMN binding site of NOX. The histograms were calculated with 0.5-A bins from data saved at 1-ps intervals from three ~21-ns simulations at each temperature. Because the protein is dimeric, this gave ~126,000 data points for each histogram. The distances in the crystal structure (1nox.pdb)27 are D161-A119, 14.7 Å; F71-A115, 15.7 Å; W47-P156, 11.0 Å; A46-L158, 7.3 Å (vertical dotted lines). The W47-P156 and A46-L158 distances increase with temperature; the D161-A119 and F71-A115 distances decrease (horizontal arrows).

