Abstract
Purpose
To describe corneal and crystalline lens dimensions before, during, and after myopia onset compared to age-matched emmetropic values.
Methods
Subjects were 732 children 6 to 14 years of age who became myopic and 596 emmetropic children participating between 1989 and 2007 in the Collaborative Longitudinal Evaluation of Ethnicity and Refractive Error Study. Refractive error was measured using cycloplegic autorefraction, corneal power using a hand-held autokeratometer, crystalline lens parameters using video-based phakometry, and vitreous chamber depth (VCD) using A-scan ultrasonography. Corneal and crystalline lens parameters in children who became myopic were compared to age-, gender-, and ethnicity-matched model estimates of emmetrope values annually from 5 years before through 5 years after the onset of myopia. The comparison was made without, then with statistical adjustment of emmetrope component values to compensate for the effects of longer VCDs in children who became myopic.
Results
Before myopia onset, the crystalline lens thinned, flattened, and lost power at similar rates for emmetropes and children who became myopic. The crystalline lens stopped thinning, flattening, and losing power within ±1 year of onset in children who became myopic compared to emmetropes statistically adjusted to match the longer vitreous chamber depths of children who became myopic. In contrast, the cornea was only slightly steeper in children who became myopic compared to emmetropes (<0.25 D) and underwent little change across visits.
Conclusions
Myopia onset is characterized by an abrupt loss of compensatory changes in the crystalline lens that continue in emmetropes throughout childhood axial elongation. The mechanism responsible for this decoupling remains speculative, but might include restricted equatorial growth from internal mechanical factors.
Keywords: myopia, crystalline lens, cornea, refractive error
The optical and structural development of the major dioptric components of the eye, the cornea and crystalline lens, has been well-documented from infancy through childhood. The cornea displays little difference as a function of age despite its importance as two-thirds of the dioptric power of the eye. At 47 D to 48 D, average corneal power is greater in infants than in children or adults for a relatively brief period,1–3 then by age 3 to 9 months reaches values of 43 D to 44 D that remain stable throughout childhood.4–7 The crystalline lens undergoes more substantial age-related changes in several parameters over a longer period of time. The anterior surface radius of curvature averages 7.2 mm in early infancy, then flattens by some 4.5 mm to reach 11–12 mm by age 14 years.4, 8–9 The posterior surface follows a similar time course, with radii in infancy averaging 4.7 mm, flattening to 6–7 mm by age 14 years.4, 8–9 Flattening radii of curvature over time contribute to an overall loss in equivalent power of about 18 D to 19 D; the average crystalline lens power of 41 D in infancy becomes about 22–23 D by age 14 years.4–6, 9 This power loss from flattening radii of curvature is facilitated by an accompanying decrease in the lens equivalent refractive index for much of infancy and early childhood. An equivalent refractive index of 1.45 in early infancy drops to 1.43 to 1.42 by age 10 years, responsible for nearly half of the decrease in crystalline lens equivalent power.4–6 After age 10 years, lens refractive index appears to be stable on average in white and Asian children, continues to decrease in Native Americans, but switches direction to increase in African-American and Hispanic children.6 Lens thickness also decreases in infancy and early childhood from an average of 3.7–4.0 mm in infancy to 3.4–3.5 mm at age 10 years.4–7, 10–11 Except for one report in Tibetan children,9 lens thinning reverses direction to become lens thickening after the age of 10–13 years in most ethnic groups.6–7, 12 The substantial decreases in crystalline lens power that take place with age are counter-balanced by a vitreous chamber depth (VCD) that elongates from 10–11 mm at birth to become 16–17 mm by age 14 years.5–7, 9–11
Precise balance between corneal and lenticular refractive power and the length of the eye should result in a stable refractive state. The ocular components that are in balance in emmetropia are obviously out of balance in myopia: the eye is too long for the optical power of the cornea and crystalline lens. Understanding the temporal pattern of how this imbalance develops requires data both before and after the onset of myopia. Numerous studies have documented average values by age for myopic and emmetropic individuals,13–17 longitudinal studies have reported change in ocular components as a function of age,5, 7, 18 but the behavior of the optical ocular components before and after the onset of myopia has not been reported in detail. One longitudinal study compared children at their last emmetropic visit before myopia onset to children who remained emmetropic. The average corneal power of the children who became myopic was about 0.8 D greater and there were no differences in lens thickness or power compared to those who remained emmetropic;19 however this study provided data at only one point in time before myopia onset. The purpose of the current paper is to document the temporal development of corneal power and several crystalline lens parameters (thickness, equivalent power, radii of curvature, and refractive index) across the years before, during, and after myopia onset in comparison to age-matched emmetropic values.
METHODS
Subjects were children 6 to 14 years of age participating between 1989 and 2007 in the Collaborative Longitudinal Evaluation of Ethnicity and Refractive Error (CLEERE) Study, a cohort study of ocular component development and risk factors for the onset of myopia in children of various ethnicities. The CLEERE Study is an extension of the Orinda Longitudinal Study of Myopia (OLSM), begun in 1989 in the predominantly white community of Orinda, California. In order to improve generalizability with respect to ethnicity, four additional clinic sites were added to recruit predominantly African-American children (Eutaw, Alabama), Asian children (Irvine, California), and Hispanic children (Houston, Texas). Testing of Native-American children began in Tucson, Arizona in 2000. Each affiliated university’s institutional review board (University of California, Berkeley; The Ohio State University; University of Alabama at Birmingham; Southern California College of Optometry; University of Houston; University of Arizona) approved informed consent documents according to the tenets of the Declaration of Helsinki. Parents provided consent and children assent before the children were examined.
Ethnic group designation was determined after completion of a medical history form by a parent. Parents selected one of the following six ethnic designations: (corresponding to the categories used by the National Institutes of Health as of 1997 when ethnic data were first gathered): American Indian or Alaskan Native; Asian or Pacific Islander; Black or African American not of Hispanic origin; Hispanic; white not of Hispanic origin; Other, or unknown. Ethnicity was assigned to the target ethnic group for the given site when parents provided more than one ethnic designation that included the site’s targeted ethnicity (1.7% of subjects). If parents provided more than one ethnic designation and neither included the site’s targeted designation, ethnicity was assigned to the non-white ethnic designation. Any missing parent-reported ethnicity was filled in from investigator observation (5.7% of subjects). Investigator observation shows excellent agreement with parent-reported ethnicity.20 There were 4,929 children enrolled in CLEERE between 1989 and 2007 and 1,110 of these were myopic on at least one visit. Of these, 371 children met the myopia criterion (at least −0.75 D in each principal meridian by cycloplegic autorefraction) on the first visit and were not considered further in the analysis. This criterion level for myopia was chosen because it is beyond the measurement error of the autorefractors used to measure refractive error, it is likely to create symptoms of distance blur, and it is typically of a magnitude considered significant and worthy of correction by clinicians. Of the remaining 739, there were 7 children with an ethnic designation of Other who were excluded, leaving 732 myopic children for analysis (56% female, 23% Asian, 14% African-American, 29% Hispanic, 9% Native American, and 25% white). There were 596 emmetropic children who were between −0.25 D and +1.00 D (exclusive) in each meridian at all study visits by cycloplegic autorefraction (46% female, 9% Asian, 19% African-American, 18% Hispanic, 17% Native American, and 37% white). The remaining children were either hyperopic, had simple hyperopic or myopic astigmatism, or were mixed astigmats on at least one visit and were not analyzed (n = 3,223). While the number excluded was large, the inclusion criteria were strict so that clearer contrasts might be drawn between two distinct and unambiguous groups.
Trained and certified examiners measured central refractive error using the Canon R-1 autorefractor (Canon USA, Lake Success, NY; no longer manufactured) between 1989 and 2000 and using the Grand Seiko WR 5100-K autorefractor in 2001 to 2007 (Grand Seiko Co., Hiroshima, Japan). Subjects were tested after mydriasis and cycloplegia. When subjects had an iris color of grade 1 or 2,21 testing was done 30 minutes after one drop of proparacaine 0.5% and two drops of tropicamide 1%. When subjects had an iris color darker than grade 2, testing was done 30 minutes after one drop of proparacaine 0.5% and one drop each of tropicamide 1% and cyclopentolate 1%.22 The protocol for crystalline lens measurement has been described in detail previously.8 Briefly, two pairs of Purkinje images were produced by a collimated dual fiber optic light source reflecting from the anterior and posterior surfaces of the crystalline lens. The separation of each pair of images is proportional to the radius of curvature in air. These radii in air were converted to radii in the eye, including an individual equivalent refractive index, by an iterative process to produce agreement between the measured Purkinje images, the remaining ocular components, and the subject’s refractive error. The individual refractive index and lens radii of curvature were used to calculate the equivalent power of the crystalline lens. The Gullstrand-Emsley value for lens refractive index (1.416) was used with the radii of curvature to calculate a Gullstrand-Emsley lens power, one that would serve as a composite representing general lens shape. Corneal power was measured using the Alcon Auto-Keratometer (Alcon Systems, St. Louis, MO). Axial ocular dimensions were measured by A-scan ultrasonography (Model 820, Humphrey Instruments, San Leandro, CA), consisting of five readings using a handheld probe on semi-automatic mode.
Emmetrope Models
Separate growth curves for each ocular component were constructed for emmetropes as a function of age according to the best fitting models defined by the Akaike Information Criterion.23 Gender and ethnicity and the interaction between ethnicity and age, first without VCD then with VCD, were subsequently included in the models when appropriate using SAS mixed ANOVA modeling with repeated measures (version 9.1, SAS Institute, Cary, NC).
Age-, Gender-, and Ethnicity-Matched Emmetropic Values
To be included in the “became myopic” group, a subject had to be non-myopic on at least one visit prior to a myopic visit (myopia defined as at least −0.75D in each principal meridian). The year the “became myopic” subject first met the myopia criterion was defined as year 0, the year of onset. The first study year prior to onset was −1, two years prior was −2, and so forth out to −5 years prior to onset. Each study year following onset for a given subject was designated as +1, +2 and so forth out to +5. The age, gender, and ethnicity of each individual “became myopic” subject at each study visit were applied to each component’s emmetrope regression equation. This provided an age-, gender-, and ethnicity-matched emmetropic value of each ocular variable for every “became myopic” data point. Results are presented first as the age-, gender-, and ethnicity-matched emmetrope base model values, then are presented with VCD added to the base emmetrope model in order to account for the estimated effects of the longer became-myopic VCD. In this analysis, the age, gender, ethnicity, and VCD of each individual “became myopic” subject at each study visit was applied to each component’s emmetrope regression equation that included a VCD term. These results provided an age-, gender-, ethnicity-, and VCD-matched emmetrope value to compare with became-myopic data. This adjustment is needed because became-myopic eyes will eventually become on the order of 1 mm longer than emmetrope eyes and VCD is correlated with the ocular components being analyzed.15, 24–27 This adjustment was not applied to data for corneal power because unlike all other components, corneal power showed no significant within-subject longitudinal correlation with VCD (corneal within-subject correlation = −0.07 vs. between-subject correlation = −0.75). All other component variables showed good concordance for between- and within-subject correlations (between-subject range: −0.25 for refractive index to −0.58 for calculated lens power; within-subject range: −0.15 for refractive index to −0.38 for calculated lens power). If an imbalance in more familiar variables such as age or gender were to occur between groups and these variables were also correlated with outcome variables of interest, then statistical adjustment for these imbalanced variables would be a standard treatment of data in order to make valid comparisons. In this case, the adjustment for VCD allows one to compare the expected value of an ocular component of a myope to that of an emmetrope with the same VCD as the myope.
The value of this statistical adjustment for VCD is illustrated in the following example. Consider two bands that are stretched and appear to lengthen at the same rate. It might be the case that the two bands show similar lengthening because the forces acting upon them and their elastic properties are equal. However, it might be the case that their apparent equality conceals a greater force being applied to one in combination with a greater intrinsic resistance. The difference in VCD between emmetropes and became-myopic children is analogous to the difference in stretching force in this example. The purpose of adding VCD to the emmetrope age, gender, and ethnicity base model is to adjust for the influence of various eye sizes, whether the influence is based in stretch or from any source. This procedure removes differences in component values that are merely due to statistically predictable differences in VCD. Putting component values on a equal footing for VCD (equal force applied in this analogy) allows for a more direct comparison of the underlying differences in the behavior (resistance properties in this analogy) of the crystalline lens during the process of becoming myopic. This approach is reminiscent of van Alphen’s use of partial correlation when he described his size factor S and stretch factor P.24 Mixed modeling was then used to compare the mean difference between “became myopic” data and these emmetrope base model values as a function of study visit for each ocular variable. Throughout the following text, became-myopic refers to the data from children in that category and emmetrope refers to the values estimated from the model derived from emmetropic children’s data. The number of became myopic children at each study visit are given in Table 1 along with the sample average for the spherical component of refractive error (minus cylinder notation where sphere is the most hyperopic (least myopic) meridian). A significance level of p<0.01 was used in consideration of the large sample size. This level of adjustment is somewhat arbitrary, but represents a compromise between filtering out false positive findings while allowing small differences to reach significance.
Table 1.
Number of Became-Myopic subjects and average refractive error (spherical component in minus cylinder notation) at each study visit.
| Visit | −5 | −4 | −3 | −2 | −1 | 0 | +1 | +2 | +3 | +4 | +5 |
| n | 145 | 267 | 407 | 566 | 683 | 732 | 532 | 394 | 256 | 140 | 64 |
| Average refractive error | +0.76 | +0.60 | +0.46 | +0.21 | −0.21 | −1.06 | −1.44 | −1.87 | −2.37 | −2.68 | −3.29 |
RESULTS
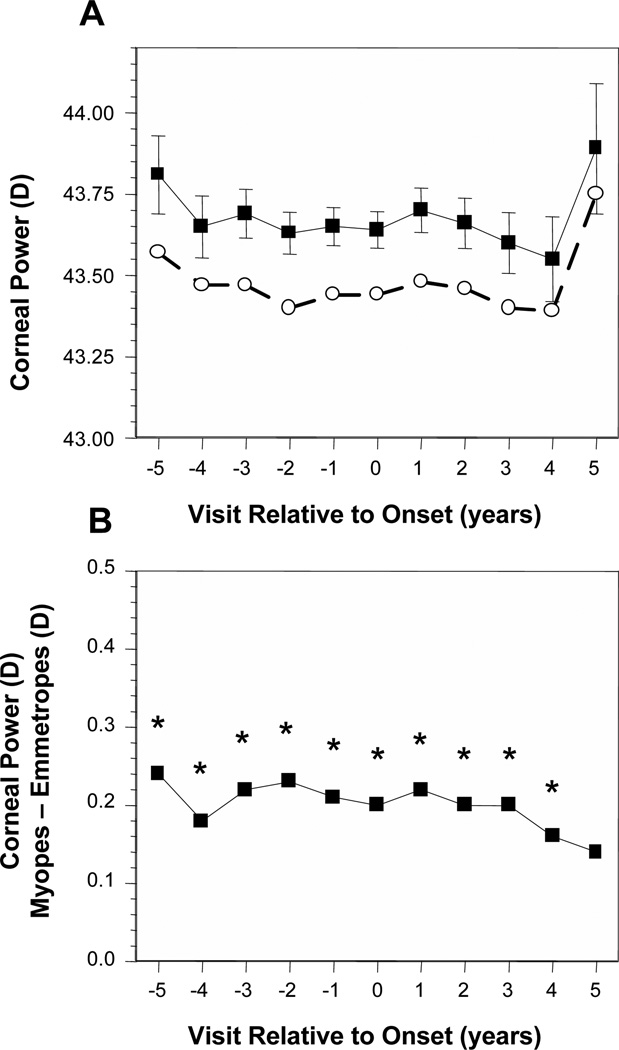
Figure 1A displays the average corneal power of became-myopic children compared with emmetropes as a function of years relative to the onset of myopia. No adjustment was made for VCD because corneal power did not show significant within-subject correlation with change in VCD over time. Emmetropes had a consistent average corneal power of about 43.50 D and became-myopic children averaged about 43.75 D across these years. The difference in corneal power between became-myopic children and emmetropes was significant in every year from −5 and +4. Became-myopic children had steeper corneal powers yet this difference was always very small at under 0.25 D with no significant change across visits (Figure 1B).
Figure 1.
Corneal power as a function of annual visit relative to the onset of myopia (−5 years before to +5 years after, with onset designated as year 0). (A) Data are shown for became-myopic children (■) and emmetropes (○). Error bars are 95% confidence intervals. (B) The difference between became-myopic and emmetrope data unadjusted for VCD. *Significant differences between became-myopic and emmetropic children (i.e., the difference between groups is significant relative to a value of 0).
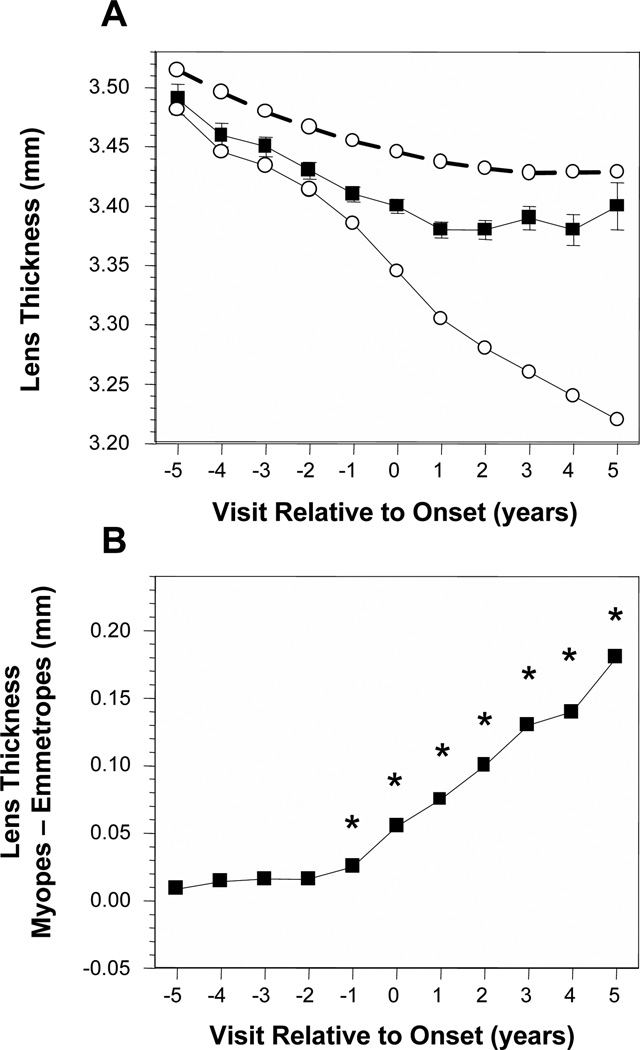
Figure 2A displays the average lens thickness of became-myopic children compared with emmetropes as a function of years relative to the onset of myopia. Without adjusting for VCD, became-myopic children had thinner lenses in each year and a larger amount of lens thinning compared to emmetropes, a decrease of about 0.10 mm across years −5 to +5. The impact of adjusting for the correlation between VCD and LT (and each ocular component that follows) can be seen in the differences between the emmetrope results presented with the dashed lines compared to the solid lines. Adjusting for VCD indicates that if emmetropic eyes were as long as the became-myopic eyes, lens thickness of emmetropes would have decreased by about 0.26 mm between years −5 and +5 (Figure 2A, open symbols, solid line). The pattern of difference in lens thickness was distinct from corneal power. There were no significant differences in lens thickness between became-myopic children and VCD-adjusted emmetropes in years −5 through −2. The first significant year was −1 with much larger and significant differences to follow in years 0 through +5 (Figure 2B).
Figure 2.
Lens thickness in the became-myopic and emmetrope groups (A). The dashed lines represent emmetrope values unadjusted for vitreous chamber depth and the solid lines are following adjustment for vitreous chamber depth. Error bars are 95% confidence intervals. The difference in lens thickness between became-myopic children and emmetropes adjusted for VCD are shown in (B). Symbols are as in Figure 1.
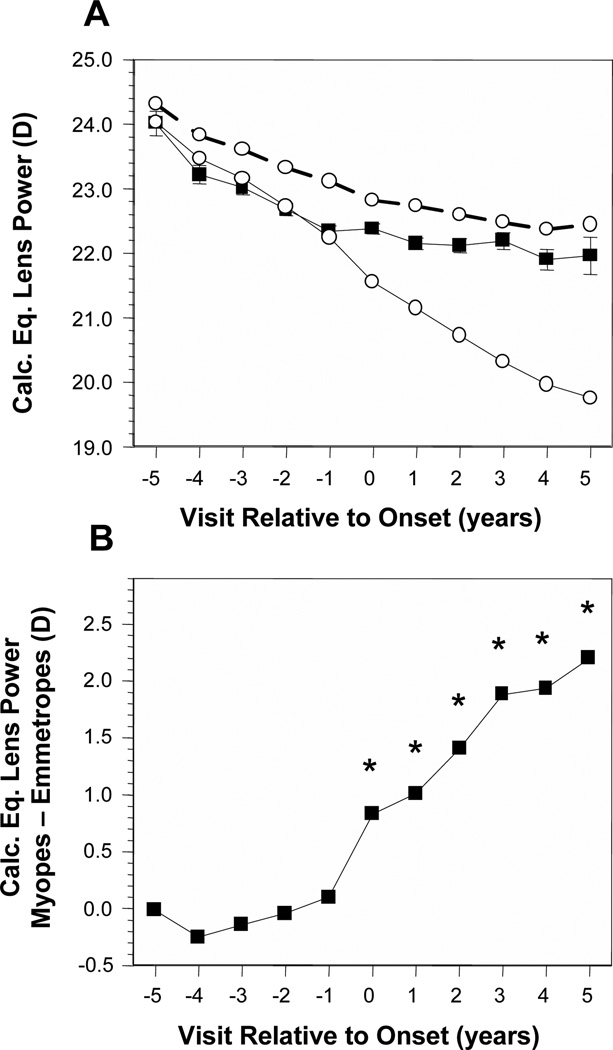
Figure 3A displays the average calculated equivalent crystalline lens power (CLP) of became-myopic children compared with emmetropes. Without adjusting for VCD, became-myopic children had lower average values than emmetropes for CLP by about 0.50 D to 0.75 D in every year but −5, +3, and +5. Each group decreased in CLP by 1.0 D to 1.25 D across years −5 to +5. Adjusting for VCD indicates that if emmetropic eyes were as long as the became-myopic eyes, the CLP of emmetropes would have decreased by about 4 D between years −5 and +5 (Figure 3A, open symbols, solid line). The pattern of difference in CLP was similar to that for lens thickness. There were no significant differences in CLP between became-myopic children and VCD-adjusted emmetropes across years in years −5 through −1. The first significant year was 0 with increasing differences of 1 D to 2 D in years 0 through +5 (Figure 3B).
Figure 3.
Calculated lens equivalent power in the became-myopic and emmetrope groups (A); difference in calculated lens equivalent power between became-myopic children and emmetropes adjusted for VCD (B). Symbols are as in Figure 1.
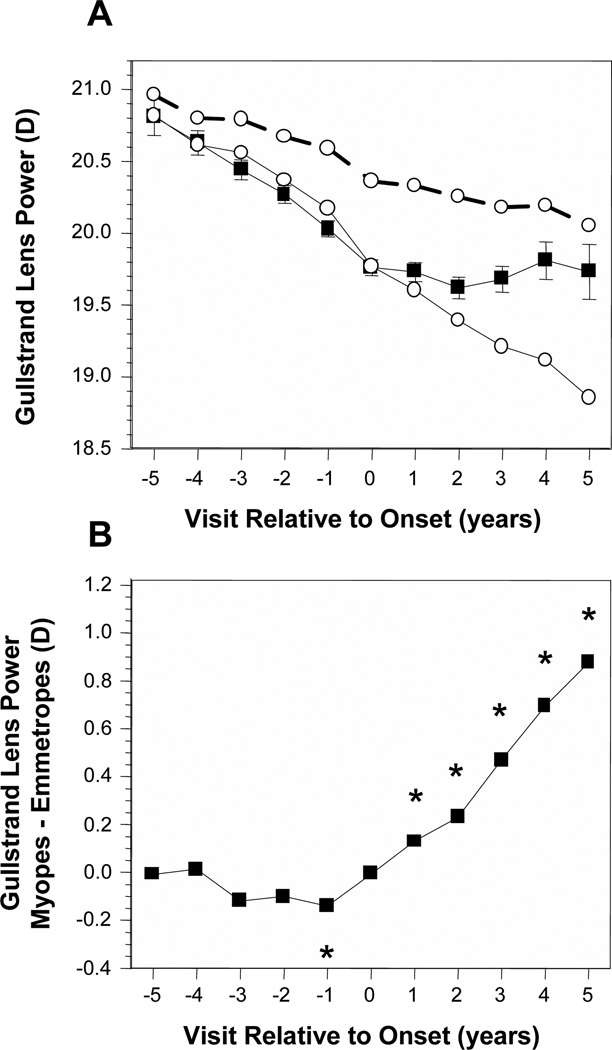
Figure 4A displays the average Gullstrand-Emsley crystalline lens power (GLP) of became-myopic children compared with emmetropes. Without adjusting for VCD, became-myopic children had lower (flatter) average values than emmetropes for GLP by about 0.3 D to 0.6 D in every year but −5. Each group decreased in GLP by about 0.75 D across years −5 to +5. Adjusting for VCD indicates that if emmetropic eyes were as long as the became-myopic eyes, the GLP of emmetropes would have decreased by about 1.75 D between years −5 and +5 (Figure 4A, open symbols, solid line). The pattern of difference in GLP was again similar to that for lens thickness. There were no significant differences in GLP between became-myopic children and VCD-adjusted emmetropes across years in years −5 through −2. The first significant year was in year −1 where GLP was actually lower, flatter in became-myopic children. The difference then changed in sign to become significantly greater, steeper by 0.1 D to 0.9 D in years +1 through +5 (Figure 4B).
Figure 4.
Gullstrand lens power in the became-myopic and emmetrope groups (A); difference in Gullstrand lens power between became-myopic children and emmetropes adjusted for VCD (B). Symbols are as in Figure 1.
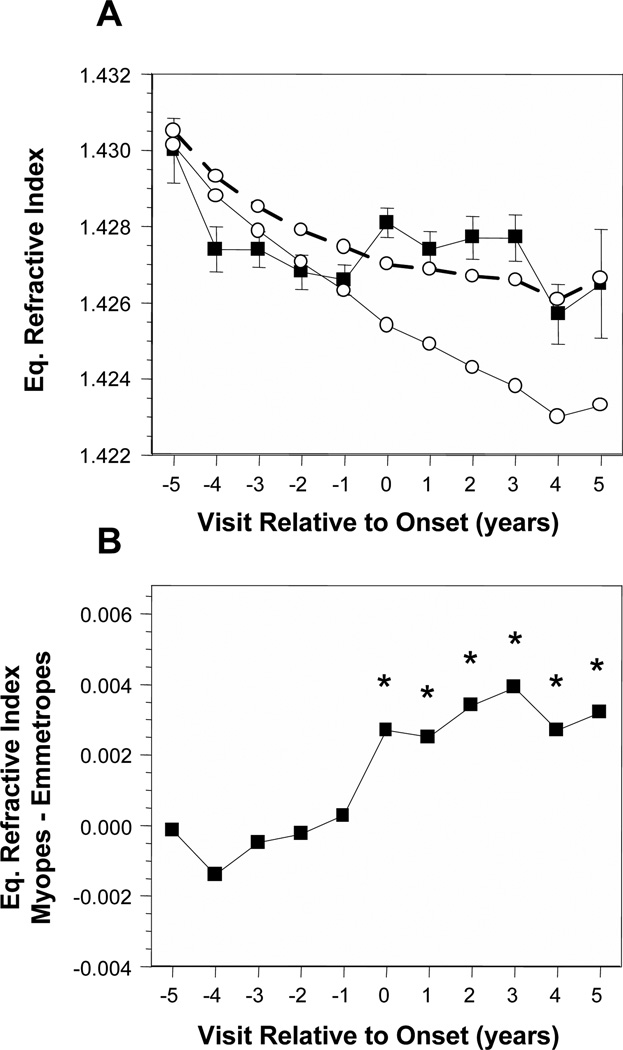
Figure 5A displays the average crystalline lens equivalent refractive index (IND) of became-myopic children compared with emmetropes. With no adjustment for VCD, the IND for became-myopic children tended to remain in a narrow range of ±0.001 while IND for emmetropes decreased by about 0.003. As a result, became-myopic children had lower average values than emmetropes for IND by about 0.001 to 0.002 before onset in years −4 and −2, but a higher average value by about 0.001 at onset in year 0. Accounting for VCD indicates that if emmetropic eyes were as long as the became-myopic eyes, the IND of emmetropes would have decreased by about 0.007 between years −5 and +5 (Figure 5A, open symbols, solid line). The pattern of difference in IND was again similar to that for lens thickness. There were no significant differences in IND between became-myopic children and VCD-adjusted emmetropes across years in years −5 through −1. The first significant year was in onset year 0 where IND was higher in became-myopic children by about 0.003. The difference was consistent and significant in years +1 through +5 (Figure 5B).
Figure 5.
Crystalline lens equivalent refractive index in the became-myopic and emmetrope groups (A); difference in calculated lens equivalent refractive index between became-myopic children and emmetropes adjusted for VCD (B). Symbols are as in Figure 1.
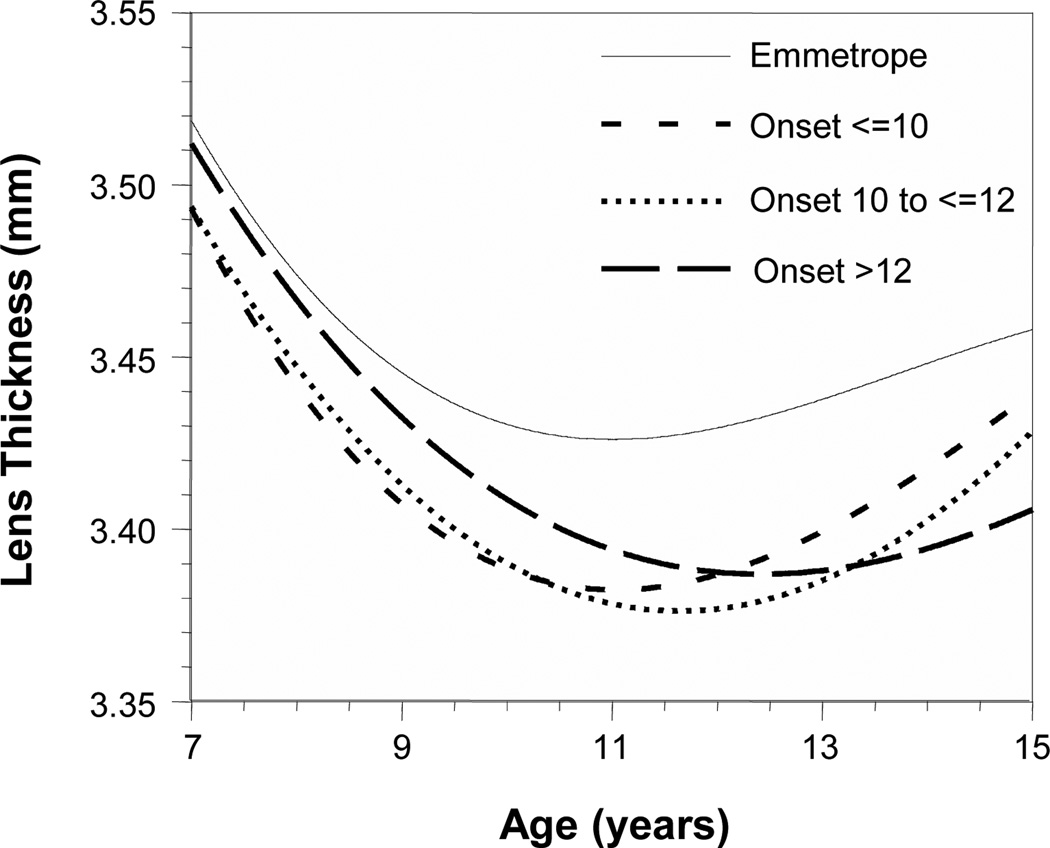
The results in Figures 2B–5B suggest that the crystalline lens does not change in the same manner in response to vitreous chamber elongation after myopia onset as it does before onset. The temporal pattern indicates a substantial inhibition of lens thinning, flattening, and power loss either one year before or in the year of myopia onset. Cubic multilevel growth curves were fitted for lens thickness unadjusted for VCD as a function of age and refractive error group in order to explore this behavior, as reported in previous studies (Figure 6).7, 17 The myopic refractive error group was further subdivided into three different ages of onset: ≤10 years, 10 years to ≤12 years, and >12 years. The growth curves indicate thinner lenses for myopes than observed in emmetropes at all ages. At their minimum lens thicknesses, the myopia onset age groups were significantly thinner than emmetropes by 0.04–0.05 mm (Table 2; p = 0.0003). The age of minimum lens thickness was also significantly later as the age of myopia onset increased. The age of minimum lens thickness was 0.60 years sooner in the earliest onset group and 0.78 years later in the latest onset group compared to the middle onset group (p = 0.01 for each).
Figure 6.
Cubic multilevel growth curves for lens thickness as a function of age and three age of myopia onset groups (≤10 years, 10 years to ≤12 years, and >12 years). The growth curves for myopes indicate thinner lenses at all ages with later ages of minimum lens thickness the older the age of onset.
Table 2.
Minimum lens thickness and the age when minimum lens thickness is reached as a function of refractive error group and age of onset of myopia.
| Group | n | Average age of myopia onset within each group (±SD) | Age at lens thickness minimum | Minimum lens thickness (mm) |
|---|---|---|---|---|
| Emmetropes | 596 | NA | 11.01 | 3.43 |
| Myopia onset ≤10 years | 222 | 8.84 ± 0.77 | 11.05 | 3.38 |
| Myopia onset 10 to ≤12 years | 259 | 10.94 ± 0.56 | 11.65 | 3.38 |
| Myopia onset >12 years | 251 | 13.20 ± 0.81 | 12.43 | 3.39 |
Ethnicity
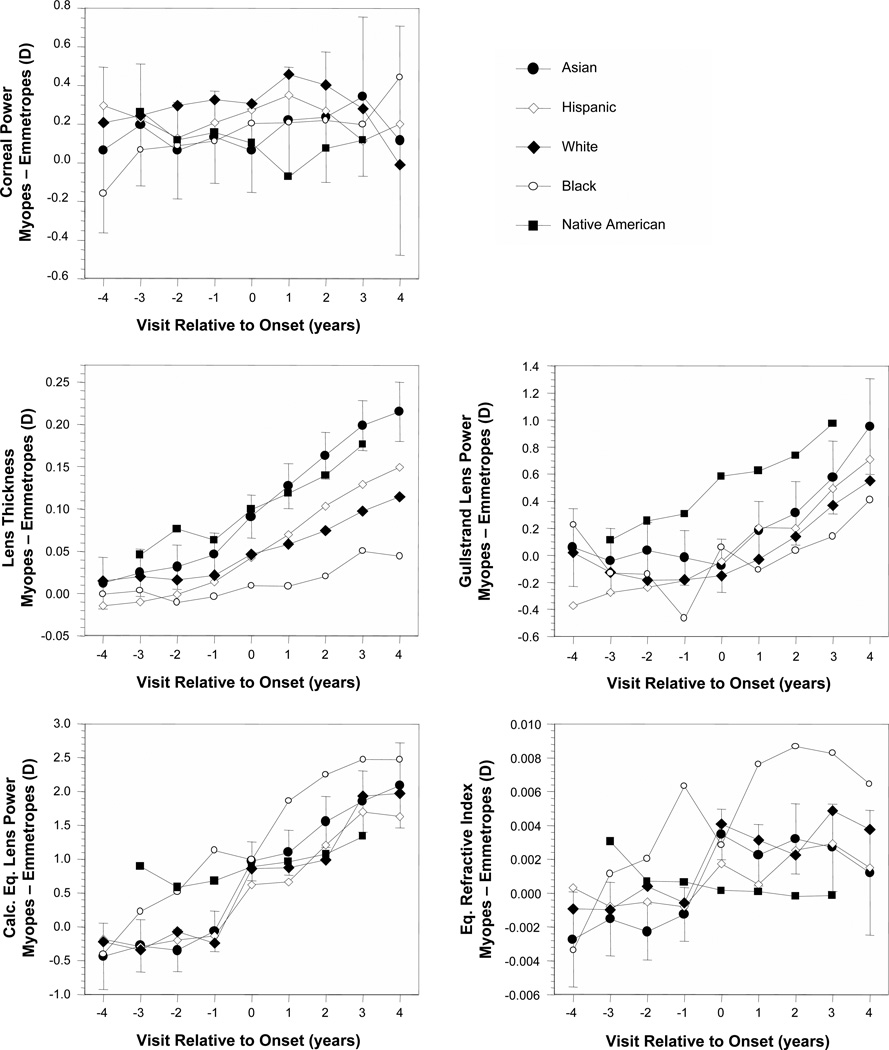
The differences between values in became-myopic children and age-, gender-, and ethnicity-matched VCD-adjusted emmetropes (Figures 1B–5B) are plotted for each ocular component variable as a function of ethnicity in Figure 7 (no VCD adjustment for corneal power). Corneal power was not different between became-myopic children and emmetropes in any study year for African-American, Asian-American, or Native American children. The greater corneal power in became-myopic children was only significant in Hispanics before and at onset and in whites at all visits except +4. Ethnic groups tended to follow a similar trajectory of development across the years before and after onset. Similar to the sample as a whole, differences between became-myopic children and emmetropes generally appeared within ±1 year of onset. One exception was African-American children whose average lens thickness and GLP were not significantly different between became-myopic children and emmetropes in any year. African-American became-myopic children also had the greatest differences in IND of any ethnic group. The pattern for African-American children for CLP and IND was more of a steady increase in differences between became-myopic and emmetrope children rather than more distinct, abrupt before-and-after myopia onset differences. Another exception was that lens equivalent refractive index was not significantly different between Native American became-myopic and emmetrope children in any study year.
Figure 7.
Ocular component differences between became-myopic and emmetrope groups as a function of visit relative to the onset of myopia and ethnicity. Error was similar between ethnic groups. Representative error bars (±95% confidence intervals) are included for Asians only for clarity.
Gender
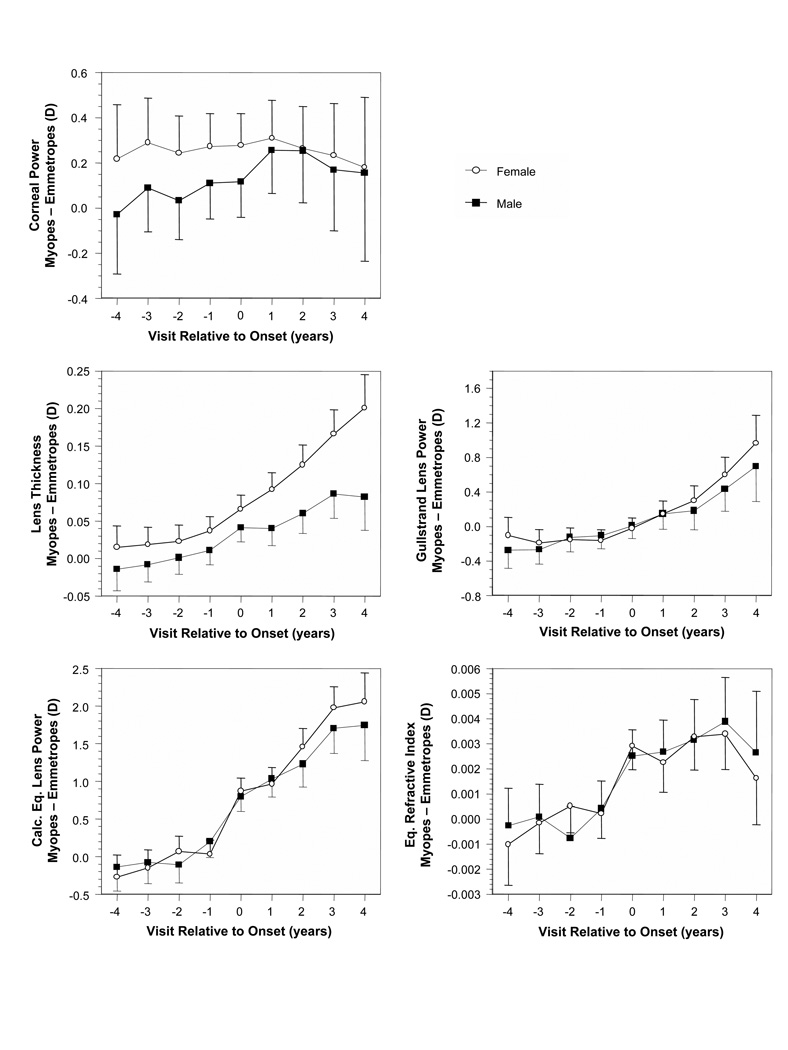
The differences between values in became-myopic children and age-, gender-, and ethnicity-matched VCD-adjusted emmetropes (Figures 1B–5B) are plotted for each ocular component variable as a function of gender in Figure 8 (no VCD adjustment for corneal power). Results for boys and girls follow each other closely with overlapping 95% confidence intervals for most ocular components, this despite girls tending to have smaller eyes and steeper, more powerful optical component values.6 The one exception was lens thickness, where after onset, from visits +1 through +5, the difference in lens thickness between emmetropic and became myopic girls was significantly greater (with higher positive differences) than the difference between emmetropic and became myopic boys.
Figure 8.
Ocular component differences between became-myopic and emmetrope groups as a function of visit relative to the onset of myopia and gender. Error bars are ±95% confidence intervals.
DISCUSSION
Results before myopia onset indicate that the normal development of the crystalline lens is characterized by thinning, flattening, and decreasing power to maintain emmetropia. These correlations, in place since infancy,4 maintain a balance between focal length and an axial length that will increase on average by about 3.0 mm between the ages of 9 months and 9 years.6 This balance is achieved through a decrease in lens power of over 15.0 D and virtually no change in corneal power.4, 6 The influence of the cornea also seemed secondary to that of the crystalline lens with respect to myopia onset. The dioptric difference in became-myopic children relative to emmetropes was minor at under 0.25 D. Corneal powers never changed substantially in either group despite continued eye growth. This finding is consistent with the general stability of corneal power in childhood reported in the literature.9, 27–30 In contrast, the crystalline lens underwent far more change in became-myopic children in LT, CLP, and GLP before myopia onset than after. Following van Alphen’s ideas,24 we have proposed that this correlation occurs through stretch from the physical connection between the distensible crystalline lens and the growing eye. Evidence for this stretch process can be found in the thinning of the crystalline lens despite its increasing wet weight31 and the lack of a 1:1 relationship between crystalline lens power loss and axial growth.4 A relationship closer to 1:1 would indicate that axial growth tracks crystalline lens power loss through defocus rather than that the growing eye stretches the crystalline lens. The relationship in infants was found to be about half this 1:1 ratio.4
The behavior of the crystalline lens before and after myopia onset indicates that the previously correlated, compensating response of the crystalline lens is interrupted at myopia onset. Optically this result is axiomatic; myopia would be impossible if the crystalline lens and axial length always changed in tandem. Yet myopia is almost always thought of first as excessive length. These results suggest that while excessive growth is important, growth only becomes myopic when an independence develops between the anterior segment (crystalline lens) and posterior segment (axial growth). For the sample as a whole, for each ethnic group (with the possible exception of African Americans), and for each gender (with girls showing a greater effect for lens thickness), this independence appeared at onset or within a year of onset. The crystalline lens ceased to thin, flatten, and lose power even as the eye continued to grow. It is noteworthy that despite differences in myopia prevalence between ethnicities, there seems to be some consistency in this process for most ethnic groups.
The predictable effects of defocus on ocular growth in animal models suggest that any sudden increase in axial growth that was independent of the crystalline lens might be caused by sudden exposure to defocus.32–35 The source of this defocus could be from either accommodative lag at the fovea, peripheral hyperopic defocus from a relatively prolate ocular shape, or a combination of the two factors. One study has reported exposures to increased accommodative lag two years before myopia onset.36 In contrast to those findings, myopic subjects in CLEERE showed a greater accommodative lag compared to emmetropes beginning one year after the onset of myopia for the sample as a whole or at onset in subjects wearing a refractive correction.37 Exposure to peripheral defocus is perhaps a better match to crystalline lens results in terms of years relative to onset; on average, subjects in CLEERE were first exposed to relative peripheral hyperopia one year before onset.38 Despite this general concordance in time between exposure to defocus and myopia onset, neither accommodative lag at the fovea nor relative peripheral hyperopia have been found to be associated with the risk of myopia onset in children or its rate of progression.37, 39–41 These negative results notwithstanding, it is possible that peripheral defocus could influence the growth of the eye considering that clinical trials of contact lens and spectacle treatments designed to alter peripheral defocus have shown some beneficial preliminary results in slowing myopia progression.42–45 These clinical trial results should be interpreted with caution, however, as the effects are small and sometimes only seen in selected subgroups.44 Nonetheless, the lack of a robust association between defocus and human ocular growth argue against sudden exposure to lag or peripheral hyperopia as a cause of myopic eye growth that is uncompensated by the crystalline lens.
This independence between axial growth and the crystalline lens at myopia onset might be due to cessation of peripheral scleral growth. If the ocular periphery did not grow, the lens might be less likely to stretch and therefore to thin, flatten, and lose power. Animal models suggest that central and peripheral development can be independent;46 however the current thinking from primate studies is that peripheral growth may help to regulate foveal refractive error.47–49 Evidence from children at 30° in the temporal retinal periphery suggests that the mid-periphery grows both before and after myopia onset, although at different rates compared to axial growth.38 More eccentric peripheral retinal loci nearer the equator, however, do show some evidence of a markedly reduced rate of growth after myopia onset. One of the noteworthy features of magnetic resonance imaging data from Atchison et al. is the lack of expansion of the far peripheral height and width of the eye as a function of degree of myopia compared to axial lengthening.50 These results are similar to recent MRI data from Singaporean Chinese children showing smaller far peripheral widths relative to axial length in myopes, whereas emmetropes had more symmetric globes.51 Physiologic inhibition of equatorial growth seems unlikely as both anterior retinal growth and ocular expansion are stimulated, not inhibited, by form deprivation in chick and primate models.52–53
If a mechanical process such as crystalline lens stretch underlies the maintenance of emmetropia, then interruption of stretch could be responsible for the abrupt independence between anterior and posterior segment development at myopia onset. Myopic eyes might display thinner lenses compared to emmetropes and, if stretch is inhibited near the onset of myopia, children with later ages of myopia onset might display minima in lens thickness at later ages. Both of these predictions are borne out in the data presented in Figure 6. Some possible sources of mechanical inhibition are external, such as the size of the orbit or extraocular muscle tension. We have argued against external sources based on the lack of monotonicity in the change in relative peripheral refraction mentioned above.38 In addition, there is an acceleration in the rate of change in refractive error, axial length, and relative peripheral refraction at myopia onset that argues against the steady application of an external restricting force near the equator.38 One proposed internal source of equatorial restriction was resistance of the crystalline lens to continued stretch; however, in vitro stretching studies indicate that the crystalline lens has an extensive capacity for stretch.54 In addition, there was no evidence of excess tension on the crystalline lens in myopes; post-saccadic crystalline lens oscillations were unrelated to refractive error.55 Day and coworkers found that mid- and high-frequency microfluctuations during accommodation were increased in late-onset myopes compared to emmetropes, possibly from accommodative plant noise, but poorer neurologic control and increased blur threshold were other possible sources.56 Therefore no clear line of evidence points to the crystalline lens itself as a source of internal tension.
The ciliary muscle is a potential candidate source of internal equatorial restriction. Although a recent study indicated that there was no correlation between axial length and ciliary muscle thickness,57 the authors argued that the equally thick but longer ciliary muscles found in longer eyes indicates that the ciliary muscle probably adds tissue as the eye grows. This normal ciliary muscle growth may accelerate as eyes become myopic. Another recent study has shown that the ciliary muscle is thicker in myopic children.58 Schultz et al. speculated that the increased thickness of the ciliary muscle in myopes suppressed the effect of the arterial pulse on the high frequency component of accommodative microfluctuations.55 The abnormally thick ciliary muscle for a given axial length in myopia may provide the mechanical restriction that would interfere with the equatorial expansion needed to maintain the correlation between ocular growth and optical compensation by the crystalline lens. Anterior mechanical restriction may limit far peripheral expansion, resulting in the relatively more prolate ocular shapes found in myopic eyes.50–51 Alterations in ciliary muscle might also explain the increase in the response AC/A ratio before the onset of myopia.59–60 Longitudinal observation of the ciliary muscle along with complete ocular biometry before and after the onset of myopia in children would be needed to confirm these speculations.
In summary, the process of becoming myopic appears to be more than just one of excess axial elongation. The myopic eye is certainly elongated relative to the emmetropic eye, but the elongation is accompanied at myopia onset by an abrupt independence between axial growth and longstanding, compensatory optical changes in the crystalline lens likely in place from infancy up to time of myopia onset. At onset and for at least the following 5 years, VCD-adjusted lens parameters stopped thinning, flattening, and losing power in children who became myopic compared to children who remained emmetropic. The stability of corneal power suggests it is unrelated to this process. Future studies should seek to determine the source of this departure from correlated growth that characterizes myopia onset.
Footnotes
Publisher's Disclaimer: This is a PDF file of an unedited manuscript that has been accepted for publication. As a service to our customers we are providing this early version of the manuscript. The manuscript will undergo copyediting, typesetting, and review of the resulting proof before it is published in its final citable form. Please note that during the production process errors may be discovered which could affect the content, and all legal disclaimers that apply to the journal pertain.
REFERENCES
- 1.Inagaki Y. The rapid change of corneal curvature in the neonatal period and infancy. Arch Ophthalmol. 1986;104:1026–1027. doi: 10.1001/archopht.1986.01050190084044. [DOI] [PubMed] [Google Scholar]
- 2.Insler MS, Cooper HD, May SE, Donzis PB. Analysis of corneal thickness and corneal curvature in infants. CLAO J. 1987;13:182–184. [PubMed] [Google Scholar]
- 3.Blomdahl S. Ultrasonic measurements of the eye in the newborn infant. Acta Ophthalmol. 1979;57:1048–1056. doi: 10.1111/j.1755-3768.1979.tb00536.x. [DOI] [PubMed] [Google Scholar]
- 4.Mutti DO, Mitchell GL, Jones LA, Friedman NE, Frane SL, Lin WK, Moeschberger ML, Zadnik K. Axial growth and changes in lenticular and corneal power during emmetropization in infants. Invest Ophthalmol Vis Sci. 2005;46:3074–3080. doi: 10.1167/iovs.04-1040. [DOI] [PubMed] [Google Scholar]
- 5.Jones LA, Mitchell GL, Mutti DO, Hayes JR, Moeschberger ML, Zadnik K. Comparison of ocular component growth curves among refractive error groups in children. Invest Ophthalmol Vis Sci. 2005;46:2317–2327. doi: 10.1167/iovs.04-0945. [DOI] [PubMed] [Google Scholar]
- 6.Twelker JD, Mitchell GL, Messer DH, Bhakta R, Jones LA, Mutti DO, Cotter SA, Klenstein RN, Manny RE, Zadnik K. Children's ocular components and age, gender, and ethnicity. Optom Vis Sci. 2009;86:918–935. doi: 10.1097/opx.0b013e3181b2f903. [DOI] [PMC free article] [PubMed] [Google Scholar]
- 7.Wong HB, Machin D, Tan SB, Wong TY, Saw SM. Ocular component growth curves among Singaporean children with different refractive error status. Invest Ophthalmol Vis Sci. 2010;51:1341–1347. doi: 10.1167/iovs.09-3431. [DOI] [PubMed] [Google Scholar]
- 8.Mutti DO, Zadnik K, Fusaro RE, Friedman NE, Sholtz RI, Adams AJ. Optical and structural development of the crystalline lens in childhood. Invest Ophthalmol Vis Sci. 1998;39:120–133. [PubMed] [Google Scholar]
- 9.Garner LF, Yap MK, Kinnear RF, Frith MJ. Ocular dimensions and refraction in Tibetan children. Optom Vis Sci. 1995;72:266–271. doi: 10.1097/00006324-199504000-00007. [DOI] [PubMed] [Google Scholar]
- 10.Luyckx J. Measurement of the optic components of the eye of the newborn by ultrasonic echography. Arch Ophtalmol Rev Gen Ophtalmol. 1966;26:159–170. [PubMed] [Google Scholar]
- 11.Larsen JS. The sagittal growth of the eye. II. Ultrasonic measurement of the axial diameter of the lens and the anterior segment from birth to puberty. Acta Ophthalmol. 1971;49:427–440. doi: 10.1111/j.1755-3768.1971.tb00968.x. [DOI] [PubMed] [Google Scholar]
- 12.Lin LL, Shih YF, Tsai CB, Chen CJ, Lee LA, Hung PT, Hou PK. Epidemiologic study of ocular refraction among schoolchildren in Taiwan in 1995. Optom Vis Sci. 1999;76:275–281. doi: 10.1097/00006324-199905000-00013. [DOI] [PubMed] [Google Scholar]
- 13.Sorsby A, Benjamin B, Davey JB, Sheridan M, Tanner JM. Medical Research Council, Special Report Series No. 293. London: Her Majesty's Stationery Office; 1957. Emmetropia and its Aberrations. [PubMed] [Google Scholar]
- 14.Garner LF, Yap M, Scott R. Crystalline lens power in myopia. Optom Vis Sci. 1992;69:863–865. doi: 10.1097/00006324-199211000-00005. [DOI] [PubMed] [Google Scholar]
- 15.Scott R, Grosvenor T. Structural model for emmetropic and myopic eyes. Ophthalmic Physiol Opt. 1993;13:41–47. doi: 10.1111/j.1475-1313.1993.tb00424.x. [DOI] [PubMed] [Google Scholar]
- 16.McBrien NA, Adams DW. A longitudinal investigation of adult-onset and adult-progression of myopia in an occupational group. Refractive and biometric findings. Invest Ophthalmol Vis Sci. 1997;38:321–333. [PubMed] [Google Scholar]
- 17.Shih YF, Chiang TH, Lin LL. Lens thickness changes among schoolchildren in Taiwan. Invest Ophthalmol Vis Sci. 2009;50:2637–2644. doi: 10.1167/iovs.08-3090. [DOI] [PubMed] [Google Scholar]
- 18.Garner LF, Stewart AW, Owens H, Kinnear RF, Frith MJ. The Nepal Longitudinal Study: biometric characteristics of developing eyes. Optom Vis Sci. 2006;83:274–280. doi: 10.1097/01.opx.0000215251.27409.16. [DOI] [PubMed] [Google Scholar]
- 19.Goss DA, Jackson TW. Clinical findings before the onset of myopia in youth. I. Ocular optical components. Optom Vis Sci. 1995;72:870–878. doi: 10.1097/00006324-199512000-00005. [DOI] [PubMed] [Google Scholar]
- 20.Jones LA, Mitchell GL, Zadnik K The CLEERE Study Group. Agreement between parent-reported and clinician-assessed race in the CLEERE Study. Control Clin Trials. 2001;22:98S. [Google Scholar]
- 21.Seddon JM, Sahagian CR, Glynn RJ, Sperduto RD, Gragoudas ES. Evaluation of an iris color classification system. The Eye Disorders Case-Control Study Group. Invest Ophthalmol Vis Sci. 1990;31:1592–1598. [PubMed] [Google Scholar]
- 22.Kleinstein RN, Mutti DO, Manny RE, Shin JA, Zadnik K. Cycloplegia in African-American children. Optom Vis Sci. 1999;76:102–107. doi: 10.1097/00006324-199902000-00017. [DOI] [PubMed] [Google Scholar]
- 23.Bozdogan H. Model selection and Akaike's Information Criterion (AIC): the general theory and its analytical extensions. Psychometrika. 1987;52:345–370. [Google Scholar]
- 24.van Alphen GW. On emmetropia and ametropia. Opt Acta (Lond) 1961;142 Suppl:1–92. [PubMed] [Google Scholar]
- 25.Wong TY, Foster PJ, Johnson GJ, Klein BE, Seah SK. The relationship between ocular dimensions and refraction with adult stature: the Tanjong Pagar Survey. Invest Ophthalmol Vis Sci. 2001;42:1237–1242. [PubMed] [Google Scholar]
- 26.Olsen T, Arnarsson A, Sasaki H, Sasaki K, Jonasson F. On the ocular refractive components: the Reykjavik Eye Study. Acta Ophthalmol Scand. 2007;85:361–366. doi: 10.1111/j.1600-0420.2006.00847.x. [DOI] [PubMed] [Google Scholar]
- 27.Ip JM, Huynh SC, Kifley A, Rose KA, Morgan IG, Varma R, Mitchell P. Variation of the contribution from axial length and other oculometric parameters to refraction by age and ethnicity. Invest Ophthalmol Vis Sci. 2007;48:4846–4853. doi: 10.1167/iovs.07-0101. [DOI] [PubMed] [Google Scholar]
- 28.Garner LF, Kinnear RF, McKellar M, Klinger J, Hovander MS, Grosvenor T. Refraction and its components in Melanesian schoolchildren in Vanuatu. Am J Optom Physiol Opt. 1988;65:182–189. doi: 10.1097/00006324-198803000-00007. [DOI] [PubMed] [Google Scholar]
- 29.Goss DA, Jackson TW. Cross-sectional study of changes in the ocular components in school children. Appl Opt. 1993;32:4169–4173. doi: 10.1364/AO.32.004169. [DOI] [PubMed] [Google Scholar]
- 30.Walline JJ, Jones LA, Mutti DO, Zadnik K. A randomized trial of the effects of rigid contact lenses on myopia progression. Arch Ophthalmol. 2004;122:1760–1766. doi: 10.1001/archopht.122.12.1760. [DOI] [PubMed] [Google Scholar]
- 31.Bours J, Fodisch HJ. Human fetal lens: wet and dry weight with increasing gestational age. Ophthalmic Res. 1986;18:363–368. doi: 10.1159/000265464. [DOI] [PubMed] [Google Scholar]
- 32.Schaeffel F, Glasser A, Howland HC. Accommodation, refractive error and eye growth in chickens. Vision Res. 1988;28:639–657. doi: 10.1016/0042-6989(88)90113-7. [DOI] [PubMed] [Google Scholar]
- 33.Irving EL, Sivak JG, Callender MG. Refractive plasticity of the developing chick eye. Ophthalmic Physiol Opt. 1992;12:448–456. [PubMed] [Google Scholar]
- 34.Wildsoet C, Wallman J. Choroidal and scleral mechanisms of compensation for spectacle lenses in chicks. Vision Res. 1995;35:1175–1194. doi: 10.1016/0042-6989(94)00233-c. [DOI] [PubMed] [Google Scholar]
- 35.Smith EL, 3rd, Hung LF. The role of optical defocus in regulating refractive development in infant monkeys . Vision Res. 1999;39:1415–1435. doi: 10.1016/s0042-6989(98)00229-6. [DOI] [PubMed] [Google Scholar]
- 36.Gwiazda J, Thorn F, Held R. Accommodation, accommodative convergence, and response AC/A ratios before and at the onset of myopia in children. Optom Vis Sci. 2005;82:273–278. doi: 10.1097/01.opx.0000159363.07082.7d. [DOI] [PubMed] [Google Scholar]
- 37.Mutti DO, Mitchell GL, Hayes JR, Jones LA, Moeschberger ML, Cotter SA, Kleinstein RN, Manny RE, Twelker JD, Zadnik K. Accommodative lag before and after the onset of myopia. Invest Ophthalmol Vis Sci. 2006;47:837–846. doi: 10.1167/iovs.05-0888. [DOI] [PubMed] [Google Scholar]
- 38.Mutti DO, Hayes JR, Mitchell GL, Jones LA, Moeschberger ML, Cotter SA, Kleinstein RN, Manny RE, Twelker JD, Zadnik K. Refractive error, axial length, and relative peripheral refractive error before and after the onset of myopia. Invest Ophthalmol Vis Sci. 2007;48:2510–2519. doi: 10.1167/iovs.06-0562. [DOI] [PMC free article] [PubMed] [Google Scholar]
- 39.Mutti DO, Sinnott LT, Mitchell GL, Jones-Jordan LA, Moeschberger ML, Cotter SA, Kleinstein RN, Manny RE, Twelker JD, Zadnik K. Relative peripheral refractive error and the risk of onset and progression of myopia in children. CLEERE Study Group. Invest Ophthalmol Vis Sci. 2011;52:199–205. doi: 10.1167/iovs.09-4826. [DOI] [PMC free article] [PubMed] [Google Scholar]
- 40.Sng CC, Lin XY, Gazzard G, Chang B, Dirani M, Lim L, Selvaraj P, Ian K, Drobe B, Wong TY, Saw SM. Change in peripheral refraction over time in Singapore Chinese children. Invest Ophthalmol Vis Sci. 2011;52:7880–7887. doi: 10.1167/iovs.11-7290. [DOI] [PubMed] [Google Scholar]
- 41.Berntsen DA, Sinnott LT, Mutti DO, Zadnik K. Accommodative lag and juvenile-onset myopia progression in children wearing refractive correction. Vision Res. 2011;51:1039–1046. doi: 10.1016/j.visres.2011.02.016. [DOI] [PMC free article] [PubMed] [Google Scholar]
- 42.Cho P, Cheung SW, Edwards M. The longitudinal orthokeratology research in children (LORIC) in Hong Kong: a pilot study on refractive changes and myopic control. Curr Eye Res. 2005;30:71–80. doi: 10.1080/02713680590907256. [DOI] [PubMed] [Google Scholar]
- 43.Walline JJ, Jones LA, Sinnott LT. Corneal reshaping and myopia progression. Br J Ophthalmol. 2009;93:1181–1185. doi: 10.1136/bjo.2008.151365. [DOI] [PubMed] [Google Scholar]
- 44.Sankaridurg P, Donovan L, Varnas S, Ho A, Chen X, Martinez A, Fisher S, Lin Z, Smith EL, 3rd, Ge J, Holden B. Spectacle lenses designed to reduce progression of myopia: 12-month results. Optom Vis Sci. 2010;87:631–641. doi: 10.1097/OPX.0b013e3181ea19c7. [DOI] [PMC free article] [PubMed] [Google Scholar]
- 45.Anstice NS, Phillips JR. Effect of dual-focus soft contact lens wear on axial myopia progression in children. Ophthalmology. 2011;118:1152–1161. doi: 10.1016/j.ophtha.2010.10.035. [DOI] [PubMed] [Google Scholar]
- 46.Wildsoet CF, Pettigrew JD. Kainic acid-induced eye enlargement in chickens: differential effects on anterior and posterior segments. Invest Ophthalmol Vis Sci. 1988;29:311–319. [PubMed] [Google Scholar]
- 47.Smith EL, 3rd, Hung LF, Huang J. Relative peripheral hyperopic defocus alters central refractive development in infant monkeys. Vision Res. 2009;49:2386–2392. doi: 10.1016/j.visres.2009.07.011. [DOI] [PMC free article] [PubMed] [Google Scholar]
- 48.Smith EL, 3rd, Kee CS, Ramamirtham R, Qiao-Grider Y, Hung LF. Peripheral vision can influence eye growth and refractive development in infant monkeys. Invest Ophthalmol Vis Sci. 2005;46:3965–3972. doi: 10.1167/iovs.05-0445. [DOI] [PMC free article] [PubMed] [Google Scholar]
- 49.Smith EL, 3rd, Ramamirtham R, Qiao-Grider Y, Hung LF, Huang J, Kee CS, Coats D, Paysse E. Effects of foveal ablation on emmetropization and form-deprivation myopia. Invest Ophthalmol Vis Sci. 2007;48:3914–3922. doi: 10.1167/iovs.06-1264. [DOI] [PMC free article] [PubMed] [Google Scholar]
- 50.Atchison DA, Jones CE, Schmid KL, Pritchard N, Pope JM, Strugnell WE, Riley RA. Eye shape in emmetropia and myopia. Invest Ophthalmol Vis Sci. 2004;45:3380–3386. doi: 10.1167/iovs.04-0292. [DOI] [PubMed] [Google Scholar]
- 51.Lim LS, Yang X, Gazzard G, Lin X, Sng C, Saw SM, Qiu A. Variations in eye volume, surface area, and shape with refractive error in young children by magnetic resonance imaging analysis. Invest Ophthalmol Vis Sci. 2011;52 doi: 10.1167/iovs.11-7269. e-pub. [DOI] [PubMed] [Google Scholar]
- 52.Fischer AJ, Reh TA. Identification of a proliferating marginal zone of retinal progenitors in postnatal chickens. Dev Biol. 2000;220:197–210. doi: 10.1006/dbio.2000.9640. [DOI] [PubMed] [Google Scholar]
- 53.Tkatchenko AV, Walsh PA, Tkatchenko TV, Gustincich S, Raviola E. Form deprivation modulates retinal neurogenesis in primate experimental myopia. Proc Natl Acad Sci U S A. 2006;103:4681–4686. doi: 10.1073/pnas.0600589103. [DOI] [PMC free article] [PubMed] [Google Scholar]
- 54.Manns F, Parel JM, Denham D, Billotte C, Ziebarth N, Borja D, Fernandez V, Aly M, Arrieta E, Ho A, Holden B. Optomechanical response of human and monkey lenses in a lens stretcher. Invest Ophthalmol Vis Sci. 2007;48:3260–3268. doi: 10.1167/iovs.06-1376. [DOI] [PMC free article] [PubMed] [Google Scholar]
- 55.Schultz KE, Sinnott LT, Mutti DO, Bailey MD. Accommodative fluctuations, lens tension, and ciliary body thickness in children. Optom Vis Sci. 2009;86:677–684. doi: 10.1097/OPX.0b013e3181a7b3ce. [DOI] [PMC free article] [PubMed] [Google Scholar]
- 56.Day M, Strang NC, Seidel D, Gray LS, Mallen EA. Refractive group differences in accommodation microfluctuations with changing accommodation stimulus. Ophthalmic Physiol Opt. 2006;26:88–96. doi: 10.1111/j.1475-1313.2005.00347.x. [DOI] [PubMed] [Google Scholar]
- 57.Sheppard AL, Davies LN. In vivo analysis of ciliary muscle morphologic changes with accommodation and axial ametropia. Invest Ophthalmol Vis Sci. 2010;51:6882–6889. doi: 10.1167/iovs.10-5787. [DOI] [PubMed] [Google Scholar]
- 58.Bailey MD, Sinnott LT, Mutti DO. Ciliary body thickness and refractive error in children. Invest Ophthalmol Vis Sci. 2008;49:4353–4360. doi: 10.1167/iovs.08-2008. [DOI] [PMC free article] [PubMed] [Google Scholar]
- 59.Gwiazda J, Grice K, Thorn F. Response AC/A ratios are elevated in myopic children. Ophthalmic Physiol Opt. 1999;19:173–179. doi: 10.1046/j.1475-1313.1999.00437.x. [DOI] [PubMed] [Google Scholar]
- 60.Mutti DO, Jones LA, Moeschberger ML, Zadnik K. AC/A ratio, age, and refractive error in children. Invest Ophthalmol Vis Sci. 2000;41:2469–2478. [PubMed] [Google Scholar]


