

Abstract
We describe the new Pathways plugin for the molecular visualization program VMD. The plugin identifies and visualizes tunneling pathways and pathway families in biomolecules and calculates relative electronic couplings. The plugin includes unique features to estimate the importance of individual atoms for mediating the coupling, to analyze the coupling sensitivity to thermal motion, and to visualize pathway fluctuations. The Pathways plugin is open source software distributed under the terms of the GNU public license.
Keywords: Bioenergetics, electron transfer, redox proteins, tunneling pathways, VMD
1 Introduction
Biological electron-transfer (ET) reactions are essential for the conversion of energy from food or sunlight into the universal energy currency, adenosine triphosphate (ATP) [1–4]. ET is performed within and between molecules, where tunneling may be mediated in part by water [1, 2]. ET may also be coupled to proton or other ion transfer processes, or may be gated by conformational change [5–7]. Because of relatively large donor-to-acceptor distances (5 – 25 Å), these reactions typically occur in the weak coupling (or non-adiabatic) limit, where tunneling is mediated by virtual electronic states of the intervening medium (the bridge), and the reaction rates are described by Fermi’s golden rule (high-temperature limit) [8]
| (1) |
where ΔG is the reaction free energy, λ is the reorganization energy, and TDA is the electronic donor-to-acceptor tunneling coupling mediated by the intervening molecule(s). We focus on the electronic coupling TDA that depends on the structure of the medium between the donor and the acceptor.
Biological ET reaction rates are known to decrease approximately exponentially with tunneling distance, with the exponential factor specific to the tunneling medium structure [9, 10]. While proteins present lower barriers than water, and water is a better mediator than empty space, the exponential decay factors for different proteins are substantially different [9, 10]. The origins in 3D structures of these electronic coupling differences were first addressed by the Pathways model [11]. This models is based on the fact that the energy barrier for tunneling through covalent bonds is lower than for tunneling through hydrogen bonds, and the latter barrier is lower than for tunneling through vacuum [11, 12]. As such, the Pathways model treats tunneling propagation as a sequence of steps, each of which is mediated by a covalent bond, a hydrogen bond, or vacuum, and the electronic coupling is proportional to a product of penalties for each step:
| (2) |
The Pathways strategy uses graph theory to search for the sequence of steps that maximizes the product in eq. (2). In most parameterizations, the penalty for a covalent bond-mediated step εC = 0.6 is based on experiments of Closs and Miller [13], the penalty for a through-space jump is εS = εC exp[−βS (RS − 1.4)], where RS is the jump distance in Å, and the penalty for a hydrogen bond-mediated step is εH = (εC)2 exp[−βS (RH − 2.8)], where RH is the hydrogen bond length (heavy atom to heavy atom) in Å [11]. Early estimates of the decay factor for empty space βS = 1.7 Å−1 were later reduced to 1.1 Å−1 to reflect typical 5 eV binding energies of redox cofactors [14]. With this parameterization, the Pathways model has successfully described ET reactions in many redox proteins [3, 9–11].
Despite its simplicity, the Pathways model is broadly used to identify coupling pathways and to estimate electronic coupling interactions. Although semi-empirical [15,16] and ab initio [17,18] quantum chemistry methods may yield more accurate result when proper ensemble averaging is included, the Pathways model-based calculations are several orders of magnitude faster and provide an approach for identifying mediating residues and for estimating relative coupling interactions in large and complex biomolecular systems [19–21]. An example of how such calculations may remarkably well capture the electronic coupling decay with distance in the blue copper protein azurin is shown in Fig. 6 in review [10]. Factors that influence the accuracy of the Pathways model are discussed in more details in review [3]. In ET systems where tunneling is sensitive to thermal motion, the coupling that enters eq. (1) is the mean squared coupling. Indeed, early studies indicated that interactions computed with Pathways and multi-path methods depended strongly on geometry because of fluctuations in through-space interaction strengths [16, 19, 22]. Recent studies of water-mediated coupling support this notion [20, 21, 23]. Structural fluctuations in biomolecular systems, including dynamics of transient water molecules that may mediate strong electron transfer pathways [23, 24], are often sampled by all-atom classical molecular dynamics simulations. Currently available software is not capable of performing Pathways calculations along molecular dynamics trajectories without substantial modifications. As such, the development of software to compute and to analyze pathway fluctuations is timely, as we expand our understanding of biological ET reactions to regimes where protein dynamics plays a central role. The Pathways plugin for the molecular analysis and visualization program VMD [25] was developed to provide these capabilities.
2 Implementation
As shown in Fig. 1, the Pathways plugin includes Tcl scripts pkgIndex.tcl and pathways.tcl as well as a binary executable pathcore. pkgIndex.tcl is a standard component of Tcl packages that informs the Tcl interpreter built into VMD about the existence and location of the Pathways plugin1. pathways.tcl implements key functionality of the plugin: analyzing the loaded molecular structure, preparing data for graph searches, analyzing graph search results, visualizing the pathways, animating the pathway dynamics, and calculating statistical descriptors of the electronic coupling fluctuations. This script includes two key functions, pathways, which implements pathway analysis for a single biomolecular conformation, and pathtraj, a wrapper for analyzing pathway dynamics over a molecular dynamics simulation trajectory that calls pathways for each trajectory frame. In addition, this script includes functions addbond, delbond, and setseg that control the list of covalent bonds, brief embedded help for all user-accessible functions, and numerous auxiliary functions used by pathways and pathtraj internally. Program pathcore performs graph search using data generated by script pathways.tcl and returns the results to the script. Its code, which is essentially based on Yan Qi’s K-shortest path code2, is written in C++ and linked to Boost libraries3 that provide the Dijkstra strongest pathway search algorithm [26].
Figure 1.

Implementation of the Pathways plugin. Script pkgIndex.tcl provides integration of the Pathways plugin with VMD. Script pathways.tcl is the key component of the plugin that provides all its functionality except graph search. The latter task is performed by program pathcore, which is available for several popular platforms as a statically compiled binary executable. For other platforms, it has to be compiled from source code (provided as a compressed archive pathcore.tgz) and linked to Boost libraries.
The Pathways plugin is controlled by commands entered in the VMD command line interfaces, i.e., the VMD console or the Tk console that provides additional command history and editing capabilities. The plugin output is printed in the same console. The plugin queries VMD to identify whether it runs in the graphics mode or in the text-only mode. In the graphics mode, the plugin visualizes identified pathways and may render 24-bit images using one of the VMD-compatible renderers. For molecular dynamics trajectories, the plugin calculates and renders pathways for each trajectory frame, and may convert the images into MPEG2 video using the open-source utilities convert from Image Magick4,5 and ffmpeg from FFmpeg6,7. The plugin can also be run in a non-interactive mode, reading commands from a script file and writing its output into a log file.
Like any other Tcl plugin, Pathways needs to be loaded into VMD before using. Loading is performed by using the standard Tcl command package require pathways. Since the plugin receives hydrogen-bond information from VMD, hydrogen atoms need to be added to the Protein Data Bank (PDB) files8 [27]. The plugin also receives from VMD covalent-bond information, which VMD obtains from a molecular structure file (e.g., a PSF file), if one was loaded. Otherwise, VMD attempts to identify covalent bonds using atom types and interatomic distances. Since such an identification of bonds is only reliable for common biological structures (proteins, nucleic acids, and lipids), and not for many cofactors, the Pathways plugin provides commands that add or delete covalent bonds and set segment IDs in the loaded molecule as needed. The scope of these commands is limited to the Pathways plugin, and they do not alter the covalent bond information that VMD generates or reads from a structure file.
3 Capabilities
The Pathways plugin allows exploration of how the tunneling medium structure and dynamics influence the mean squared electronic coupling. The plugin includes the following capabilities:
Identify, visualize, and animate dominant ET pathways, and estimate relative electronic couplings mediated by each pathway.
Estimate the importance of individual atoms to ET pathways and visualize relevant atoms.
Analyze the statistics of electronic coupling fluctuations over a molecular dynamics trajectory.
The Pathways plugin accepts parameters for the ET-mediating molecules, Pathways model parameters, output parameters, and graphics parameters. Only two parameters are required: atom selection strings for the electron donor and acceptor atoms. Other parameters are pre-set to default values but can be readily changed. When starting pathways calculations, the plugin prints out the parameters as follows:
PATHWAYS) Starting pathway calculations:

 MOLECULE:
 Molecule:                ionized.psf
 Trajectory frame:        0
 Donor selection:         name CU
 Acceptor selection:      name RU
 Bridge selection:        protein or resname RBU
 Number of pathways:      100
 Atom importance:         0
 Environment size:        4.0
 Collective D/A:          1

 PATHWAYS:
 Include hydrogens:       0
 H-bond cutoff:           3.0 A
 H-bond angle:            30 deg.
 TS jump cutoff:          6.0 A
 Protein pruning:         7.0 A
 Epsilon_C:               0.6
 Epsilon_H:               0.36
 Exp. H-bond:             1.7
 Offset H-bond:           2.8 A
 Epsilon TS:              0.6
 Exp. TS jump:            1.7
 Offset TS jump:          1.4 A

 OUTPUT:
 Output prefix:           testrun
 Debugging mode on:       1

 GRAPHICS:
 Max. pathway radius:     0.5
 Pathway resolution:      30
 Pathway material:        Opaque
 Renderer:                TachyonInternal
In the graphics mode, calculated pathways are displayed as shown in Fig. 2. Each pathway is represented by a sequence of solid cylinders (covalent bond-mediated steps) and dashed cylinders (hydrogen bonds and through-space steps). The cylinder diameters indicate the pathway’s strength. In addition, pathways are color-coded by strength using the repeating sequence of red, orange, yellow, green, cyan, blue, and magenta. For clarity, visual representations of all loaded molecules are preserved, and the calculated pathways are shown as a new loaded molecule. In the graphics mode as well as in the text mode, pathways, ordered by strength, are printed in the following format (output truncated):
PATHWAYS) Found 100 pathway(s)
PATHWAYS) Sorted 100 pathway(s): max coupling 2.43041e-05
PATHWAYS) ELECTRON TRANSFER PATHWAYS:

PATH 1: net decay 2.43041e-05
 1005  CU  CU    129  CU   -->   339   A    GLY   45   O    :  CB   3.00   3.00
 339   A   GLY   45   O    -->   338   A    GLY   45   C    :  CB   1.22   4.22
 338   A   GLY   45   C    -->   347   A    HSP   35   N    :  CB   1.32   5.54
 346   A   HSP   46   N    -->   658   A    ILE   87   O    :  HB   2.87   8.41
 658   A   ILE   87   O    -->   657   A    ILE   87   C    :  CB   1.23   9.65
 657   A   ILE   87   C    -->   652   A    ILE   87   CA   :  CB   1.54   11.19
 652   A   ILE   87   CA   -->   651   A    ILE   87   N    :  CB   1.46   12.64
 651   A   ILE   87   N    -->   649   A    LEU   86   C    :  CB   1.32   13.97
 649   A   LEU   86   C    -->   644   A    LEU   86   CA   :  CB   1,52   15.48
 644   A   LEU   86   CA   -->   643   A    LEU   86   N    :  CB   1.47   16.95
 643   A   LEU   86   N    -->   641   A    LYS   85   C    :  CB   1.33   18.28
 641   A   LYS   85   C    -->   635   A    LYS   85   CA   :  CB   1.53   19.81
 635   A   LYS   85   CA   -->   634   A    LYS   85   N    :  CB   1.46   21.26
 634   A   LYS   85   N    -->   632   A    THR   84   C    :  CB   1.33   22.59
 632   A   THR   84   C    -->   633   A    THR   84   O    :  CB   1.23   23.82
 633   A   THR   84   O    -->   623   A    HSP   83   ND1  :  HB   2.67   26.48
 623   A   HSP   83   ND1  -->   624   A    HSP   83   CE1  :  CB   1.32   27.81
 624   A   HSP   83   CE1  -->   617   A    HSP   83   NE2  :  CB   1.32   29.13
 617   A   HSP   83   NE2  -->   975   RBU  RBU   130  RU   :  CB   2.11   31.24

PATH 2: net decay 1.45824e-05
 1005  CU  CU    129  CU   -->   339   A    GLY   45   O    :  CB   3.00   3.00
Figure 2.
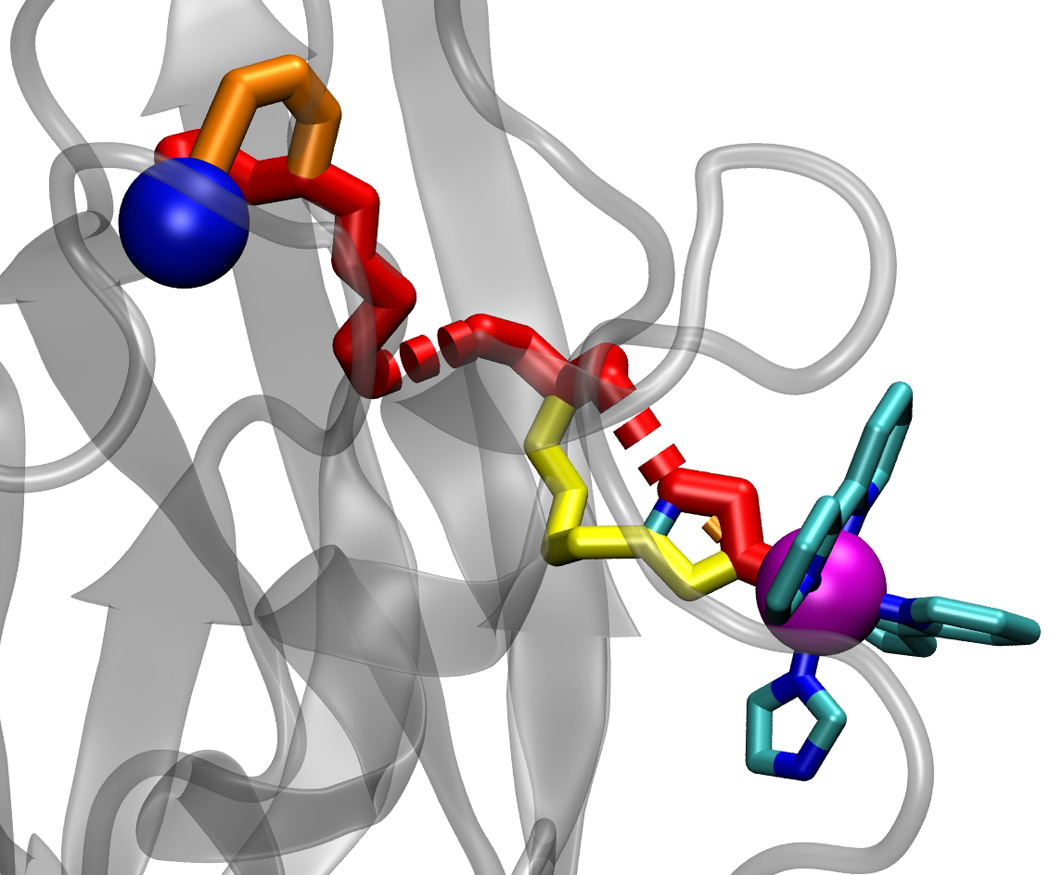
The 10 strongest pathways calculated for ruthenated wild-type azurin (PDB code 1BEX) [10] using standard Pathways parameters (εC = 0.6, βS = 1.7 Å−1). Blue and magenta spheres indicate copper and ruthenium ions, respectively. Solid cylinders indicate pathway steps mediated by covalent bonds, and dashed cylinders indicate pathway steps mediated by hydrogen bonds or through-space jumps. Cylinder diameters indicate the pathway strengths.
The columns on either side of the arrows show amino acid number, chain, amino acid name, atom number, and atom name for the initial and the final atom in each step along the pathway. The last three columns show the step type (CB for covalent bonds, HB for hydrogen bonds, and TS for through-space jumps), step distance, and the running distance along the pathway from the donor to the end of the current step, respectively.
Some single-point mutations may dramatically alter ET reactions in redox proteins [9,10], and Pathways model-based calculations have successfully captured the influence of individual protein atoms on the electronic coupling in many redox proteins [3, 9–11]. As such, the Pathways plugin includes capabilities for estimating the importance of individual atoms for mediating the electronic coupling. The importance of the i-th atom is defined as Ii = TDiTiA/TDA, where TDi or TiA are pathway couplings between the i-th atom and the donor or the acceptor, respectively, and TDA is the strongest donor-to-acceptor pathway coupling. Atom importance I can vary from 0 (for atoms not involved in mediating the electronic coupling) to 1 (for atoms on the strongest path). Fig. 3 shows atom importance values near the strongest pathway in ruthenium-modified wild-type azurin [9, 10]. Atom importance values can be indicated by radius (default) or color-coded from red to blue, as shown in Fig. 3. Atoms with importance values less than 1 are those that mediate secondary pathways (see Fig. 2). As such, atom importance values provide a method of describing electron transfer mediating elements in proteins, and these values may be viewed along molecular dynamics trajectories.
Figure 3.
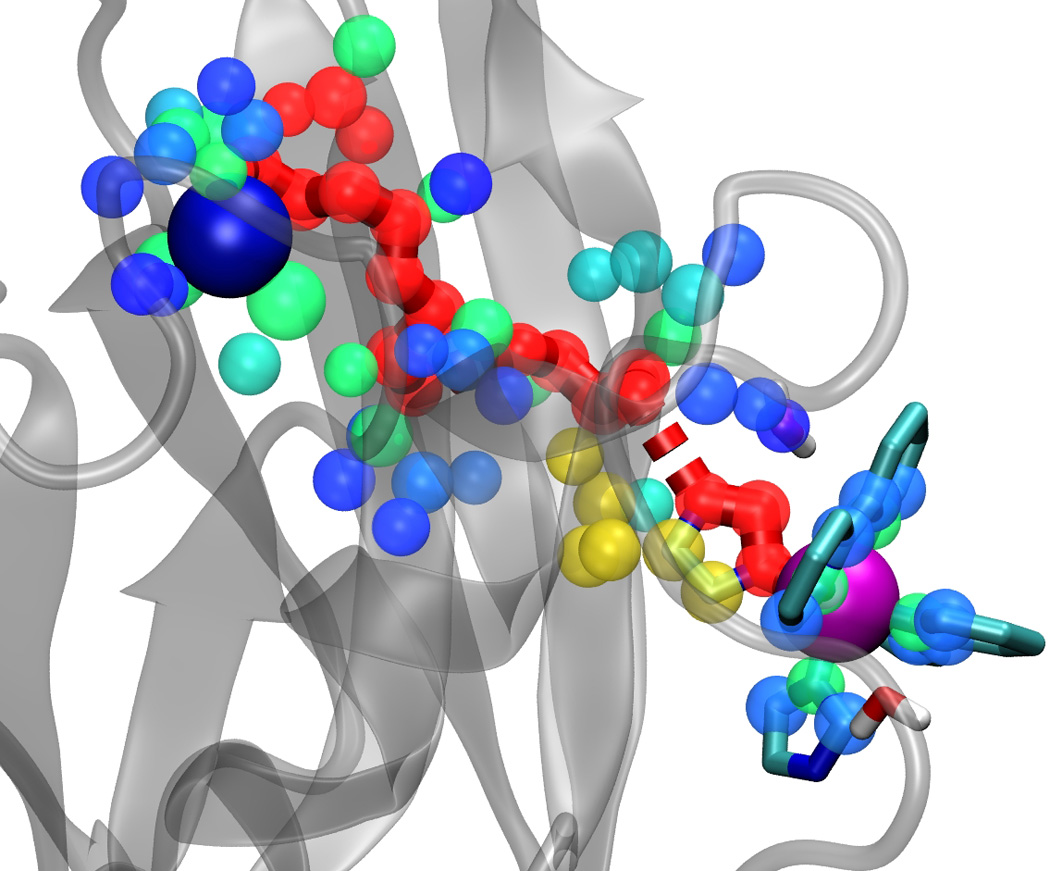
The importance Ii of atoms surrounding (within 4 Å of) the strongest path for mediating the electronic coupling in ruthenated wild-type azurin (PDB code 1BEX) [10]. Atoms are shown as spheres, and their importance is color-coded from red (highest importance, Ii ~ 1) to blue (lowest importance, Ii ≪ 1).
To perform pathway calculations for multiple frames of a molecular dynamics trajectory, Pathways uses a built-in wrapper that accepts all the above arguments as well as additional optional arguments for the first frame, the last frame, and the increment between frames. An example 300-ps animation of the first 10 pathways in ruthenated wild type azurin (PDB code 1BEX [28]) is available on the web9. In addition to calculating pathways and estimating relative electronic couplings for the specified frames, Pathways also calculates the statistical characteristics of coupling fluctuations: the average pathway coupling, the standard deviation of the pathway coupling, the mean squared pathway coupling, and a pathway coherence-like parameter CP that quantifies the extent of the electronic coupling fluctuations
| (3) |
The parameter CP is related to the coherence parameter C introduced earlier [15]. CP describes the sensitivity of the pathway coupling to thermal atomic motion. We refer to it as CP because the Pathways model does not explicitly include effects of multiple coupling pathway interference. As in [15], values of CP vary between 0 and 1. Values close to 1 indicate that the strongest pathway is weakly sensitive to thermal motion, while values close to 0 indicate strong coupling dependence on conformation. Statistical characteristics calculated for the above trajectory are:
PATHTRAJ)   Created the movie
PATHTRAJ)   PATHWAY COUPLING STATISTICS:
PATHTRAJ)   <T_DA>:                        1.5952911063122922e-5
PATHTRAJ)   sigma (T_DA):                  1.1210076963218966e-5
PATHTRAJ)   <T_DA^2>                       3.8016119690920234e-10
PATHTRAJ)   "Coherence"                    0.6694406832075852
Recent examples of the key role that pathway dynamics can play include water-mediated ET studies [3, 20, 21, 23, 24].
4 Availability
The Pathways plugin and its User’s Guide are freely available from the Pathways web page at Duke University10. They are distributed under the terms of the GNU General Public License version 3 or later11. The User’s Guide includes a brief introduction of the Pathways model, installation instructions, usage tips, and a description of Pathways parameters. In addition, a complete parameter reference is built into in the plugin itself.
The Pathways plugin was created by Ilya Balabin (project design and management, integration with VMD, user interfaces, graphics, animation), Xiangqian Hu (graph search wrapper), and David Beratan (overall guidance and development of the Pathways theory).
Acknowledgments
This work was funded by the NIH (grant GM-048043). We thank J. N. Betts, J. J. Regan, and J. N. Onuchic for contributions to the Pathways model and earlier code. IAB also thanks John Stone and Klaus Schulten for valuable comments and suggestions.
Footnotes
http://www.imagemagick.org (for UNIX/Linux)
http://imagemagick.sourceforge.net/http/www/windows.html (for Windows)
http://ffmpeg.org (for UNIX/Linux)
http://ffmpeg.zeranoe.com/ (for Windows)
References
- 1.Berg J, Tymoczko J, Stryer L. Biochemistry. 6th ed. New York, NY: W. H. Freeman and Company; 2008. [Google Scholar]
- 2.Balabin IA, Skourtis SS, Beratan DN. Wiley Encyclopedia of Chemical Biology. Wiley-VCH Verlag GmbH; 2008. chapter Chemical roles of water in electron transfer. [Google Scholar]
- 3.Beratan DN, Skourtis SS, Balabin IA, Balaeff A, Keinan S, Venkatramani R, Xiao D. Acc. Chem. Res. 2009;42:1669–1678. doi: 10.1021/ar900123t. [DOI] [PMC free article] [PubMed] [Google Scholar]
- 4.Skourtis SS, Waldeck DH, Beratan DN. Ann. Rev. Phys. Chem. 2010;61:461–485. doi: 10.1146/annurev.physchem.012809.103436. [DOI] [PMC free article] [PubMed] [Google Scholar]
- 5.Hammes-Schiffer S. Acc. Chem. Res. 2001;34:273–282. doi: 10.1021/ar9901117. [DOI] [PubMed] [Google Scholar]
- 6.Weil JA, Bolton JR, Wertz JE. Electron paramagnetic resonance: elementary theory and practical applications. John Wiley and Sons; 1994. [Google Scholar]
- 7.Davidson VI. Acc. Chem. Res. 2008;41:730–738. doi: 10.1021/ar700252c. [DOI] [PMC free article] [PubMed] [Google Scholar]
- 8.Marcus RA, Sutin N. Biochim. Biophys. Acta. 1985;811:265–322. [Google Scholar]
- 9.Gray HB, Winkler JR. Biochim. Biophys. Acta Biomembr. 2010;1797:1563–1572. doi: 10.1016/j.bbabio.2010.05.001. [DOI] [PubMed] [Google Scholar]
- 10.Gray HB, Winkler JR. Q. Rev. Biophys. 2003;36:341–372. doi: 10.1017/s0033583503003913. [DOI] [PubMed] [Google Scholar]
- 11.Beratan DN, Betts JN, Onuchic JN. Science. 1991;252:1285–1288. doi: 10.1126/science.1656523. [DOI] [PubMed] [Google Scholar]
- 12.Betts JN, Beratan DN, Onuchic JN. J. Am. Chem. Soc. 1992;114:4043–4046. [Google Scholar]
- 13.Closs GL, Miller JR. Science. 1988;240:440–447. doi: 10.1126/science.240.4851.440. [DOI] [PubMed] [Google Scholar]
- 14.Jones ML, Kurnikov IV, Beratan DN. J. Phys. Chem. A. 2002;106:2002–2006. [Google Scholar]
- 15.Balabin IA, Onuchic JN. Science. 2000;290:114–117. doi: 10.1126/science.290.5489.114. [DOI] [PubMed] [Google Scholar]
- 16.Skourtis SS, Balabin IA, Kawatsu T, Beratan DN. Proc. Natl. Acad. Sci. USA. 2005;102:3552–3557. doi: 10.1073/pnas.0409047102. [DOI] [PMC free article] [PubMed] [Google Scholar]
- 17.Prytkova TR, Kurnikov IV, Beratan DN. Science. 2007;315:622–625. doi: 10.1126/science.1134862. [DOI] [PMC free article] [PubMed] [Google Scholar]
- 18.Gehlen JN, Daizadeh I, Stuchebrukhov AA, Marcus RA. Inorg. Chim. Acta. 1996;243:271–282. [Google Scholar]
- 19.Regan JJ, Risser SM, Beratan DN, Onuchic JN. J. Phys. Chem. 1993;97:13083–13088. [Google Scholar]
- 20.de la Lande A, Mart S, Parisel O, Moliner V. J. Am. Chem. Soc. 2007;129:11700–11707. doi: 10.1021/ja070329l. [DOI] [PubMed] [Google Scholar]
- 21.de la Lande A, Babcock NS, Rezac J, Sanders BC, Salahub DR. Proc. Natl. Acad. Sci. USA. 2010;107:11799–11804. doi: 10.1073/pnas.0914457107. [DOI] [PMC free article] [PubMed] [Google Scholar]
- 22.Wolfgang J, Risser SM, Priyadarshy S, Beratan DN. J. Phys. Chem. B. 1997;101:2987–2991. [Google Scholar]
- 23.Lin J, Balabin IA, Beratan DN. Science. 2005;310:1311–1313. doi: 10.1126/science.1118316. [DOI] [PMC free article] [PubMed] [Google Scholar]
- 24.Balabin IA, Skourtis SS, Beratan DN. Phys. Rev. Lett. 2008;101:158102. doi: 10.1103/PhysRevLett.101.158102. [DOI] [PMC free article] [PubMed] [Google Scholar]
- 25.Humphrey W, Dalke A, Schulten K. J. Mol. Graph. 1996;14:33–38. doi: 10.1016/0263-7855(96)00018-5. [DOI] [PubMed] [Google Scholar]
- 26.Dijkstra E. Numerische Mathematik. 1959;1:269–271. [Google Scholar]
- 27.Berman HM, Westbrook J, Feng Z, Gilliland G, Bhat TN, Weissig H, Shindyalov IN, Bourne PE. Nucleic Acid Res. 2000;28:235–242. doi: 10.1093/nar/28.1.235. [DOI] [PMC free article] [PubMed] [Google Scholar]
- 28.Faham S, Day MW, Connick WB, Crane BR, Di Bilio AJ, Schaefer WP, Rees DC, Gray HB. Acta Crystallogr. Sect. D. 1999;55:379–385. doi: 10.1107/s0907444998010464. [DOI] [PubMed] [Google Scholar]