

Abstract
The separation range of superficially porous particles (Fused-core®) has been extended by design of particles with 160 Å pores. These particles show superior kinetics (lower resistance to mass transfer), allowing fast separations of peptides and small proteins (molecular weights of <15,000). The high efficiency and relatively low back pressure of these 2.7 μm fused-core particles has been maintained so that separations can be performed with conventional HPLC instruments. Longer columns can be used for higher resolution of complex mixtures of peptides, such as proteolytic digests. Highly reproducible separations of peptides at elevated temperatures with low pH mobile phases are maintained as a result of a stable bonded stationary phase. The utility of such highly stable materials is exemplified by separations of problematic amyloid peptides at low pH (TFA mobile phase) at an operational temperature of 100 °C. To address the issue of poor peptide peak shape in formic acid-containing mobile phases we show that the addition of 10-20 mM ammonium formate improves peak shape, retention and load tolerance of peptides. Use of the Fused-core particle materials for separations of synthetic peptides and tryptic digests yields peak capacities that are comparable to those obtained using columns packed with sub-2-μm particles, but with less than one-half of the operating back pressure. A peak capacity of 530 was obtained in 150 minutes on coupled columns of HALO Peptide ES-C18 with a combined length of 250 mm.
Keywords: superficially porous particles, fused-core particles, tryptic digests, peptide separations, peak capacity, amyloid peptides
1. Introduction
Columns of small superficially porous particles, also called Fused-core® and porous shell particles, recently have had significant impact on the way that small molecules are separated by HPLC. These fused-core particles with 90 Å average pore size, made commercially available in 2006, were specifically designed for separating small molecules, typically less than 2,000 molecular weight [1-6]. The popularity for columns of these particles largely is based on their comparable efficiency to that for columns of sub-2 μm particles, but at about one-half the operating pressure [2,4,7]. Columns of these superficially porous particles have received such acceptance by users that other manufacturers have now made available columns of very similar particles [8,9].
The very high efficiency of the fused-core particles is likely due to their extremely narrow particle size distribution (about 5% standard deviation) that allows highly homogeneous packed beds [2,10]. The higher density (~ 1.3 cc/g) of these superficially porous particles may also add to the ability to form efficient, uniformly packed beds.
Fused-core particles now are available that have a wider pore size that has been optimized for separating peptides [11]. These particles have the same physical dimensions as the fused-core particles for small molecules, but with a larger average pore size of 160 Å to allow the unrestricted access of molecules up to about 15, 000 molecular weight, depending on molecular conformation. We have determined that an average pore size of about 160 Å is a good compromise for separating complex mixtures of peptides and small proteins with high peak capacities. These particles also exhibit superior kinetics (reduced resistance to mass transfer) for larger molecules such as small proteins [11]. The surface area of 80 m2/g for these 2.7 μm particles is sufficient to allow the retention of the smallest peptides so that complex mixtures can be separated in a single gradient run with acceptable sample load tolerance for analytical measurements.
A variety of materials were prepared during this study, and various performance properties for separations of biological molecules have been investigated. Highly stable bonded phases used on the fused-core particles allow stable operation at elevated temperatures (up to 100 °C) with the low pH mobile phases that are commonly used for separating synthetic peptides (TFA) and for conducting LC/MS analyses on these materials (Formic Acid). The relatively low back pressure of fused-core columns allow extended column lengths for maximizing peak capacity for separating highly complex mixtures where needed.
2. Experimental
2.1 Chemicals
Synthetic peptides were obtained from AnaSpec (Freemont, CA), and proteins from Sigma-Aldrich (St. Louis, MO). Peptide retention standard consisting of 5 synthetic decapeptides [12] designated S1-S5 were used for some of the experiments on mobile phase additive effects. Mobile phases used trifluoroacetic acid and formic acid from Pierce Chemicals (Rockford, IL) and acetonitrile from EMD (Gibbstown, NJ). Details on additional peptides used in this study are shown in Table 1.
Table 1.
Peptides used for peak capacity calculations with corresponding size, pI, and sequence. pI values were calculated using Compute pI/Mw tool which can be found at http://web.expasy.org/compute_pi/
| Peptide | Molecular Weight (g/mol) | pI | Sequence |
|---|---|---|---|
| Asp-Phe | 280.28 | 3.80 | DF |
| Tyr-Tyr-Tyr | 507.54 | 5.52 | YYY |
| Angiotensin (1-7) amide | 898.00 | 6.74* | DRVYIHP-NH2 |
| Bradykinin | 1060.22 | 12.00 | RPPGFSPFR |
| Leucine enkephalin | 555.63 | 5.52 | YGGFL |
| Angiotensin II | 1046.20 | 6.74 | DRVYIHPF |
| Angiotensin 1-12 (human) | 1508.79 | 6.92 | DRVYIHPFHLVI |
| β-endorphin | 3465.10 | 9.60 | YGGFMTSEKSQTPLVTLFKNAIIKNAYKKGE |
| Sauvagine | 4599.40 | 5.15* | Pyr-GPPISIDLSLELLRKMIEIEKQEKEKQQAANNRLLLDTI-NH2 |
| Melittin | 2846.50 | 12.02 | GIGAVLKVLTTGLPALISWIKRKRQQ-NH2 |
| Hel 11-7 | 2203.00 | 10.60 | KLLKLLLKLWLKLLKLLL |
Current software does not support post translational or N-termini modifications so values reported do not take these into consideration.
2.2 Columns/Chromatographic Conditions
Fused-core particle columns of Halo C18 (90 Å average pores) and Halo Peptide ES-C18 (160 Å average pores) were obtained from Advanced Materials Technology, Inc. (Wilmington, DE). Figure 1 is a graphic of a silica fused-core particle with an overall diameter of 2.7 μm with a 1.7 μm diameter solid core and a 0.5 μm-thick porous shell of 160 Å pores, together with a summary of the physical properties for these particles. The 1.7 μm particle diameter 130 Å pore size BEH C18 column was from Waters (Milford, MA).
Figure 1.
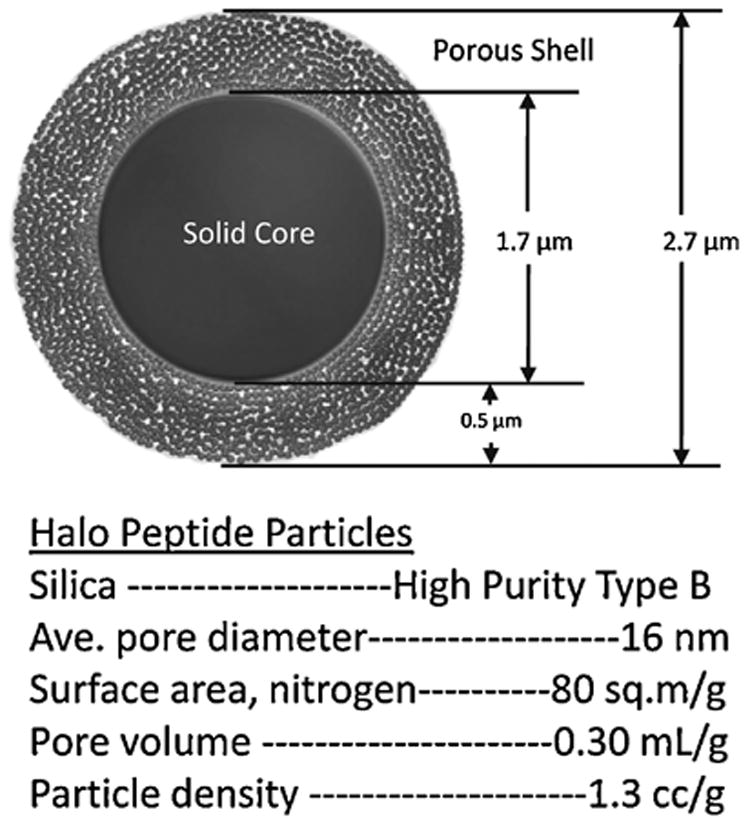
Superficially porous (fused-core) particle with 160 Å pores — Graphical representation of particle cross-section and summary of physical properties.
HPLC separations with 4.6 mm i.d. columns were conducted using an Agilent Model 1100 liquid chromatograph (Palo Alto, CA) with quaternary pump. An Agilent Model 1200 SL was used for the 2.1 mm i.d. columns. Data acquisition and instrument control used version B.03.02 ChemStation software for experiments conducted on the Agilent 1200 SL, while version B.01.03 ChemStation software was used for experiments conducted on the Agilent 1100. Column stability tests were performed with a Shimadzu Prominence UFLC XR liquid chromatograph (Tokyo, Japan). The peak widths (FWHM) and tailing factors (measured at 5% peak height) reported are averages of the values obtained for the S3 and S5 peptides.
2.3 Mass Spectrometry Conditions
Separations conducted using the 200 μm i.d columns used the Agilent Capillary 1100 LC connected to the ThermoFisher LTQ ion-trap mass spectrometer via the Michrom BioResource Advance spray source. Samples from the autoinjector were captured on the EXP Stem Trap (2.6 μL) cartridge packed with Halo Peptide ES-C18 (Optimize Technologies), using the LTQ automated valve. The examples shown are total ion current in positive ion mode, scanning from 300-2000 amu, with Automated Gain Control set to 30,000 counts.
2.4 Procedure for Preparing Tryptic Digests
Human apotransferrin tryptic digest was prepared by denaturation at 7.5 mg/mL in 6 M urea/500 mM TRIS-HCl, pH 7.6, alkylated with iodoacetamide, then diluted 10-fold into 100 mM ammonium bicarbonate, pH 8, for digestion with modified trypsin at 1/30 enzyme-to-protein by weight (Promega, Madison, WI). Equine myoglobin was rendered free of the haem group by acid-acetone precipitation, followed by dialysis against 10 mM ammonium bicarbonate. The resulting apomyoglobin was denatured, diluted and digested with modified trypsin at a 1/40 enzyme-to-protein ration. Digestions were terminated by adjusting the mixtures to 1% with respect to acetic acid, followed by storage at -25 °C.
Tryptic digest fragments were identified off-column in eluates by fraction collection, drying in the Savant rotary vacuum system (Waltham, MA), dissolved in 0.1% trifluoroacetic acid/water, then infused into a ThermoFisher LTQ FT ion-trap mass spectrometer (Dr. Ron Orlando, University of Georgia, CCRC, Athens, GA). The identities of tryptic digest fragments for apomyoglobin refer to sequences of the Asn variant of MYG_HORSE (P68082).
2.5 Chromatographic Modeling Software
Chromatographic optimizations were conducted using DryLab® 2010 from the Molnár-Institute for Applied Chromatography (Berlin, Germany). To complete the calculations, a dwell volume of 0.84 mL was used and the time constant was set to 0.5 seconds.
3. Results and Discussion
3.1 Effect of particle pore size and particle type
For optimum separations, the pore size of the column packing should be sufficiently large so that molecules can enter the porous structure without restricted diffusion [13]. This chromatographic effect is illustrated by the van Deemter plots in Figure 2 which compare separations with 90 Å and 160 Å average pore diameter fused-core particles. Data in this figure were fitted using the Knox equation (a variation of the classical van Deemter relationship),
| (1) |
where h = reduced plate height (plate height/particle diameter), v = mobile phase velocity, and A, B, C are column constants representing eddy diffusion, longitudinal mass transfer and mobile phase plus stationary phase mass transfer, respectively. In Figure 2, β-amyloid (1-38) peptide with a molecular weight of 4100 Da shows a much steeper increase in reduced plate height with increasing mobile phase velocity for the 90 Å pore column, compared to data for the 160 Å pore column. This steeper increase is the result of the greater difficulty of this peptide to enter the smaller pores of the 90 Å pore column (restricted diffusion), with this difficulty increasing with increasing mobile phase velocity. Data for the small peptide, Leu-Enk, show an even flatter increase in reduced plate height with mobile phase velocity because this is a much smaller molecule (molecular weight = 555 Da), having a larger diffusion coefficient than the larger β-amyloid molecule. The 160 Å pore column has sufficiently large pores to allow compounds as large as 15,000 molecular weight (depending on conformation) to be chromatographed without problems with restricted diffusion [11,13].
Figure 2.
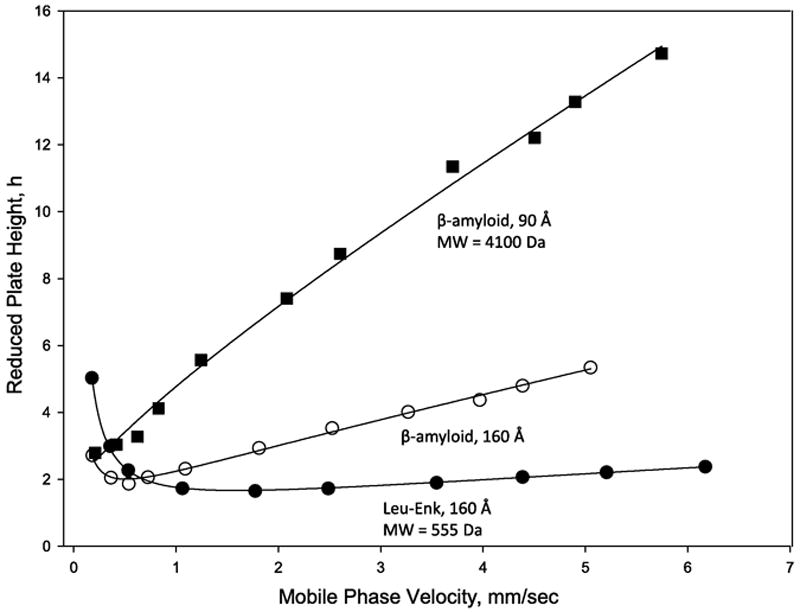
Van Deemter plots for fused-core particles with different pore sizes
Columns: 4.6 × 100 mm, Halo Peptide ES-C18 and HALO C18; Particle size 2.7 μm; Mobile phase: 0.1% trifluoroacetic acid/acetonitrile/ water; Acetonitrile content adjusted to maintain k′ = ~3; Temperature: 60 °C; Agilent Model 1100 with autosampler; β-amyloid (1-38) MW = 4100 Da; Leu-Enk = 555 Da).
3.2 Effect of increased flow rate and temperature on peptide separations
Since the resolution of peptide separations with the 160 Å fused-core columns is not strongly degraded by increasing the mobile phase velocity (see Figure 2), higher flow rates can be used to greatly shorten the separation time without a significant penalty in resolution of constituents, as also shown in Figure 3. Doubling the flow rate for this 2.1 i.d. fused-core column of 160 Å pore particles results in a halving of separation time with only a slight loss in resolution for apotransferrin tryptic digest components and only a 18.5% reduction in peak capacity. This separation was carried out at an elevated temperature (60 °C) to improve the separation. Columns of the fused-core particles with 160 Å pores have been shown to be stable at high temperature and low pH [11]. This stability is believed to be a function of the homogeneous packed bed for the column and the strong resistance of the bonded stationary phase to degradation by the low pH mobile phase even at higher temperature.
Figure 3.
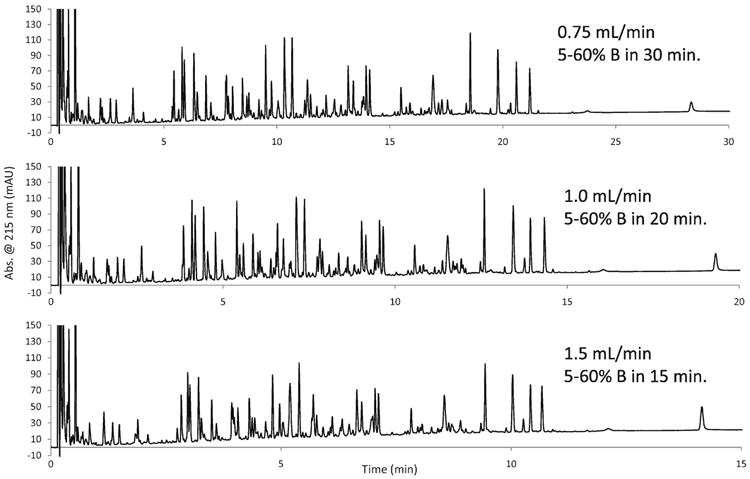
Effect of flow rate on apotransferrin tryptic digest separation
Column: 2.1 × 100 mm Halo Peptide ES-C18; Mobile phase, A: 0.1% trifluoroacetic acid/water; B: 80% acetonitrile/0.1% trifluoroacetic acid; Temperature: 60 °C; detection: UV at 215 nm; injection volume: 15 μL (15 μg).
If the stability of substituents in peptide mixtures allow, higher column temperatures should be used to improve separations [14,15]. Higher operating temperatures improve diffusion coefficients and decrease the viscosity of the mobile phase, both resulting in improved separations or the basis for faster separations. In some instances, higher temperatures are valuable in achieving better recovery of components, as illustrated in Figure 4. The separation of the β-amyloid peptides is continuously improved with an increase in column temperature, over the range of 70 to 100 °C. As shown in the figure, based on peak area estimations, relative recovery of the highly hydrophobic β-amyloid (17-42) sequence decreases at 90 °C (68% peak area), 80 °C (33%) and 70 °C (21%), compared to that at 100 °C. Over the same range, no change in relative recovery of any of the other amyloid peptides are measured, however, consistent with previous observations, (B. Boyes, unpublished data), recovery of both the (17-42) and (1-42) amyloid peptides are decreased at less than 70 °C. This pattern parallels the propensity of these amyloid peptides to form aggregates and fibrils in aqueous solutions. An efficient separation of these problematic peptides is accomplished in less than 15 minutes by the combination of elevated flow rate and temperature using the 160 Å fused-core column.
Figure 4.
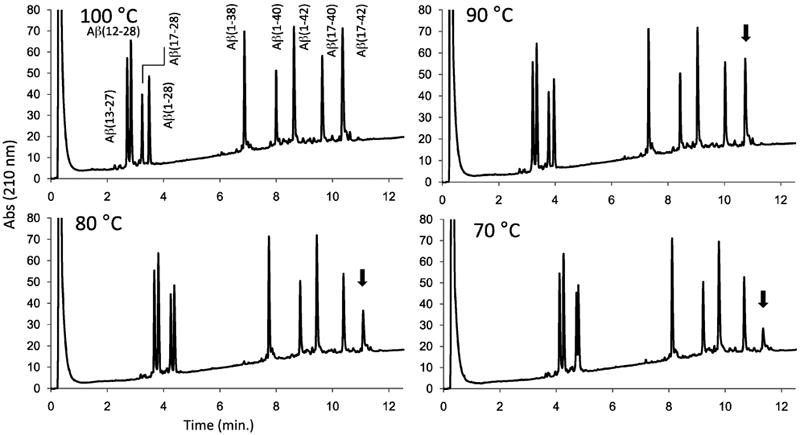
Rapid separations at high temperatures
Column: 2.1 × 50 mm Halo Peptide ES-C18; Flow rate: 0.5 mL/min; Gradient: 15-50% B in 12.5 min; A: 0.1% trifluoroacetic acid; B: 80% acetonitrile/0.1% trifluoroacetic acid; Sample: 5 μL (250 - 500 ng) β-amyloid peptides and fragments. Arrow highlights relative recovery of the β-amyloid (17-42) peptide.
3.3 Back pressure effects
Because of the relatively low back pressure of the 2.7 μm fused-core particles compared to sub-2 μm particles (about one-half), long columns can be employed to increase the resolution of complex peptide mixtures using pressures that are available with conventional HPLC instruments [2]. Coupling columns is advantageous as has been previously demonstrated with 90 Å pore size HALO columns [5,7]. Figure 5 shows the separation of apotransferrin tryptic digest using two 2.1 mm × 100 mm columns (total of 200 mm) of 160 Å pore fused-core particles. The back pressure for this separation was 476 bar, which is well below the upper limit of 600 bar for the instrument. The complex apotransferrin digest chromatogram displays more than 135 components that could reasonably be identified by LC/MS.
Figure 5.
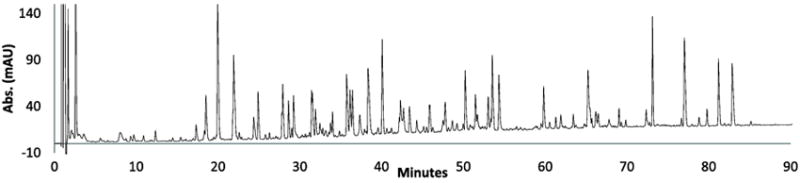
Separation of transferrin tryptic fragments using a longer column
Columns: 2 @ 2.1 × 100 mm (200 mm total) Halo Peptide ES-C18; Flow rate: 0.5mL/min.; Gradient: 5-65% B in 120 min.; 0.1% trifluoroacetic acid; B: 80% acetonitrile/0.1% trifluoroacetic acid Temperature: 45 °C; Injection volume: 15 μL (15 μg).
3.4 Mobile phase additive effects
Formic acid often is preferred over trifluoroacetic acid in mobile phases for MS analyses of peptides and protein fragments. Ionization efficiency of peptides in electrospray MS interfaces is about five-fold better with formic acid compared to trifluoroacetic acid phases, even though column efficiency and peak shapes are measurably poorer [16,17]. Nevertheless, formic acid mobile phases are widely used for many studies, and column lengths and gradient times can be easily adjusted to select conditions matching sample complexity. An example of this is illustrated in Figure 6 for the separation of apomyoglobin tryptic digests. In Figure 6A a 50 mm long column of 160 Å fused-core particles was used to rapidly separate the digest. A 15 minute gradient with formic acid mobile phase was sufficient to separate this digest with peaks suitable for MS identification studies. In Figure 6B, a much more complex digest required a 150 mm long column with an 85 minute gradient of formic acid for an appropriate separation.
Figure 6.
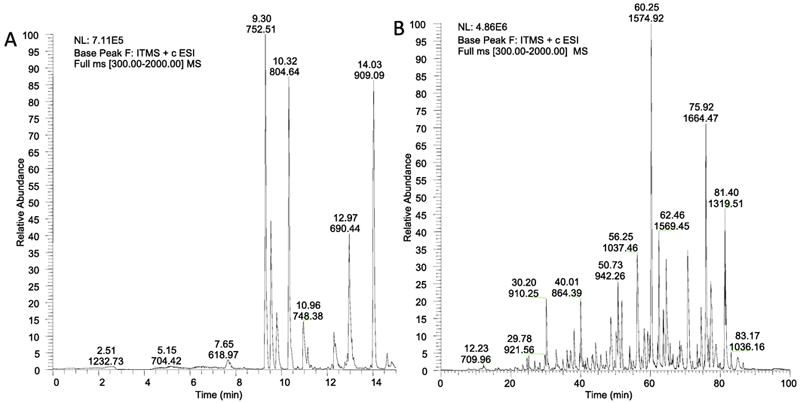
High mobile phase velocity LC/MS analysis of tryptic digests
A. Column: 0.2 × 50 mm Halo Peptide ES-C18; Flow rate; 9 μL/min; Gradient: 2 - 45% B in 15 min; A: 0.1% formic acid/water; B: acetonitrile/0.1% formic acid; Maximum pressure: 330 bar; Sample- 3 pmol apomyoglobin digest.
B. Column: 0.2 × 150 mm Halo Peptide ES-C18; Flow rate: 4 μL/min; Gradient: 2 - 45% B in 85 min; A: 0.1% formic acid/water; B: acetonitrile/0.1% formic acid; Maximum pressure: 320 bar; Sample: mixed protein digest (5 pmol total of transferrin, carbonic anhydrase, and apomyoglobin).
We have observed that peak efficiency and peak shapes for peptides can be significantly improved if a low concentration of ammonium formate is added to the formic acid mobile phase. The ammonium formate additive is volatile and does not appear to have any deleterious effect on the ionization efficiency of peptides in formic acid-containing mobile phases [18], although we do observe a shift in the ionization charge state envelope, which will be the subject of a later report. As illustrated in Figure 7, the formic acid/ammonium formate/acetonitrile mobile phase produces peaks for peptides that are comparable to those with trifluoroacetic/acetonitrile mobile phases in terms of peak efficiency and peak shape (e.g., peak widths and peak tailing). Peak properties for S1 - S5 synthetic peptides are quite similar when produced with these two mobile phases. The same peptides show broader, more tailing peaks in just 0.1% formic acid, as is typical of peptides with this mobile phase. Although the pH of the 0.1% formic acid/ammonium formate mobile phase is higher (pH 3.4-3.6) than that of 0.1% formic acid (pH 2.6-2.8), the presence of a low concentration of ammonium formate greatly improves the chromatography and appears not to adversely affect the desired ionization process for LC/MS detection. The 0.1% trifluoroacetic acid mobile phase has a pH of about 2 which results in the protonation of basic groups on peptides and acidic unreacted silanol groups on the silica support surface. The result is a favorable isotherm which results in chromatography with sharp, symmetrical peaks that are sought for the high resolution of complex mixtures. The formic acid/ammonium formate system produces similar results to trifluoroacetic acid and represents a distinct improvement over mobile phases with formic acid alone. Peptide selectivity generally is not significantly altered when ammonium formate is added to the formic acid mobile phase, as suggested in Figure 7. Peak retention and selectivity for peptides with trifluoroacetic acid mobile phases are somewhat different from that in formic acid largely because of the strong tendency for the formation of hydrophobic ion pairs with trifluoroacetic acid (pKa 0.3). The formation of ion-pairs with formic acid is much weaker, (pKa 3.8), and less effective in increasing reversed-phase retention of basic peptides.
Figure 7.
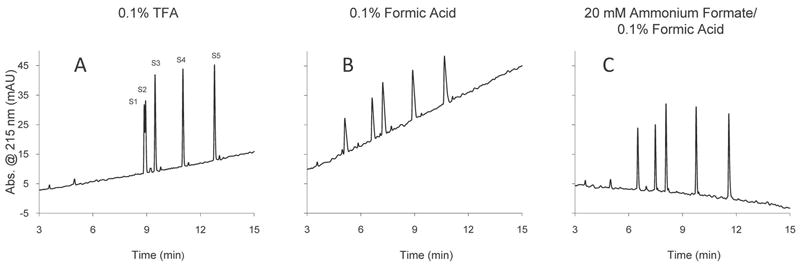
Effect of mobile phase acids on peptide separations
Column: 4.6 × 100 mm Halo Peptide ES-C18; Flow rate: 2.0 mL/min; Temperature 30 °C; UV Detection: 220 nm; Gradient: 1.5 - 26% B in 15 min; A: acid modifier/water; B: acetonitrile/0.1% trifluoroacetic acid or formic acid mixtures; Sample: 8 μL (800 ng) of synthetic peptides S1 - S5 in 0,1% TFA/water.
Our studies have shown that only 10 - 20 mM ammonium formate is required to modify the mobile phase for significantly improved peptide peak properties. Average peak widths for S3 and S5 in the separation of the synthetic mixture of S1 - S5 peptides in Figure 8 are essentially comparable for formic acid mobile phases with either 10 or 20 mM ammonium formate additive at increasing sample loads on the column. This finding is in line with the work of McCalley that demonstrated how ammonium formate buffers could be used to reduce overload [19,20]. The peak widths for ammonium formate-modified mobile phases also are comparable to those obtained with a 0.1% TFA mobile phase. The peak widths for these peptides with just formic acid are much broader and the sensitivity to sample load is much greater. The same pattern was seen for the average tailing factors versus sample load on the column, as shown in Figure 9. Again, the peptide peak shapes are similar for trifluoroacetic acid and ammonium formate modified mobile phases, while peaks with just formic acid exhibit much more tailing and show much greater sensitivity to sample load on the column.
Figure 8.
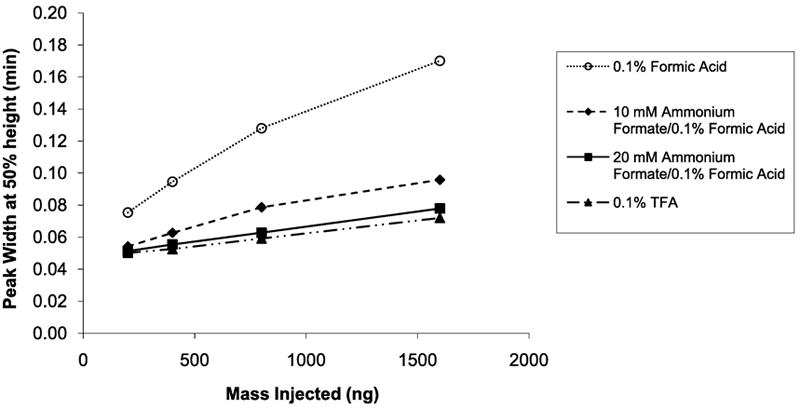
Average peak width of S3 and S5 peptides versus sample load on column. Conditions same as for Figure 7.
Figure 9.
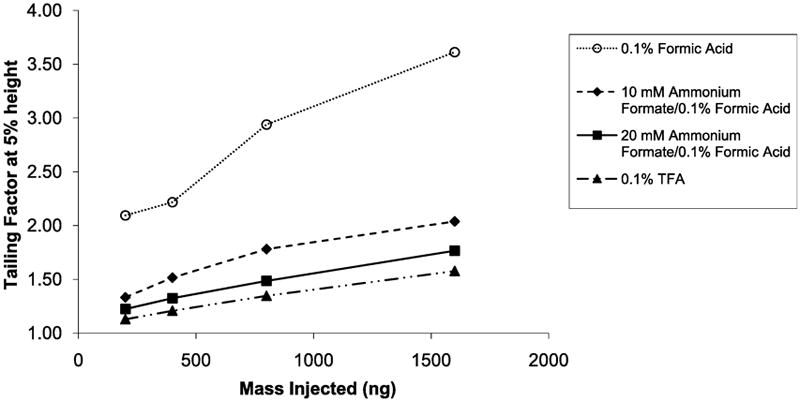
Average tailing factor for S3 and S5 peptides versus sample load on column. Conditions same as for Figure 7.
To test the theory that it is the basic side chains of the amino acid residues of peptides that cause poor peak shapes and reduced sample loading, the acetylated peptide tumor necrosis factor (TNF) receptor-associated factor-(TRAF)-binding motif was studied. The peptide has a sequence of Ac-PVQET-NH2, with both N- and C-termini blocked to yield a neutral species under the conditions tested. No increase in either peak width or tailing factor was observed as the sample load was increased from 0.2 – 3.2 μg using formic acid mobile phase without the addition of ammonium formate as shown in Figure 10.
Figure 10.
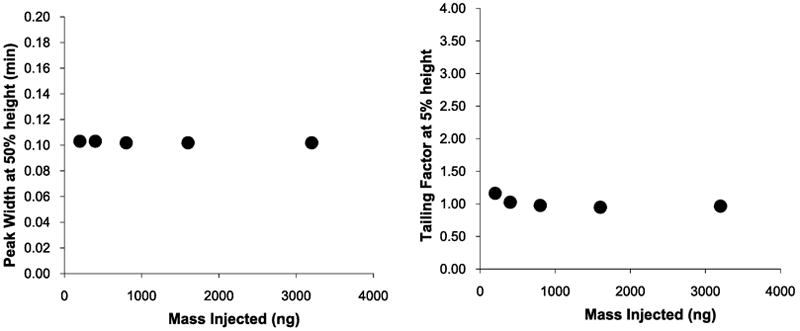
Average peak width and tailing factor for TRAF peptide. Conditions same as for Figure 7.
3.5 Peak Capacity
Peak capacity is an essential element to be optimized when conducting proteomic analyses. Wang et al. have described an optimization protocol for reversed-phase separations of peptides [21] and Zhang et al. have previously compared 90 Å pore size superficially porous particles to totally porous sub-2-μm particles [5]. The higher the peak capacity of a given separation, the more likely it is that the peaks will be resolved in a complex mixture. The following equation was used to calculate peak capacities in this work:
| (2) |
where, ti is the time for initial measurable peak in the gradient, tf is the time for final peak and W4σ is the average four-sigma width in time for the peaks in the chromatogram. Peak capacity calculations were based on the separation of 11 synthetic peptides with a wide range of hydrophobicities to simulate the fragments of a tryptic digest. The peptides used in this study were Asp-Phe, Tyr-Tyr-Tyr, angiotensin (1-7) amide, bradykinin, leucine enkephalin, angiotensin II, angiotensin 1-12 (human), β-endorphin, sauvagine, melittin, and Hel 11-7. See Table 1 for the peptides with corresponding molecular weights, pIs, and sequences. Peak capacity calculations for the HALO Peptide ES-C18 column were calculated using both melittin and Hel 11-7. In all but one case, the Hel-11-7 peptide eluted closest to the end of the gradient. This peptide did not elute before the end of the gradient under the conditions used when the separations were conducted on the BEH C18 column. Therefore comparisons made between the Halo Peptide column and the BEH column are based on peak capacities calculated using the retention time of melittin as tf. Representative chromatograms of the peptide separations can be found in Figure 11. Peak capacity conditions and values are shown in Table 2. When column length, flow rate, and temperature are held constant, but gradient time is increased, there is an increase in peak capacity as predicted by theory. The peak capacity increases from 205 to 251 to 299 with corresponding gradient times of 30, 60, and 120 minutes for a 2.1 × 100 mm Halo Peptide ES-C18 column. The same separations were conducted on a 2.1 × 100 mm BEH C18 column. The peak capacities were about 15% higher, but with more than double the back pressure. With such values for back pressure the flow rate could not be doubled for the BEH C18 column under the current instrument capabilities (600 bar maximum). However, the flow rate was doubled for the Halo Peptide ES-C18 column which resulted in a 5% increase in the calculated peak capacity going from a flow rate of 0.5 mL/min. to 1.0 mL/min.
Figure 11.
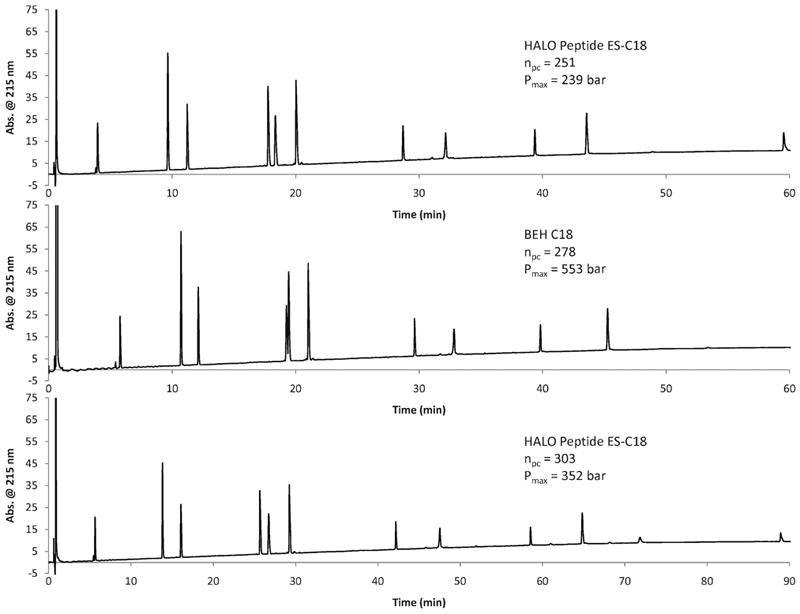
Representative chromatograms for peak capacity studies
Columns: 2.1 × 100 mm Halo Peptide ES-C18, 2.1 × 100 mm BEH C18, 2.1 × 150 mm HALO Peptide ES-C18; Flow rate: 0.5 mL/min; Temperature 45 °C; Gradient: 5 - 70% B in 60 or 90 min; A: water/0.1% trifluoroacetic acid; B: 80/20 acetonitrile/water/0.1% trifluoroacetic acid; Sample: 15 μL of 11 synthetic peptides (50 ng each).
Table 2.
Operational values for column length, flow rate, tG, and temperature, observed operating pressures, and peak capacity measurements.
| Experimental Conditions | Measured Pressure and Peak Capacity | ||||||||
|---|---|---|---|---|---|---|---|---|---|
| Column Length (mm) | Flow rate (mL/min) | tG (min.) | Temperature (°C) | HALO Peptide ES-C18 Maximum Pressure (bar) | BEH C18 Maximum Pressure (bar) | HALO Peptide ES-C18 Peak Capacity (using Melittin) | BEH C18 Peak Capacity (using Melittin) | HALO Peptide ES-C18 Peak Capacity (using Hel 11-7) | BEH C18 Peak Capacity (using Hel 11-7) |
| 100 | 0.5 | 30 | 45 | 240 | 548 | 205 | 229 | NA | NA |
| 100 | 0.5 | 60 | 45 | 239 | 553 | 251 | 278 | 344 | NA |
| 100 | 0.5 | 120 | 45 | 238 | 549 | 299 | 343 | 400 | NA |
| 100 | 1.0 | 60 | 45 | 458 | NA | 264 | NA | 352 | NA |
| 100 | 0.5 | 60 | 60 | 192 | 448 | 277 | 317 | 377 | NA |
| 150 | 0.5 | 90 | 45 | 352 | NA | 303 | NA | 412 | NA |
| 150 | 0.5 | 90 | 60 | 287 | NA | 332 | NA | 446 | NA |
To demonstrate the advantage of the HALO Peptide column, a 50% longer column (150 mm) was run at a gradient time that was 50% longer (90 minutes). Under these conditions, the peak capacity was 303 which is 9% higher than the peak capacity obtained on the BEH C18 column under equivalent conditions. A comparison of the back pressures shows that the 2.1 × 150 mm HALO Peptide column has a 57% lower back pressure than the 2.1 × 100 mm BEH C18 column. The peak capacity was further increased to 332 by raising the temperature from 45 °C to 60 °C for the HALO Peptide ES-C18 column.
3.5.1 DryLab Optimization
The HPLC method development software DryLab 2010 is a powerful tool that can be used to optimize separations. Column length, flow rate, and gradient time were the variables that were optimized in order to arrive at the values reported. Data from the 60 minute and 120 minute gradient experiments obtained on a 2.1 × 100 mm HALO Peptide ES-C18 column were used to optimize the separation of the 11 peptides. The predicted chromatogram and the experimental chromatogram are shown in Figures 12A and 12B. In order to maximize peak capacity, a 2.1 × 100 mm HALO Peptide ES-C18 column was coupled to a 2.1 × 150 mm HALO Peptide ES-C18 column (250 mm total length). A long, shallow linear gradient (5-70% B in 150 minutes) at a flow rate of 0.5 mL/min. provided a peak capacity of 530 using the retention time of Hel 11-7 as tf. Using the retention time of melittin as tf gave a peak capacity of 390. The maximum back pressure was 560 bar, which is slightly higher than the back pressure obtained under the same flow rate and temperature conditions for a BEH column that was 1.5 times shorter in length (250 cm vs. 100 cm). The experimentally obtained minimum resolution was 6.7, which compares favorably to the predicted minimum resolution of 8.1.
Figure 12.
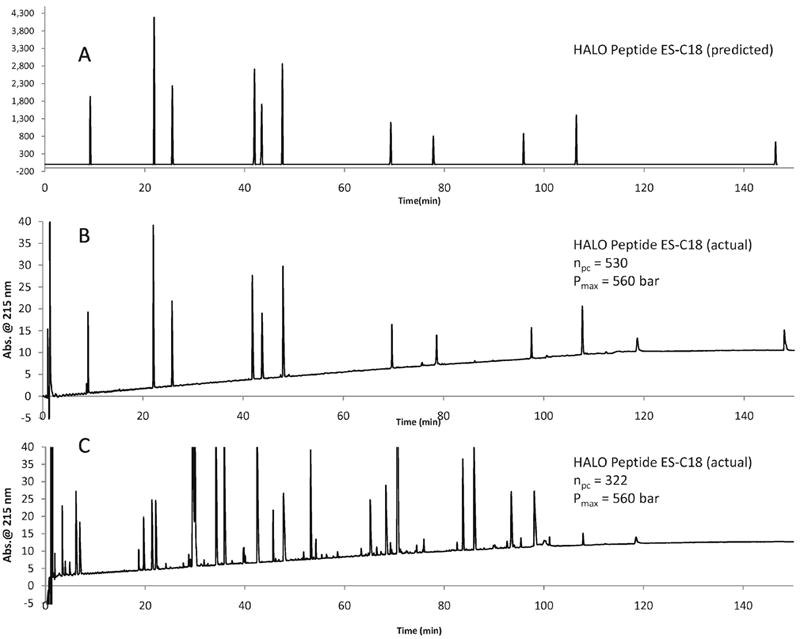
Comparison of DryLab predicted chromatogram to experimental chromatograms of synthetic peptides and a tryptic digest.
Columns: 2.1 × 100 mm Halo Peptide ES-C18 and 2.1 × 150 mm Halo Peptide ES-C18; Flow rate: 0.5 mL/min; Temperature 45 °C; Gradient: 5 - 70% B in 120 min; A: water/0.1% TFA; B: 80/20 acetonitrile/water/0.1% trifluoroacetic acid; Sample: 15 μL of 11 synthetic peptides (50 ng each), or 15 μL apomyoglobin digest (15 μg); Detection: 215 nm.
3.5.2 Comparison to Peak Capacities obtained using a Tryptic Digest
A tryptic digest of apomyoglobin was tested under the same optimized conditions that were predicted by DryLab. Offline mass spectrometry was performed on the apomyoglobin tryptic digest to ensure that peaks corresponding to monoisotopic masses were used for the average peak width calculation. In Figure 12C, the chromatogram of the apomyoglobin tryptic digest is shown. The peak capacity calculated for this separation was 322. Since the last peak in the tryptic digest is closer to the retention time of melittin, it is more appropriate to compare the obtained value of 322 to the peak capacity obtained using melittin, which is 390. The reason for the discrepancy between the values can be found in the peak widths of the tryptic digest peaks, which are 22% larger than the peak widths of the synthetic peptide peaks. The tryptic digest is a more complex sample and the likelihood of peak overlap is greater due to the higher number of similar components present in the sample.
3.5.3 Fast, High Resolution Separation of Synthetic Peptides
One of the advantages of the HALO Peptide ES-C18 2.7 μm particles is their ability to maintain high resolution at high flow rates. In Figure 13, the separation of 11 synthetic peptides is completed in less than 6 minutes with a minimum resolution of 2.9 at a flow rate of 1.25 mL/min. The calculated peak capacity using the retention time of the last eluting peak (Hel 11-7) is 172 with a back pressure of 548 bar. This separation was obtained by increasing the flow rate by 2.5 times and by implementing a binary stepped gradient (two slope segments).
Figure 13.
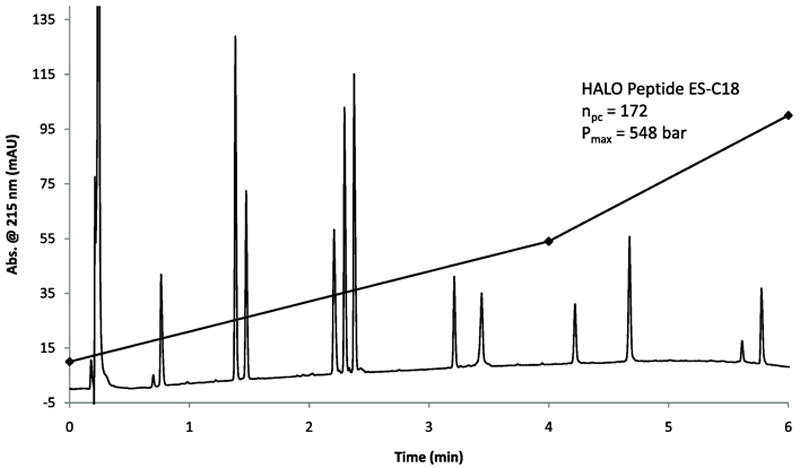
Fast separation of 11 peptides in 6 minutes with 2.9 minimum resolution. Column: 2.1 × 100 mm Halo Peptide ES-C18; Flow rate: 1.25 mL/min; Temperature 45 °C; Gradient: 10 - 54% B from 0-4 min. 54-100% B from 4-6 min; A: water/0.1% TFA; B: 80/20 acetonitrile/water/0.1% trifluoroacetic acid; Sample: 15 μL of 11 synthetic peptides, 50 ng each; Detection: 215 nm.
4.0 Conclusions
A new fused-core silica particle with 160 Å pores permits highly efficient, fast separations of peptides and polypeptides. This material provides improved separations of simple and complex mixtures of peptides and small proteins with molecular weights of <15,000, depending on molecule conformation[11]. The 160 Å average pore size of these particles shows superior kinetics (lower resistance to mass transfer) for larger molecules, compared to fused-core particles with a smaller pore size, in basic agreement with recent results of kinetic analysis for insulin by Gritti and Guiochon [22]. The relatively low back pressure of the fused-core particles allows longer columns to be used for higher resolution separations with conventional HPLC instruments. The bonded stationary phase on the 160 Å fused-core particles allows stable peptide separations at high operating temperatures which results in faster, more efficient separations. Adding ammonium formate to formic acid-containing mobile phases improves the peak shape and retention for peptide separations, particularly for peptides with basic amino acid side chains, in agreement with previous observations by McCalley [19,20]. The advantage of the 160 Å fused-core particles over particles with smaller pores is also reflected in improved peak capacities for complex mixtures of peptides and glycopeptides derived from proteolytic digests. Compared to typical peptide and tryptic digest separations that have been traditionally performed on 2.1 mm ID columns with totally porous particles at 0.2-0.3 mL/min with similar B terms of the gradient, the separations exhibited here use 0.5-0.75 mL/min without significant loss of resolution or peak capacity. These separations represent a 2 to 3 fold increase in speed over previous HPLC peptide and tryptic digest separations.
Acknowledgments
The authors thank Dr. Ron Orlando and D. J. Johnson, University of Georgia, CCRC, Athens, GA, USA for mass spectrometer identifications, and for the use of the capillary Ion Trap MS. Support of this project by the NIH (GM077688, Kirkland; GM093747, Boyes) and Integrated Technology Resource for Biomedical Glycomics (RR018502, Orlando) is gratefully acknowledged. Fused-Core and HALO are registered trademarks of Advanced Materials Technology, Inc.
References
- 1.Kirkland JJ, Langlois TJ, DeStefano JJ. Am Lab. 2007;39:18. [Google Scholar]
- 2.DeStefano JJ, Langlois TJ, Kirkland JJ. J Chromatogr Sci. 2008;46:254. doi: 10.1093/chromsci/46.3.254. [DOI] [PubMed] [Google Scholar]
- 3.Salisbury JJ. J Chromatogr Sci. 2008;46:883. doi: 10.1093/chromsci/46.10.883. [DOI] [PubMed] [Google Scholar]
- 4.Fekete S, Fekete J, Ganzler K. J Pharm Biomed Anal. 2009;49:64. doi: 10.1016/j.jpba.2008.10.009. [DOI] [PubMed] [Google Scholar]
- 5.Zhang Y, Wang X, Mukherjee P, Petersson P. J Chromatogr A. 2009;1216:4597. doi: 10.1016/j.chroma.2009.03.071. [DOI] [PubMed] [Google Scholar]
- 6.Marchetti N, Cavazzini A, Gritti F, Guiochon G. J Chromatogr A. 2007;1163:203. doi: 10.1016/j.chroma.2007.06.046. [DOI] [PubMed] [Google Scholar]
- 7.Cunliffe JM, Maloney TD. J Sep Sci. 2007;30:3104. doi: 10.1002/jssc.200700260. [DOI] [PubMed] [Google Scholar]
- 8.Gritti F, Leonardis I, Shock D, Stevenson P, Shalliker A, Guiochon G. J Chromatogr A. 2010;1217:1589. doi: 10.1016/j.chroma.2009.12.079. [DOI] [PubMed] [Google Scholar]
- 9.Agilent Technologies brochure. 2010 [Google Scholar]
- 10.Gritti F, Cavazzini A, Marchetti N, Guiochon G. J Chromatogr A. 2007;1157:289. doi: 10.1016/j.chroma.2007.05.030. [DOI] [PubMed] [Google Scholar]
- 11.Schuster SA, Wagner BM, Boyes BE, Kirkland JJ. J Chromatogr Sci. 2010;48:566. doi: 10.1093/chromsci/48.7.566. [DOI] [PubMed] [Google Scholar]
- 12.Guo D, Mant CT, Taneja AK, Parker JMR, Hodges RS. J Chromatogr. 1986;359:499. [Google Scholar]
- 13.Gritti F, Guiochon G. J Chromatogr A. 2007;1176:107. doi: 10.1016/j.chroma.2007.10.076. [DOI] [PubMed] [Google Scholar]
- 14.Chen H, Horvath C. J Chromatogr A. 1995;705:3. doi: 10.1016/0021-9673(94)01254-c. [DOI] [PubMed] [Google Scholar]
- 15.Boyes BE, Kirkland JJ. Pept Res. 1993;6:249. [PubMed] [Google Scholar]
- 16.Zhou S, Hamburger M. Rapid Commun Mass Spectrom. 1995;9:1516. [Google Scholar]
- 17.Gustavsson SA, Samskog J, Markides KE, Langstrom B. J Chromatogr A. 2001;937:41. doi: 10.1016/s0021-9673(01)01328-0. [DOI] [PubMed] [Google Scholar]
- 18.Boyes BE. Advanced Materials Technology, Inc.; Wilmington: 2010. [Google Scholar]
- 19.McCalley DV. J Chromatogr A. 2004;1038:77. doi: 10.1016/j.chroma.2004.03.038. [DOI] [PubMed] [Google Scholar]
- 20.McCalley DV. J Chromatogr A. 2011;1218:2887. doi: 10.1016/j.chroma.2011.02.068. [DOI] [PubMed] [Google Scholar]
- 21.Wang X, Stoll DW, Schellinger AP, Carr PW. Anal Chem. 2006;78:3406. doi: 10.1021/ac0600149. [DOI] [PMC free article] [PubMed] [Google Scholar]
- 22.Gritti F, Guiochon G. J Chromatogr A. 2011;1218:907. doi: 10.1016/j.chroma.2010.12.046. [DOI] [PubMed] [Google Scholar]