Abstract
Objectives
Functional Blood Oxygenation Level Dependent (BOLD) MRI is a powerful tool to assess renal function, but BOLD analysis using T2* image differentiation of cortex and medulla is laborious and prone to errors. We developed and validated an alternative compartmental analysis method to differentiate renal cortical and medullary BOLD relaxivity index, R2*. This method utilizes whole-kidney regions of interest (ROI), thus eliminating the need for anatomical cortical and medullary definition.
Materials and Methods
Nine hypertensive patients and 11 domestic pigs, some with renal artery stenosis (RAS), were studied using BOLD MRI before and after injection of furosemide, which reduces medullary oxygen consumption. R2* in cortex and medulla estimated before and after furosemide with the compartmental method were compared to those obtained using conventional T2*-image selection for ROI (manual ROI method), and a reference method with ROIs obtained using contrast-enhanced CT images co-registered for the same kidneys.
Results
All 3 methods provided similar cortical R2* values, but the Bland-Altman methods-agreement confidence intervals of the reference and compartmental-derived medullary R2* response in humans and pigs were smaller than those in the manual ROI method. Operator-dependency in swine was lower in the compartmental method and its estimates of variation were almost 1/3 compared to the manual ROI method.
Conclusions
The new compartmental method, which is less labor-intensive than the conventional method, provides comparable and less variable kidney R2* estimations, especially in renal medulla. This method could be useful for analysis of kidney BOLD data.
Keywords: BOLD, MRI, Kidney
Introduction
Blood oxygenation level dependent (BOLD) magnetic resonance imaging (MRI) is a powerful tomographic technique that enables assessment of tissue oxygenation 1 and has been used for intra-renal oxygen level evaluation for more than a decade 2-4 in a range of renal disorders, such as ischemic renal injury, diabetes and hypertension 5-9. Its non-invasive nature and ability to detect changes in kidney oxygen consumption secondary to physiological and pathophysiological challenges or drugs have turned this technique into a valuable functional too3,10-12.
BOLD-derived renal oxygenation is determined by the relaxivity index R2*, which reflects the tissue level of deoxyhemoglobin in discrete regions of interest (ROI) in the renal cortex and medulla on T2*-weighted images. The kidney circulation has remarkably regulated gradients for local oxygenation that differ between cortex and medulla, leaving some areas within the deep sections of medulla relatively hypoxic, even in normal kidneys. Changes in R2* in response to maneuvers that alter oxygen consumption, such as furosemide, a loop diuretic that inhibits sodium reabsorption at the medullary thick ascending limb of loop of Henle, reflect tubular workload and function10. However, how best to define the ROI’s that adequately represent cortical and medullary physiology remains a challenge. Conventionally, small ROIs showing the greatest hypoxia are selected, yet may misrepresent other regions of the heterogeneous medulla and are dependent on adequate differentiation of the cortex and medulla 10,13.
The renal cortex and medulla can often be visually discerned on MRI images of the human kidney. However, T2*-weighted MR images may not provide sufficient contrast to reliably differentiate these two compartments in other species or after a challenge, such as a loop diuretic, that brings medullary and cortical oxygenation to comparable levels 3. In addition, the accuracy, precision, and reproducibility of R2* values can be affected by the size of ROI. Larger ROIs that cover the entire compartments yield more representative and less noisy mean values, but are more prone to mis-registration between interventions14. This might introduce large errors because a small volume averaging with other compartments, such as the renal pelvis, can result in considerable underestimation of medullary R2*. On the other hand, small central ROIs are less vulnerable to volume averaging, but may be skewed by fluctuations caused by spatial and temporal heterogeneity in oxygen distribution in the kidney, particularly in the medulla 15. Therefore, estimated response to the challenge can be modulated by low frequency fluctuations of oxygen distribution.
We developed a new method for BOLD image analysis based upon the mean and distribution of R2* values for the cortex and medulla. This approach avoids the inherent limitations in selecting ROI by size and location. The new distribution function-based method distinguishes between the cortical and medullary populations without a need for manual ROI selection and is independent of orientation and volume change. We compared R2* values obtained with this method to those derived with conventional techniques in both animals and humans. Our reference method used ROI defined on CT images of the same subject. Co-registration of contrast-enhanced CT and MR images affords anatomically more precise ROIs, because the contrast agents distribute proportionally to blood flow, which is much higher in cortex than in medulla. Because imaging artifacts, physiological factors, and experimental conditions may be species-dependent and affect these measurements, for the present study we compared these methods of BOLD MRI analysis within swine models of different strains and chronic vascular occlusion and within humans undergoing protocol studies for evaluation of atherosclerotic renal vascular disease.
Materials and Methods
The new method relies on the heterogeneity of medullary oxygenation. Oxygen distribution in the cortex is homogenous and its levels are high because of its extensive blood flow, abundant oxygen supply, and low metabolic rate relative to the medulla 16. In the medulla, however, high oxygen demand, limited supply, and variable metabolic rates along the nephron produce considerable spatial heterogeneity in oxygen levels17.
Cortical and medullary R2* distributions were characterized with Gaussian and gamma distribution functions, respectively. The distribution functions were chosen empirically and validated using statistical tests. The R2* distributions in the cortex, Equation (1.a), and medulla, Equation (1.b), were expressed as:
| (1.a) |
and
| (1.b) |
Where a1 and a2 are population scale parameters, is the mean and σ2 is the variance of cortical BOLD index. In the medullary distribution function, k and θ are shape and scale parameters. RT is the lower threshold of R2* in medulla. The parameters in the cortical and medullary distribution functions were hence estimated by simultaneously fitting the collective R2* values, from all slices, to a sum of a Gaussian and a Gamma distribution functions:
| (2) |
The mean cortical R2*, , was estimated directly from fitting equation (2) to the data, whereas the medullary mean R2* was calculated from the medullary distribution:
| (3) |
The mean R2* values calculated using the method above were compared, later, to mean R2* values calculated using the conventional and a reference methods.
Experimental Protocol
The relaxivity index R2* was calculated in pigs (n=11 total) and a eventually confirmed in group of patients (n=9) using the new “compartmental” method and two other techniques. All subjects underwent BOLD-MRI under basal conditions and after administration of furosemide intravenously, and 1-4 days later underwent contrast-enhanced CT. In one of these analysis techniques contrast-enhanced CT images were utilized to define the ROI’s and subsequently select medullary and cortical ROIs to apply on MRI images. This “hybrid” method was used as the reference standard. In the conventional manual method the ROIs were selected manually from T2* MR images. To increase the spectrum of renal oxygenation and R2* values, some of the animals and humans included in this study had unilateral renal artery stenosis (RAS), which can lead to severe renal hypoxia (increased R2*).
Animal Protocol
All animal procedures followed the Guide for the Care and Use of Laboratory Animals (National Research Council, National Academy Press, Washington, DC, 1996) and approved by the Institutional Animal Care and Use Committee.
Animal Groups
The studies were performed on 11 pigs of two different backgrounds (6 farm and 5 obese Ossabaw). In Group 1, 4 normal and 2 RAS pigs (n=12 kidneys) were used to compare the mean and response R2* to those obtained with the reference method. RAS was induced 6 weeks earlier by implanting a local-irritant coil in one renal artery 18, and was defined based on presence of hemodynamically significant stenosis (>70% by angiogram) and elevation of blood pressure. In addition, the inter-observer variability of mean R2*, analyzed by 2 different operators, was determined. Group 2 included 5 obese Ossabaw pigs (n=10 kidneys) used to investigate the reproducibility of R2* values in kidney, using different sampling orientations from axial and coronal MR images. Because of the surrounding layer of perirenal fat, the obese pig kidneys are less vulnerable to abdominal susceptibility artifact (ASA) and its impact on the reproducibility of the data.
Before each in vivo study animals were sedated (Telazol 5mg/kg and xylazine 2mg/kg in saline, I.M), ventilated and then anesthesia maintained with inhaled 1-2% isoflurane. Animals were ear vein catheterized and for administration of furosemide (0.5 mg/kg) after baseline and the BOLD MRI study repeated 15 min later.
Patients Protocol
The patients’ protocol was approved by the institutional review board of the Mayo Clinic and written consent was obtained.
A study in 9 patients (n=18 kidneys), 3 with essential hypertension and 6 with unilateral RAS examined the feasibility of using the compartmental method in humans by comparing its results to the manual ROI and hybrid methods. The patients were recruited from another on-going clinical study19. Hemodynamically significant RAS was confirmed by Doppler ultrasound and CT angiography following standard criteria.
Data Analysis
All data was processed in MATLAB 7.10 (MathWorks Inc, Natick, MA). R2* values were estimated by calculating the decay rate of MR signal by fitting signal intensity vs. TE to a single exponential function in a voxel-by-voxel scheme. An R2* parametric map was created for each slice, and used to avoid the areas affected by visible artifacts. The major source of artifact was ASA, which was recognized based on the location, pattern and R2* values that were significantly higher than the surrounding cortical tissues. The mean R2* in cortex and medulla were then calculated using the manual ROI, hybrid and compartmental methods.
Manual ROI Method
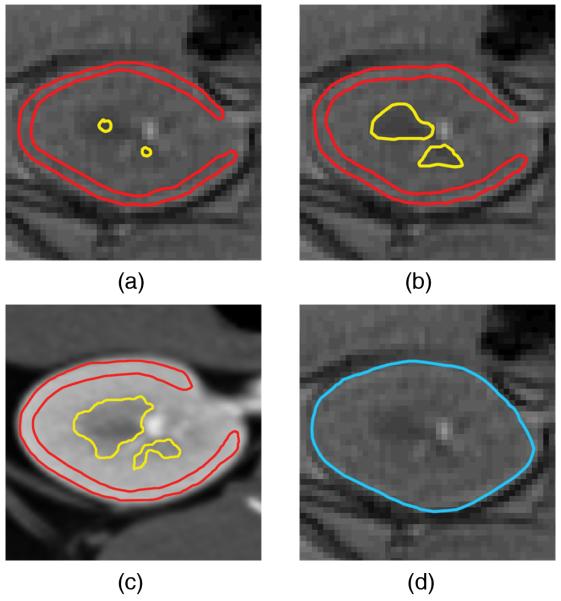
R2* values were estimated from medullary ROI defined based on its anatomical location and contrast from cortex in T2*-weighted MR images, using either small or large ROIs. The small ROIs were drawn in the center and the large ROIs obtained by manually tracing the entire visible medullary (12-24 ROIs per kidney) or cortical areas (Figures 1.a & 1.b). In this study the manual ROI method will refer to the method with large ROIs unless stated otherwise.
Figure 1.
ROI selection in the 4 methods studied. The small ROIs (a) and large ROIs (b) T2, the hybrid (c), and the compartmental (d) methods. In the hybrid method ROIs were selected to exclude potential overlap within the compartments to minimize volume averaging.
Hybrid Method
In the hybrid method the large medullary and cortical ROIs were traced on contrast-enhanced co-registered MDCT images, and transferred to BOLD MRI images and the parametric map (Figure 1.c). Similarly ROIs selected on pre-furosemide images were transferred to the same location on post-images. The area-weighted mean R2* values were calculated for before and after intervention.
Compartmental Method
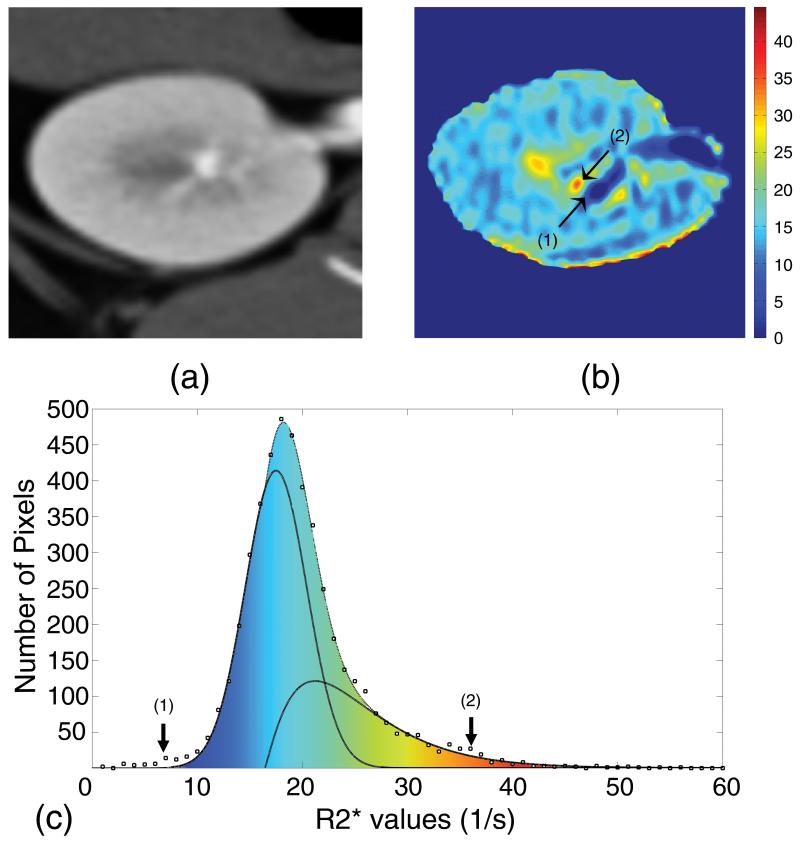
In this method the traced ROIs included the entire kidney, and the R2* histogram of the tissue generated for values between 0-60 s−1 at resolution of 0.5-1.0 s−1 (Figure 2). The upper limit of the R2* window was selected to include even the most hypoxic tissue, while excluding higher values that generally belong to areas affected by residual ASA.
Figure 2.
A contrast-enhanced MDCT image (a), a corresponding MRI parametric R2* map (b), and the resultant histogram showing the best fitted cortical and medullary curves (c). Region (1) shows the low R2* components, such as urine, and (2) shows high R2* components, such as highly hypoxic regions. The high R2* region in the vicinity of a low R2* regions on the parametric map is prone to mis-registration, while on the histogram the two regions are mapped to the two extreme ends of spectrum and have no mutual effect.
Because of their different distribution characteristics, cortical and medullary R2* distributions were approximated by Gaussian and gamma distribution functions, respectively, the validity of which was examined using statistical tests. In the cortex, normality of distributions was assessed by skewness and kurtosis, calculated for each of 22 swine kidneys by sampling 250 cortical pixels, and Bowman-Shenton normality distribution criteria was then investigated20. Partial sampling was preferred over entire cortex ROIs to avoid regions even minimally affected by ASA, which might affect the skewness test. Medullary R2* in each kidney was sampled using an approach similar to the hybrid method. Multiple major distribution functions were examined against the data to find the closest function, based on the co-linearity of probability plots 21,22.
To further test the validity of the distribution model assigned to the cortex and medulla, the total volume of each sampled compartment was calculated by multiplying voxel volume by the total number of voxels, and compared to the volumes estimated from the corresponding contrast-enhanced MDCT images. For this purpose ROIs on corresponding MDCT images traced entire cortex or medulla, and were transferred to the MRI images to calculate the total number of voxels in each compartment. Volumes were assessed by multiplying the number of these voxels to the voxel volume.
Magnetic Resonance Imaging protocol
BOLD scans were performed on a 3T (GE Medical Systems, Milwaukee, WI) scanner using Fast Gradient Echo with multiple echo times. The MR parameters were optimized separately for each species.
In the animal studies axial BOLD images were collected in oblique planes using 16 echoes. Imaging parameters were set to TR/TE/Flip Angle/FOV/Slice thickness/Matrix = 100ms, 2.1-27ms, 40°, 32cm, 7mm, 256x256. In Group 2, both axial and coronal images were collected with 2.5mm thickness to reduce other sources of error (e.g. volume averaging and ASA) that could interfere with assessing the reproducibility. All acquisitions were performed during suspended respiration.
In the patient study BOLD images were acquired using the same sequence with 8 echoes. Images were acquired at TR/TE/Flip Angle/FOV/Slice thickness/Matrix = 140ms, 2.5-32ms, 45°, 32-40cm, 5mm, 224x160 to 192 pixels19. Patients were instructed to hold their breath during acquisition intervals (maximum 20 seconds).
Multi-detector Computerized Tomography (MDCT) protocol
Fast CT studies were performed 1-4 days after MRI to assess renal anatomy and size in each kidney by multi-detector computed tomography (MDCT) after a bolus of x-ray contrast medium, iopamidal (0.5cc/kg over 5-6 seconds).
Axial images were acquired by a Somatom Definition Dual Source scanner (Siemens Medical Solutions, Forchheim, Germany) at helical acquisition with thickness of 0.6mm and resolution of 512x512. The volume images were reconstructed at 0.6mm thickness with 0.3mm overlap using the convolution kernel =B10f. Initiation of acquisition was set to trigger near the peak of the aorta intensity signal, such that the duration of acquisition time encompasses the vascular phase (maximal intensity) of contrast through the cortex of both kidneys.
Co-registration
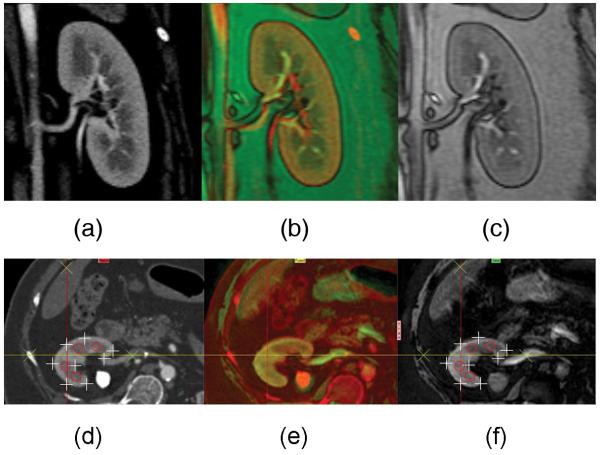
Image co-registration (4 slices per kidney) was performed using the 3D Voxel Co-registration module in Analyze® (Biomedical Imaging Resource, Mayo Clinic, Rochester, MN). CT images corresponding to baseline (pre-furosemide) MR slices were co-registered based on anatomical reference points inside and around the kidney (Figure 3). Co-registration was performed and inspected in all 3 dimensions for close match of cortical and visible medullary regions. Then CT images matching MR specifications, such as thickness and spatial resolution, were re-created from the volume data. In addition to MDCT-MRI co-registration, post furosemide MR images were also co-registered to the baseline images to reduce motion errors. This was particularly useful for the humankidneys, considering the possibility of small position shifts between the two scans.
Figure 3.
Examples of coronal and axial images constructed for the reference “hybrid” method of BOLD MR analysis. MDCT (a,d) and MR (c,f) images were co-registered (b,e) based on anatomical landmarks. Contrast agent aided MDCT images were used to select ROIs in the hybrid method. The quality of co-registration has been demonstrated with point-to-point verification of the edge of the kidney (+), medullary regions (o), and landmarks (x).
Statistical Methods
In the patient study and Group 1 all values have been reported as bias ± variation calculated according to Bland-Altman method 23, with the bias being the mean deviation from the mean reference value. Positive bias indicates the method overestimates the measured parameter, and negative values indicate underestimation. Bias values smaller than the resolution of the histograms (0.5-1.0 s−1) were considered negligible. Variation was used as a measure of precision and reproducibility, and equals the standard deviation from the reference values and one half of 95% confidence interval in the Bland-Altman plots. Smaller numbers and tighter confidence intervals suggest smaller deviation from the reference standard method.
Inter-observer reproducibility was examined by calculating the, which is the difference in R2* values estimated by the two independent operators for every kidney in the group. Results were reported as bias (difference in mean values) ± inter-observer variability (the standard deviation of distribution).
The reproducibility of R2* was also investigated by comparing R2* values estimated from axial and coronal images in Group 2 to find the method that provides the most reproducible global mean R2* values independent of sampling orientation.
Results
The inherent nature of oxygen distribution in the kidney revealed two distinct populations in its R2* histogram, which were separated by the new compartmental method to calculate the mean R2* value for each compartment. In 22 domestic pig kidneys, the average cortex kurtosis and absolute skewness were 3.5±1.2 and 0.3±0.2, respectively, and the Bowman-Shenton contour test showed that the R2* distribution can be closely characterized by Gaussian distribution (Figure 2.c, adjusted R2 > 0.98). Distribution of R2* values in the medulla was asymmetric, with a slow decaying skew towards higher R2* values. The probability plots for the 3-parameter gamma distribution (shape, scale, and position) were collinear over a large part of the R2* spectrum, and in spite of some deviation from the model at low R2* values, the higher values, representing the most hypoxic regions, best fitted the gamma distribution function (adjusted R2 > 0.91).
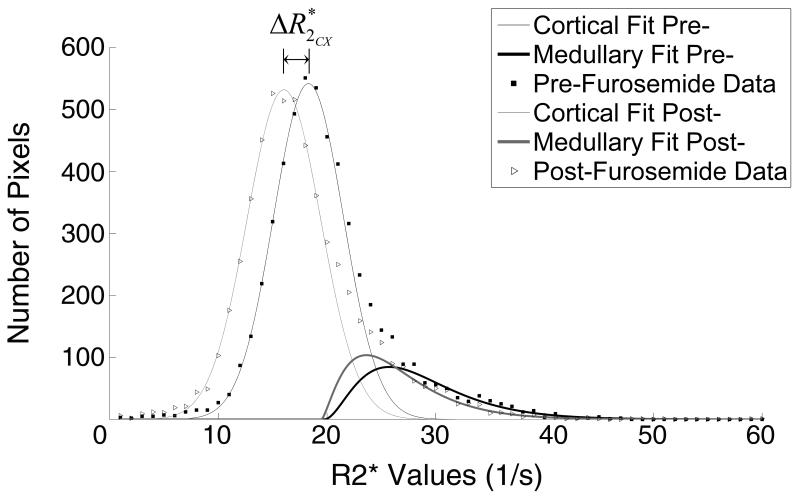
Figure 4 shows the R2* distribution curves obtained before and after furosemide that demonstrated reduction in R2* after drug administration which was larger in the medulla than in the cortex. Also, in the cortex the reduction reflected a slight shift towards smaller R2* values, while the curve retained its width (from 3.1±0.8 s−1 to 3.4±1.1 s−1). In the medulla, on the other hand, in addition to a shift, a change in the distribution pattern of R2* values was evident.
Figure 4.
Representative cortical and medullary curves obtained before and after furosemide administration. Cortical curve shifted slightly left towards lower R2* values post-furosemide (ΔR2*), while the medullary curve showed both a shift and a change in the distribution pattern.
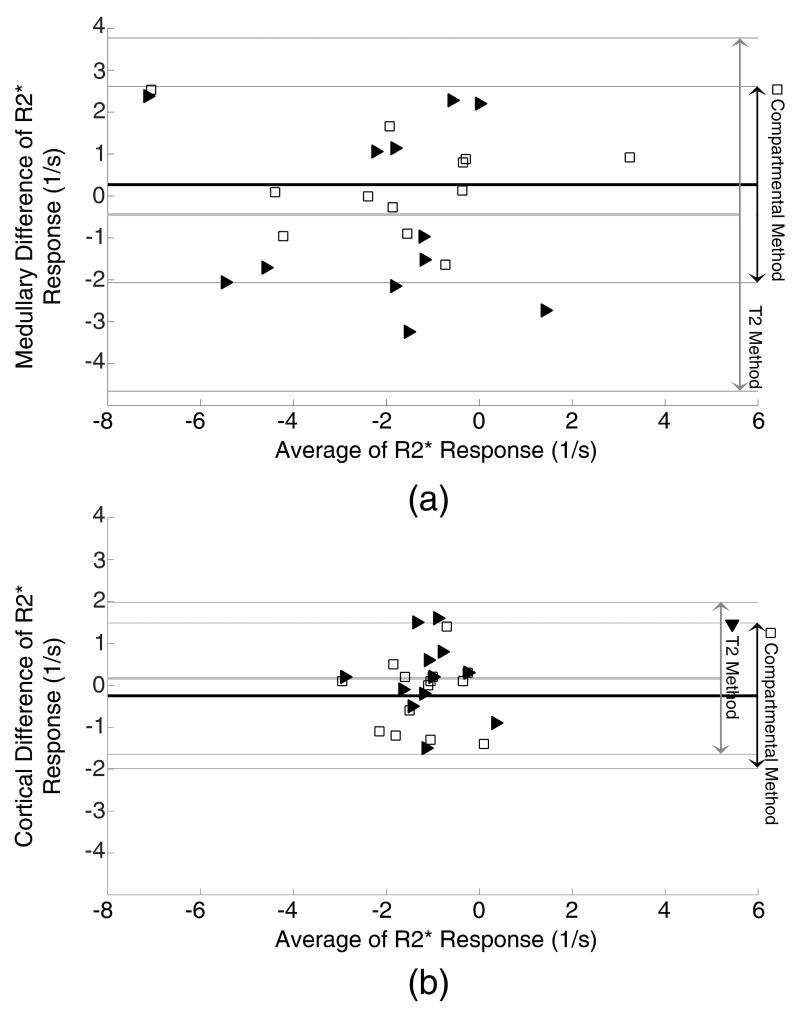
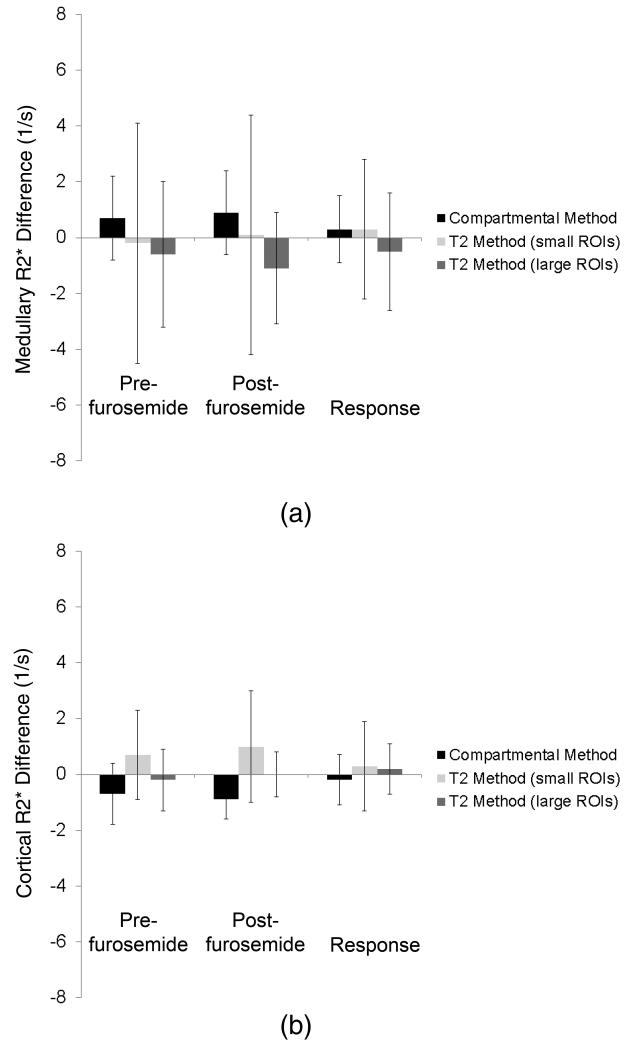
Medullary R2* values showed significant decrease after furosemide in all methods (p<0.05 vs. baseline) except for the manual method with small ROIs (Table 1). The estimated medullary responses to the drug challenge in the compartmental and manual ROI methods were in close agreement with the reference hybrid method, and the differences were less than 1 s−1 (Figure 5). The variations from the reference values were smaller in the compartmental method as the confidence interval was 75% smaller than the manual ROI method (Figure 6.a). In addition, R2* obtained using manual ROI method with small ROIs showed medullary R2* variation from the reference value more than twice of the compartmental method (2.5 s−1 vs. 1.2 s−1, respectively), suggesting lower reproducibility of the former method.
Figure 5.
Altman-Bland graphs comparing the bias and variation of R2* derived from the compartmental (blank squares) and T2 (solid triangles) methods to the reference hybrid method. The biases in both methods were small, but the compartment method showed less variability (higher reproducibility).
Figure 6.
R2* values in the pig medulla (top) and cortex (bottom) calculated using the compartmental and small and large-ROI T2 methods before and after furosemide, as well as the response intervention. Estimated cortical and medullary R2* values are close, but the compartmental method shows smaller variations in medullary values than the T2 method.
While central medullary regions remained uninfluenced by ASA, the anterior renal cortex was affected in most of the axial images and rarely in coronal images. In the manual ROI method, ASA resulted in elevation of cortical R2* values proportional to the size or severity of the artifact (data not shown). Due to the resemblance of the manual ROI and hybrid methods in cortical R2* estimation approach, similar elevations were observed in the hybrid method. After the affected areas were excluded, all three methods estimated cortical R2* values similarly. In contrast, cortical R*2 values calculated before and after excluding ASA using compartmental method remained the same (<1 s−1).
In Group 1, the difference in mean medullary R2* response by different operators were smaller than the precision of both the compartmental and the manual ROI methods (Table 2), implying that the average response to the drug, estimated by different operators were similar. However, the compartmental method produced less variable and thus more reproducible results, and showed less operator dependency.
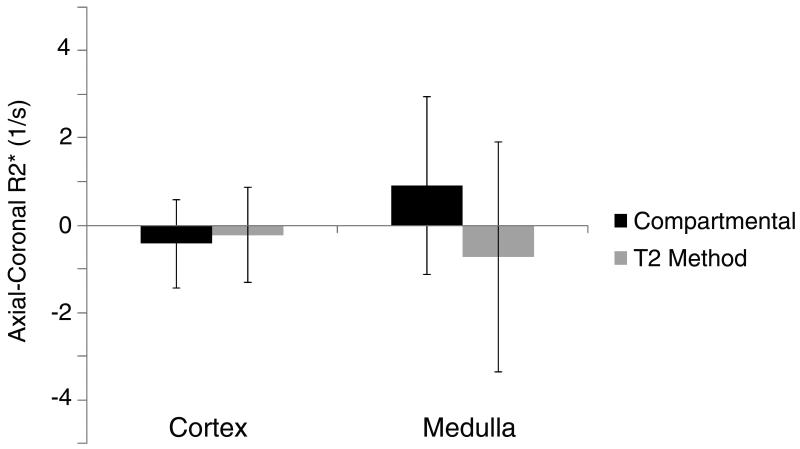
In Group 2, the estimated coronal and axial mean R2* values in the medulla remained similar regardless of the orientation and method used, but the variation in the compartmental method was 30% smaller than that in the manual ROI method (Figure 7). In the cortex, these methods showed similar reproducibility (−0.4±1.0 s−1 and −0.2±1.1 s−1, respectively).
Figure 7.
The variation of R2* values calculated from coronal and axial images of the same pig kidneys. The biases in both methods were small. However, the variation was larger in the T2 than in the compartmental method and in the medulla (a) than in the cortex (b).
Human studies
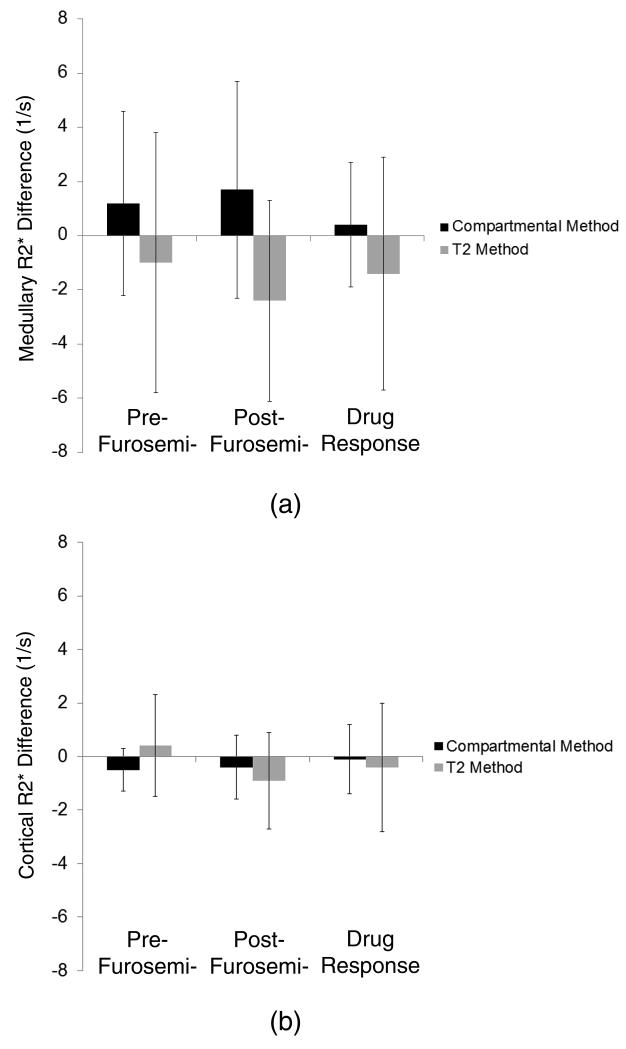
The data from the patient study, analyzed similar to Group 1, are demonstrated in Figure 8. The manual ROI method overestimated the response to the drug by 1.2 s−1 while the bias in the compartmental method was only 0.5 s−1. Also, comparing to the hybrid method, the variations in the results of the manual ROI were 85% larger than in the compartmental method.
Figure 8.
R2* values in the human medulla (top) and cortex (bottom) calculated using the compartmental and T2 methods before and after furosemide, and the response to intervention, compared to the hybrid method. Estimated cortical R2* values are similar, while the T2 method overestimated the medullary response. The compartmental method shows considerably smaller variations than the T2 method in both the cortex and medulla.
Finally, medullary volumes, in the 4 analyzed slices per kidney, estimated from the compartmental method yielded values slightly (12%) but not significantly smaller than the MDCT reference volumes (4.98±0.79 cm3 and 4.44±1.64 cm3, respectively, p>0.1).
Discussion
This study introduces a novel method to estimate the R2* distribution in the renal cortex and medulla and assess the response to furosemide. The method was compared to a conventional manual ROI method for selection of ROI, as well as to a reference hybrid method that implements contrast-enhanced MDCT images to differentiate cortical and medullary compartments. We observed that this new method provided reliable estimation of the medullary R2* response to drug challenge, as those were in close agreement with the reference method. Importantly, the compartmental method showed smaller variability than the conventional manual ROI method.
Accurate differentiation of the renal cortex and medulla is necessary to estimate basal R2* values as well as the response to drug administration. Because using contrast-enhanced MDCT can improve the accuracy of ROI definition, we used CT-defined ROI’s as the reference to extract cortical and medullary R2* values (“hybrid” method). Although the medullary response to inhibition of solute transport with furosemide estimated by the compartmental method was in close agreement with the hybrid method, the absolute medullary values tended to be slightly higher (Table 1). Possibly, underestimation of low R2* values, the part of the distribution curve that partly overlaps with cortical R2*, resulted in elevation of the estimated mean values. This assumption is consistent with the slight (but not significant) volume underestimation by compartmental method. The small R2* overestimations were relatively close in pre- and post-furosemide values and canceled out to a large extent in calculation of R2* response.
Conversely, the manual ROI method tended to underestimate absolute medullary R2* values and overestimate the drug response, probably because of mis-registration of pre- and post-intervention ROIs. The same medullary ROIs selected on baseline images were transferred to the post-furosemide images, yet the kidney may expand under the influence of the diuretic drug, leading to volume averaging with other compartments (e.g. renal pelvis or cortex). The volume averaging with the cortex has a very small impact, since after furosemide administration the R2* of cortex and medulla are relatively close. However, because of the large difference between the R2* values of urine in the calyces () and medulla, even a small volume-averaging effect would result in large underestimation, especially in post furosemide R2*, which was therefore not canceled during response calculation. The compartmental method is relatively insensitive to this error since in the R2* histogram the population that represents urine is located on the left side of the spectrum (low values) remote from the medullary population. Furthermore, the populations are extracted independently on the baseline and the post-challenge images.
The compartmental method was also insensitive to the ASA artifact because the elevated values of cortex were localized to the far right of the spectrum and had no influence on the cortex Gaussian curves. Heavily influenced regions were filtered out by the choice of the spectrum window (0-60 s−1). However, the manual ASA exclusion in the compartmental method was still useful to minimize overlap with the hypoxic medullary region on the spectrum.
This approach on patients’ data yielded comparable results to the animal study. In the cortex all three methods estimated similar values for R2*, when ASA affected areas were excluded. In the medulla manual ROI overestimated the drug response, and both the manual ROI and compartmental methods showed significantly larger variations than in the animal studies. This was partly consequent to higher R2* values in human than pigs, which adjusted the variations and biases to a higher scale, and partly due to lower accuracy in the MDCT and MRI co-registration in humans, who were subject to greater motion and respiration artifacts than the anesthetized and ventilated animals. The smaller difference in R2* values between the swine cortex and medulla also composes a greater challenge for ROI selection, yet our compartmental model provided robust differentiation of R2* distribution patterns in this species. CT images, as used in the hybrid method, are usually unavailable, and their co-registration to MRI is time consuming and requires skill.
In the conventional manual method with small ROIs, although the mean R2* values remained close to the other methods, the variability from the reference method increased up to 3-fold compared to the compartmental method, possibly because R2* values calculated using this method are more subjected to temporal and spatial fluctuations of oxygen level than values calculated using large ROIs.
In our hands, the conventional method is more time consuming than the compartmental method by approximately 3-4 folds, partly because of the larger number of steps it requires. For example, pre to post-drug co-registration which is necessary in the conventional method, is not required in the compartmental method, since the pre and post-intervention images are analyzed independently. Also, in the conventional method medullary and cortical regions are traced by separate ROIs, whereas in the compartmental method the entire kidney is marked with a single ROI.
The compartmental method, due to its statistical nature, has some intrinsic limitations. Smoothness of the histogram curve depends on the amount of data available, and when limited, precision or accuracy might be compromised. Inaccurate estimation of absolute R2* may occur when the method is not able to statistically differentiate the relatively highly oxygenated medullary regions from cortex, or in severely diseased kidney (e.g. stage 5 chronic kidney disease). A similar issue affected the volumes estimated using this method as well. This study also revealed that, although to a smaller extent than the manual ROI method, the compartmental method may potentially be sensitive to ASA if not manually removed as conventionally done.
In summary, this study introduced a new compartmental-method, which yields mean R2* values comparable to those derived from the manual ROI and hybrid method. Furthermore, it was found to be reliable and estimated mean BOLD response in the kidney and reproducibly than the conventional manual ROI method. In addition to mean R2* values, the method provides distribution curves in the cortex and medulla and thereby affords assessment of R2* distribution patterns within these compartments. Since the compartmental method does not require manual compartments delineation, it is less laborious and operator-dependent compared to many other current methods, and limits the need for ROI registration between interventions. Some other advantages of this method such as excluding the artifacts with extreme R2* values, makes it a robust and useful tool to analyze kidney BOLD MRI images. Future studies are needed to test this approach under different conditions and in additional models.
Acknowledgement
This study was partly supported by National Institutes of Health Grants NIH DK73608, DK77013, HL77131, HL085307 and C06-RR018898.
Footnotes
This is a PDF file of an unedited manuscript that has been accepted for publication. As a service to our customers we are providing this early version of the manuscript. The manuscript will undergo copyediting, typesetting, and review of the resulting proof before it is published in its final citable form. Please note that during the production process errors may be discovered which could affect the content, and all legal disclaimers that apply to the journal pertain.
References
- 1.Ogawa S, Lee TM, Kay AR, Tank DW. Brain magnetic resonance imaging with contrast dependent on blood oxygenation. Proc Natl Acad Sci U S A. 1990 Dec;87(24):9868–9872. doi: 10.1073/pnas.87.24.9868. [DOI] [PMC free article] [PubMed] [Google Scholar]
- 2.Prasad PV, Edelman RR, Epstein FH. Noninvasive evaluation of intrarenal oxygenation with BOLD MRI. Circulation. 1996 Dec;94(12):3271–3275. doi: 10.1161/01.cir.94.12.3271. [DOI] [PubMed] [Google Scholar]
- 3.Epstein FH, Prasad P. Effects of furosemide on medullary oxygenation in younger and older subjects. Kidney Int. 2000 May;57(5):2080–2083. doi: 10.1046/j.1523-1755.2000.00057.x. [DOI] [PubMed] [Google Scholar]
- 4.Malvezzi P, Bricault I, Terrier N, Bayle F. Evaluation of intrarenal oxygenation by blood oxygen level-dependent magnetic resonance imaging in living kidney donors and their recipients: preliminary results. Transplant Proc. 2009 Mar;41(2):641–644. doi: 10.1016/j.transproceed.2008.12.012. [DOI] [PubMed] [Google Scholar]
- 5.Juillard L, Lerman LO, Kruger DG, et al. Blood oxygen level-dependent measurement of acute intra-renal ischemia. Kidney Int. 2004 Mar;65(3):944–950. doi: 10.1111/j.1523-1755.2004.00469.x. [DOI] [PubMed] [Google Scholar]
- 6.Ries M, Basseau F, Tyndal B, et al. Renal diffusion and BOLD MRI in experimental diabetic nephropathy. Journal of Magnetic Resonance Imaging. 2003 Jan;17(1):104–113. doi: 10.1002/jmri.10224. [DOI] [PubMed] [Google Scholar]
- 7.Li LP, Storey P, Kim D, Li W, Prasad P. Kidneys in hypertensive rats show reduced response to nitric oxide synthase inhibition evaluated by BOLD MRI. Journal of Magnetic Resonance Imaging. 2003 Jun;17(6):671–675. doi: 10.1002/jmri.10301. [DOI] [PMC free article] [PubMed] [Google Scholar]
- 8.Textor SC, Glockner JF, Lerman LO, et al. The use of magnetic resonance to evaluate tissue oxygenation in renal artery stenosis. J Am Soc Nephrol. 2008 Apr;19(4):780–788. doi: 10.1681/ASN.2007040420. [DOI] [PMC free article] [PubMed] [Google Scholar]
- 9.Prasad P, Li LP, Halter S, Cabray J, Ye M, Batlle D. Evaluation of renal hypoxia in diabetic mice by BOLD MRI. Invest Radiol. 2010 Dec;45(12):819–822. doi: 10.1097/RLI.0b013e3181ec9b02. [DOI] [PMC free article] [PubMed] [Google Scholar]
- 10.Warner L, Glockner JF, Woollard J, Textor SC, Romero JC, Lerman LO. Determinations of renal cortical and medullary oxygenation using blood oxygen level-dependent magnetic resonance imaging and selective diuretics. Invest Radiol. 2011 Jan;46(1):41–47. doi: 10.1097/RLI.0b013e3181f0213f. [DOI] [PMC free article] [PubMed] [Google Scholar]
- 11.Hofmann L, Simon-Zoula S, Nowak A, et al. BOLD-MRI for the assessment of renal oxygenation in humans: acute effect of nephrotoxic xenobiotics. Kidney Int. 2006 Jul;70(1):144–150. doi: 10.1038/sj.ki.5000418. [DOI] [PubMed] [Google Scholar]
- 12.Schachinger H, Klarhofer M, Linder L, Drewe J, Scheffler K. Angiotensin II decreases the renal MRI blood oxygenation level-dependent signal. Hypertension. 2006 Jun;47(6):1062–1066. doi: 10.1161/01.HYP.0000220109.98142.a3. [DOI] [PubMed] [Google Scholar]
- 13.Djamali A, Sadowski EA, Muehrer RJ, et al. BOLD-MRI assessment of intrarenal oxygenation and oxidative stress in patients with chronic kidney allograft dysfunction. Am J Physiol Renal Physiol. 2007 Feb;292(2):F513–522. doi: 10.1152/ajprenal.00222.2006. [DOI] [PubMed] [Google Scholar]
- 14.Gloviczki ML, Glockner J, Gomez SI, et al. Comparison of 1.5 and 3 T BOLD MR to Study Oxygenation of Kidney Cortex and Medulla in Human Renovascular Disease. Investigative Radiology. 2009 Sep;44(9):566–571. doi: 10.1097/RLI.0b013e3181b4c1e8. [DOI] [PMC free article] [PubMed] [Google Scholar]
- 15.Lubbers DW, Baumgartl H. Heterogeneities and profiles of oxygen pressure in brain and kidney as examples of the pO2 distribution in the living tissue. Kidney Int. 1997 Feb;51(2):372–380. doi: 10.1038/ki.1997.49. [DOI] [PubMed] [Google Scholar]
- 16.Brezis M, Rosen S, Silva P, Epstein FH. Renal ischemia: a new perspective. Kidney Int. 1984 Oct;26(4):375–383. doi: 10.1038/ki.1984.185. [DOI] [PubMed] [Google Scholar]
- 17.O’Connor PM. Renal oxygen delivery: Matching delivery to metabolic demand. Clinical and Experimental Pharmacology and Physiology. 2006 Oct;33(10):961–967. doi: 10.1111/j.1440-1681.2006.04475.x. [DOI] [PubMed] [Google Scholar]
- 18.Lerman LO, Schwartz RS, Grande JP, Sheedy PF, Romero JC. Noninvasive evaluation of a novel swine model of renal artery stenosis. J Am Soc Nephrol. 1999 Jul;10(7):1455–1465. doi: 10.1681/ASN.V1071455. [DOI] [PubMed] [Google Scholar]
- 19.Gloviczki ML, Glockner JF, Lerman LO, et al. Preserved Oxygenation Despite Reduced Blood Flow in Poststenotic Kidneys in Human Atherosclerotic Renal Artery Stenosis. Hypertension. 2010 Apr;55(4):961–966. doi: 10.1161/HYPERTENSIONAHA.109.145227. [DOI] [PMC free article] [PubMed] [Google Scholar]
- 20.Bowman KO, Shenton LR. Omnibus test contours for departures from normality based on √b1 and b2. Biometrika. 1975;62(2):243–250. [Google Scholar]
- 21.Wilk MB, Gnanadesikan R. Probability plotting methods for the analysis of data. Biometrika. 1968 Mar;55(1):1–17. [PubMed] [Google Scholar]
- 22.Wilk MB, Gnanadesikan R, Huyett MJ. Probability Plots for the Gamma Distribution. Technometrics. 1962;4(1):1–20. [Google Scholar]
- 23.Bland JM, Altman DG. Statistical methods for assessing agreement between two methods of clinical measurement. The Lancet. 1986 Aug;327(8476):307–310. [PubMed] [Google Scholar]


