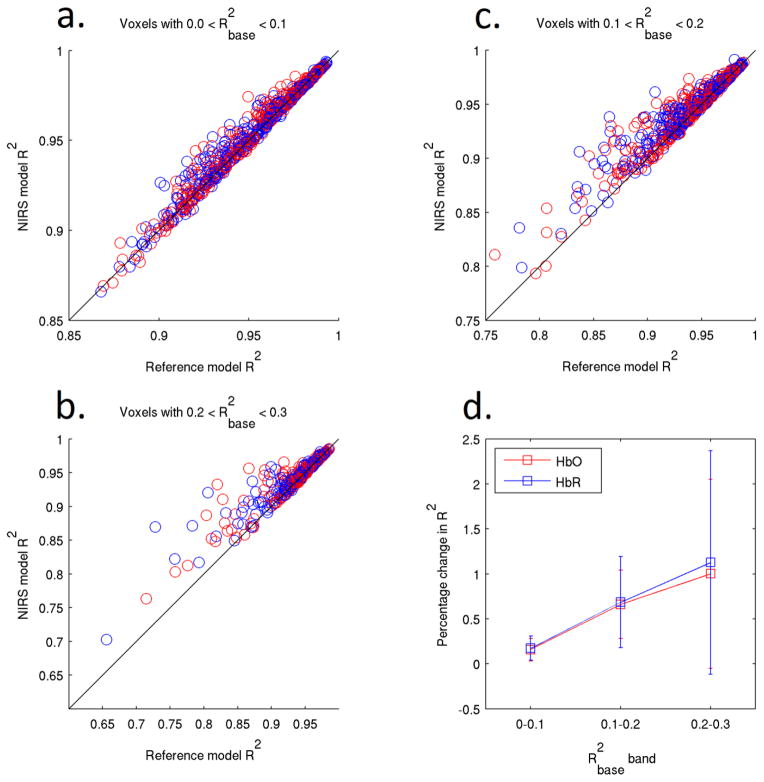
Figure 6.
The single-regressor NIRS model R2 plotted against the reference model R2 for 100 voxels selected using the value of the baseline NIRS-fMRI correlation for each voxel. The data is separated into three bands on the basis of . The average increase in R2 for all data points is shown in figure 6d. The value of R2 between the synthetic and recovered HRFs increases as a function of . The error bars in figure 6d show the standard deviation across all data points of figures 6a–6c.

