Abstract
BACKGROUND
T-wave alternans (TWA), has been associated with increased vulnerability to ventricular tachyarrhythmias and sudden cardiac death (SCD). However, both random (white) noise and (patho)physiologic processes (i.e. premature ventricular contractions [PVCs], heart and respiration rates) may hamper TWA estimation and therefore, lessen its clinical utility for risk stratification.
OBJECTIVE
To investigate the effect of random noise and certain (patho)physiologic processes on the estimation of TWA using the Fast Fourier Transform (FFT) method and to develop methods to overcome these potential sources of error.
METHODS
We used a combination of human electrocardiogram data and computer simulations to assess the effects of a PVC, random and colored noise on the accuracy of TWA estimation.
RESULTS
We quantitatively demonstrate that replacing a “bad” beat with an odd/even median beat is a more accurate approach than replacing it with the overall average or the overall median beat. We also show that phase resetting may have a significant effect on alternans estimation and that estimation of alternans using frequencies greater than 0.4922 cycles/beat in a 128-point FFT provides the most accurate approach for estimating the alternans when phase resetting is likely to occur. Additionally, our data demonstrate that the number of indeterminate TWA tests due to high levels of noise can be reduced when the alternans voltage exceeds a new higher threshold. Also, the amplitude of random noise has a significant effect on alternans estimation and should be considered to adjust the alternans voltage threshold for noise levels greater than 1.8 μV. Finally, we quantitatively demonstrate that colored noise may lead to a false positive or a false negative result. We propose methods to estimate the effect of these (patho)physiologic processes on the alternans estimation in order to determine whether a TWA test is likely to be a true positive or a true negative.
CONCLUSION
This study introduces novel methods to overcome potential sources of error in the estimation of TWA. These methods may improve the utility of TWA either for ambulatory monitoring or for clinical risk stratification for ventricular arrhythmias and SCD.
Keywords: arrhythmias, alternans, phase resetting, random and colored noise
Introduction
The use of a Fast Fourier Transform (FFT)-based spectral method1, 2 for estimating microscopic T-wave alternans (TWA) has been shown to predict the risk of ventricular arrhythmias and sudden cardiac death (SCD) across a broad spectrum of cardiac disease states2–6. Although several methods have been developed for TWA estimation, the FFT spectral method has been the most broadly accepted technique due to its inherent strength in differentiating between true alternans and non-specific electrocardiographic (ECG) noise. Therefore, the FTT spectral method serves as the method of interest in this investigation.
Several sources of error may hamper the estimation of TWA using the FFT spectral method including noise and (patho)physiologic phenomena (i.e. premature ventricular contractions [PVCs]). Sources of noise may be entirely random (“white” noise) or impacted by physiologic processes such as heart rate and respiratory rate (“colored” noise). However, heart rate may directly affect the frequency content of the spectrum used to estimate alternans or alternans noise7. Furthermore, heart rate elevation can indirectly affect alternans estimation through modulation of the respiration rate and the effect of respiration sub-harmonics on the alternans frequency, alternans noise band or both.
It has also been reported that abnormal or “bad” beats with altered morphology and/or timing present inherent difficulties in the estimation of alternans8. Hashimoto et al.9 have demonstrated that a PVC, or transient prolongation or shortening of the cycle length, may change the phase of alternans and potentiate the degree of alternans, both of which may have a significant impact on the TWA estimation.
Clinically, TWA tests are classified as positive, negative or indeterminate, with causes of indeterminacy including excessive ventricular ectopy, inadequate heart rate, unsustained alternans and excessive noise. In recent prospective studies, the frequency of indeterminate test results has ranged from 19–41%10–13. Given the significant percentage of indeterminate test results, identifying appropriate management algorithms for patients with indeterminate tests is crucial to maintaining the clinical utility of TWA testing.
In this study, we explore the effects of random noise and (patho)physiologic processes on the estimation of TWA and propose that the criteria to determine outcomes of TWA testing can be expanded and improved. Specifically, we quantitatively explore the effect of a “bad” beat on alternans estimation, the effect of replacing a “bad” beat with an average beat and finally, the effect of random (white) and colored noise on the alternans estimation.
Methods
Alternans Time Series Generation
We generated 128-point long time series exhibiting alternans-type oscillations by sampling randomly generated numbers from a zero mean Gaussian distribution with standard deviations of 0.1, 1.0, 2.0, 5.0, 10.0 and 100.0 μV. Given that prior studies have reported typical TWA on the body surface ECG of 1–10 μV 2, 14, 15 or on intra-cardiac electrograms of 5–20 μV 16, these standard deviations were chosen to correspond to typical amplitudes of small, medium and large amplitudes of TWA.
Alternans Estimation
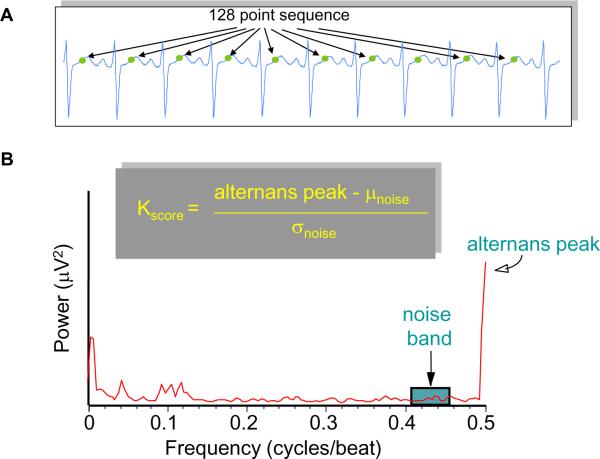
For alternans spectral analysis we used a 128-beat (or 128-point) FFT. Given a series of ECG points (Figure 1A), TWA is estimated as 2, 17:
with the “alternans peak” being the amplitude of the FFT power spectrum corresponding to 0.5 cycles/beat and the mean (μnoise) and standard deviation (σnoise) of the spectral noise estimated in a predefined noise window from 0.431 to 0.460 cycles/beat (Figure 1B).
Figure 1.
(A) Example of R-wave based, time aligned points in the T-wave. (B) Example of a power spectrum indicating the presence of alternans at 0.5 cycles/beat and the noise window at 0.431-0.460 cycles/beat.
The alternans voltage is a direct measure of the presence of alternans while the Kscore is a measure of the statistical significance of the alternans voltage. For example, a Kscore ≥ 3 indicates that with 99.7% confidence, the alternans voltage is significantly greater than the noise.
It has been established that for body surface ECG signals, all three of the following conditions must be met in order to classify an alternans test as positive 14: (i) Kscore ≥ 3, (ii) alternans voltage ≥ 1.9 μV and (iii) alternans noise ≤ 1.8 μV.
Results
Phase Resetting in Human ECG Data
A ”bad” beat in an ABABABAB… type sequence of T-wave morphologies may result in an ABABNABA… type sequence (where N indicates a “bad” beat) 9, in which case the “bad” beat introduces phase resetting. In Figure 1S of the Online Supplement, we quantitatively demonstrate that a “bad” beat which causes phase resetting shifts the alternans peak of the power spectrum (Figure 1) to neighboring frequencies and thus may be detrimental to the alternans estimation.
Accordingly, in Figure 2S of the Online Supplement, in computer simulated data we demonstrate that in the presence of phase resetting (of a 128-point sequence), alternans estimation using the sum of the power-spectrum amplitude at frequencies greater than 0.4922 cycles/beat is more accurate than using only the power spectrum amplitude at 0.5 cycles/beat.
Comparison of Median, Average and Odd/Even Median Beat Replacement
We statistically analyzed the effect of replacing a “bad” point in a time series with either (i) an average or (ii) a median value estimated from all good points, or (iii) an odd/even median value estimated from all good odd/even points, depending on whether the “bad” point was in an odd or even position.
We generated 128-point long time series exhibiting alternans-type oscillations (from a zero mean Gaussian distribution with standard deviation values 0.1, 1.0, 2.0, 5.0, 10.0, and 100.0 μV) and introduced a “bad” point at a fixed location within the good 128-point sequence, generating 1000 time series for each “bad” point. We repeated this process each time introducing a different “bad” point from the 1st to the 64th point in the series. Finally, we estimated the mean and standard deviation of the Kscore of each of the 1000 simulations using each of the three methods (i)–(iii) described above.
For each value of the standard deviation and for each “bad” point index we obtained the distribution of the Kscore values normalized to the corresponding Kscore value with no “bad” points. We found that the normalized Kscore distribution (for each of the six standard deviation values) resulting from the average beat replacement (i) was significantly different (p<0.0001) compared to the odd/even median replacement (iii) but was not different compared to the overall median beat replacement (ii).
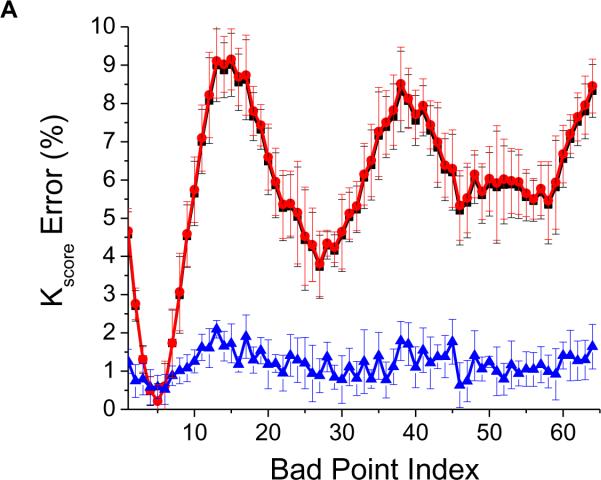
We then estimated the mean and standard deviation of the normalized Kscore distributions across all standard deviation values using each of the three described methods (i)–(iii). In Figure 2A, we plot the mean and standard deviation of the percent Kscore error of each of the three methods for each “bad” point index. We see that albeit small, the overall average and overall median point replacement of a “bad” point results in a maximum of 10% error of the estimated Kscore, while replacement with an appropriate odd/even median point essentially eliminates such variation (~1% error for each “bad” point index).
Figure 2.
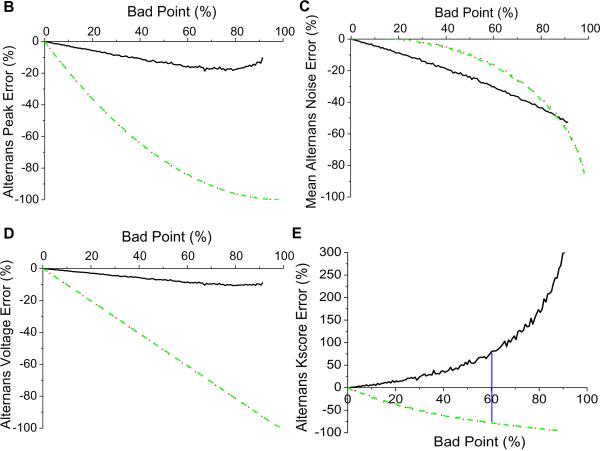
Comparison of the effect of replacing a “bad” point with an overall average, an overall median or a corresponding odd or even median point. (A) Mean and standard deviation of the Kscore percentage (normalized to a sequence with no “bad” points) resulting from 1000 simulations for each “bad” point index. The curves demonstrate the impact of replacing a “bad” point with an overall average point (-∎-), an overall median point (-●-) or a corresponding odd or even median point (-▴-), plotted as a function of the “bad” point index. In the remaining panels, we present the percent error in the estimation of (B) the alternans peak, (C) mean alternans noise, (D) alternans voltage and (E) Kscore. Note that that the curves corresponding to the overall median and overall average results are superimposed; solid line: odd/even median, dotted line: overall median, dashed line: overall average.
To further evaluate the effect of each of the above three methods, we employed 1000 alternating 128-point long time series taken from a distribution with zero-mean and 5.0 μV standard deviation. We then introduced a variable number of “bad” points at random locations within the 128-point sequence and estimated the spectra, thus creating 1000 time series for the same number of “bad” points. We repeated this process each time introducing a different number of “bad” points, ranging from zero to 98% of the total number of points (128) in the time series. Finally, we estimated the percent error of the alternans peak, alternans voltage, noise and Kscore for each number of bad points using each of the three previously described methods (i)–(iii).
In Figure 2B, we observe that the error in estimating the alternans peak is significantly smaller when using the odd/even median compared to the overall average or the overall median methods. Similar trends are seen with the alternans noise (Figure 2C) and the mean alternans voltage (Figure 2D). However, when using the odd/even median replacement method, because the noise decreases at a faster rate than the alternans peak, the Kscore increases as the percentage of “bad” points increases (Figure 2E). This happens because substitution of “bad” points with an odd/even median reduces the variability of the time series and thus reduces the amplitude of the noise. The opposite happens when a “bad” point is replaced with the overall average or the overall median.
Interestingly, based on the conventional maximum allowable 10% threshold of “bad” points14, the error in estimating the alternans voltage using odd/even median replacement is 5.2%, while the error is −21.1% and −23.3% using the overall median or the overall average, respectively, which represents a ~4 fold reduction in the alternans voltage error. Using the same 10% threshold, the error in estimating the Kscore is −2.7% using odd/even median replacement, while the error is −19.3% and −19.4% using the overall median or the overall average, respectively, representing a ~7 fold reduction in the Kscore error.
In summary, replacement of a “bad” point with an odd/even median produced significantly smaller errors compared to the overall average or overall median for “bad” point percentages less than 60%, where the Kscore error using the odd/even median method is the same compared to the overall average or overall median methods (Figure 2E). As the percentage of bad points exceeds the 60% mark, the odd/even median point substitution increases the Kscore error compared to the other two methods, which suggests that beyond this percentage the number of false positives compared to the other two methods would be higher.
Effect of the Estimated Alternans Noise on the Alternans Voltage Threshold
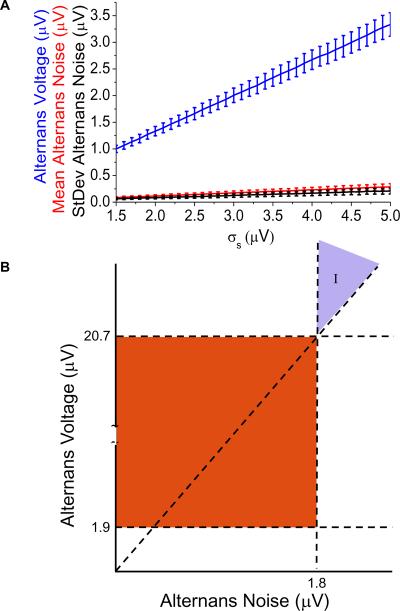
To evaluate the effect of the power spectrum estimated alternans noise on the value of the alternans voltage and Kscore, we generated one thousand, 128-point long alternating time series with zero mean and standard deviation (σs) values ranging from 1.5 μV to 5 μV to represent typical ECG values. We estimated the alternans voltage, mean alternans noise, standard deviation of the alternans noise and Kscore and plotted them for each σs value (Figure 3). While the Kscore was relatively constant (314 ± 207) with respect to the increased amplitude of the alternating signal (data not shown), in Figure 3A we observe that the alternans voltage maintains a linear relationship with the amplitude of the alternating signal (mean alternans voltage = 0.66788 * σs - 0.00398, p<0.0001). We see similar linear relationships with the estimated mean alternans noise (mean alternans noise = 0.05791 * σs- 1.45207E-4, p<0.0001) and the standard deviation of the alternans noise (standard deviation of the alternans noise = 0.0424 * σs - 6.18417E-4, p<0.0001). Then, we can directly relate the mean alternans voltage and mean alternans noise as follows:
| (Eq 1) |
Figure 3.
Effect of the power spectrum estimated noise on the alternans voltage and Kscore thresholds. (A) The mean and standard deviation of the estimated alternans voltage (blue), mean (red) and standard deviation (black) of the noise are plotted for each value of σs. (B) Traditional and a potentially new area of alternans positive results by reclassifying formerly indeterminate (I) results.
Thus, consideration should be given to the amplitude of the mean alternans noise when the alternans voltage threshold is used to determine statistically significant alternans. Traditionally, alternans is considered present when the alternans voltage exceeds 1.9 μV and the alternans noise is less than 1.8 μV (the red zone in Figure 3B). However, in the absence of random noise, we show statistically significant alternans can be considered present when the alternans voltage exceeds the alternans noise by a factor of at least 11.53 (Eq 1), regardless of the alternans noise level. Thus, in Figure 3B, we see a new area for alternans diagnosis is established: area (I), formerly a region of indeterminate alternans.
In area (I), where the alternans noise exceeds 1.8 μV, formerly indeterminate alternans tests can be considered positive when the alternans voltage exceeds the alternans noise by at least a factor of 11.53. This factor gives rise to a new alternans voltage threshold of greater than 20.76 μV when the alternans noise is greater than 1.8 μV.
Effect of Random Noise on the Alternans Estimation
To evaluate the effect of random noise on the alternans voltage and Kscore thresholds to determine statistically significant alternans, we generated one thousand 128-point long alternating time series with zero mean and standard deviation values ranging from 0.1 μV to 50 μV (σs), representing the alternating ECG signal. We then added random Gaussian noise with zero mean and standard deviation values ranging from 0.0 μV to 50.0 μV (σm), representing variable-origin input noise.
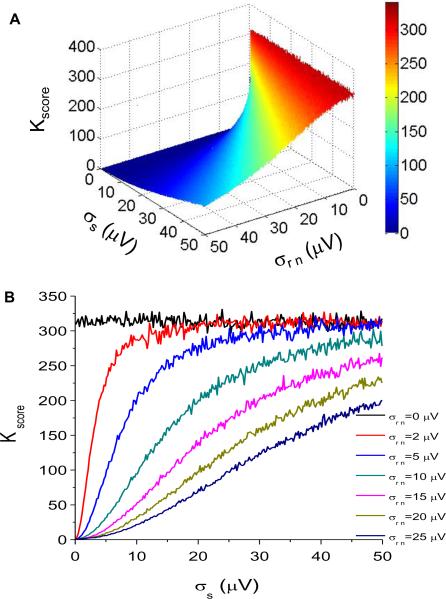
In Figure 4A, we plot the Kscore as a function of both the amplitude of the random noise added to the alternating time series and the signal amplitude. If we take cross-sections of Figure 4A for distinct random noise values, we obtain Figure 4B, which clearly demonstrates the effect of typical noise levels on Kscore. We observe that the presence of random noise markedly reduces the Kscore when the noise level exceeds roughly 25% of the signal level.
Figure 4.
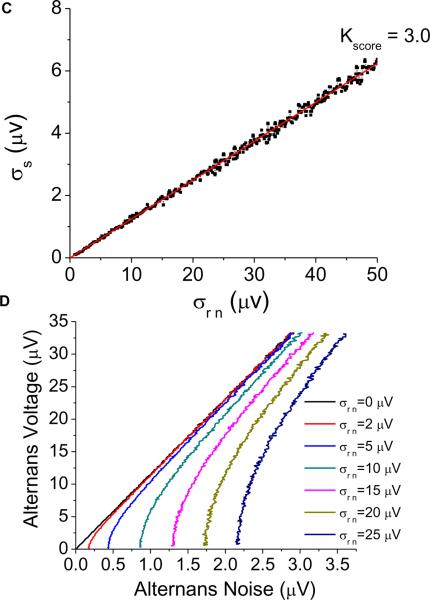
Effect of random noise on the alternans estimation. (A) Kscore as a function of the amplitude of random noise added to the alternating time series and the amplitude of the signal. (B) Kscore as a function of the amplitude of the signal for distinct random noise values. (C) Amplitude of the signal as a function of the amplitude of the noise for Kscore = 3.0 (σs = 0.1248 * σm − 0.0043; p<0.0001). (D) Alternans voltage as a function of the alternans noise for distinct random noise values.
In Figure 4C, we plot the amplitude of the random noise versus that of the signal (σs = 0.1248 * σrn - 0.0043; p<0.0001) for Kscore = 3.0, the clinically validated threshold. We observe that as the amplitude of the random noise increases, the amplitude of the alternating time series that yields a Kscore = 3.0 must also increase. Thus for random noise of 2–3 μV, the amplitude of the alternating time series must be at least 0.245–0.370 μV to result in Kscore = 3.0.
We used linear regression (repeating the process described earlier in Figure 3) to derive a direct relationship between the alternans voltage and the alternans noise for distinct random noise values. Using this approach, in Figure 4D, we plot the alternans voltage as a function of the alternans noise at multiple noise values and observe that only at σrn = 0 is this relationship perfectly linear (with equation specified by Eq 1).
Because random noise is directly quantifiable using a variety of techniques, we can employ a similar approach to that presented in Figure 3B to generate a new alternans voltage threshold as a function of alternans noise for any value of random noise. For example, for random noise of 5 μV, and for alternans noise of 1.8 μV, the corresponding alternans voltage threshold is 20.29 μV.
Thus, consideration should be given not only to the amplitude of the mean alternans noise but also to the random noise level when the alternans voltage threshold is used to determine statistically significant alternans. When the alternans voltage exceeds a threshold determined by the alternans noise and random noise levels, alternans can be considered present even when the alternans noise exceeds 1.8 μV. Clinically, this corresponds to the case where formerly indeterminate alternans in the presence of elevated noise can still be diagnosed as positive alternans, when the alternans voltage is sufficiently large. Therefore, this threshold adjustment may reduce the number of indeterminate results due to excessive noise.
Effect of Colored “Physiologic” Noise on the Alternans Voltage
We then investigated the effect of colored (i.e. physiologic or non-random) noise on the alternans estimation and the probability of a false positive result. Colored noise is used to reflect physiologic processes (such as respiration and heart rate) which may impact TWA estimation. For example, a respiration rate of A breaths (or cycles) per min in a subject whose heart rate is B beats per min could result in spectral interference at 0.5 cycles/beat. If A=30 cycles/min and B=60 beats/min, that would result in a spectral peak at A/B = 0.5 cycles/beat. A similar but smaller result could be expected with A=15 cycles/min, in which case a harmonic of the respiration frequency (at 0.25 cycles/beat) would appear at 0.5 cycles/beat.
We created one thousand, 128-point long random (not alternating) Gausian time series with zero mean and variable standard deviation values ranging from 0.1 μV to 10 μV (σs) representing the signal. We then added colored noise (at a frequency of 0.492, 0.496, or 0.500 cycles/beat) by applying a Butterworth IIR bandpass filter on a zero mean and variable standard deviation (ranging from 0.0 μV to 20.0 μV) sequence from a Gausian time series, representing variable origin input colored noise (σcn).
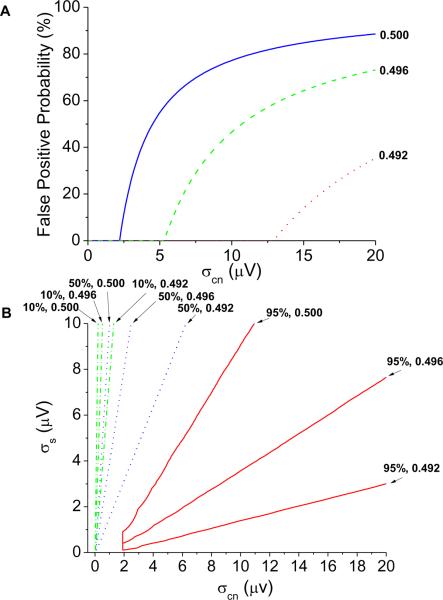
In Figure 5A, we quantify the probability of a false positive detection (Kscore ≥ 3.0 and alternans voltage > 1.9 μV in the absence of alternans) as a function of colored noise amplitude (at 0.492, 0.496, and 0.500 cycles/beat). At each colored noise frequency, the false positive probability is equal to the percentage of false positive detections at colored noise amplitudes less than or equal to the plotted colored noise amplitude. In Figure 5B, we quantify the probability of a false positive Kscore in the absence of alternans, as a function of signal amplitude and the same colored noise amplitudes. In the same figure, we plot the false positive Kscore percentages of 10%, 50%, and 95%. For each colored noise and signal combination, the false positive Kscore percentage is equal to the percentage of false positive Kscore at all points less than or equal to the colored noise and signal amplitudes.
Figure 5.
Effect of colored noise (at 0.492, 0.496, and 0.500 cycles/beat) on the alternans frequency and the probability for a false positive result. (A) The false positive probability (Kscore ≥ 3.0 and alternans voltage ≥ 1.8 μV) in the absence of alternans quantified as a function of colored noise amplitude. (B) False positive Kscore (Kscore ≥ 3.0) in the absence of alternans quantified as a function of signal amplitude and colored noise amplitude. The false positive Kscore percentages of 10%, 50%, and 95% are plotted. For each colored noise & signal combination, the false positive Kscore percent is equal to the percentage of false positive Kscores at all points less than or equal to the colored noise and signal amplitudes.
As the colored noise frequency approaches 0.500 cycles/beat, and as the colored noise amplitude increases, the alternans voltage is over-estimated, and the probability of a false positive detection increases. Therefore, appropriate methods to quantify the effect of colored noise sources (specifically due to respiration) near 0.500 cycles/beat are essential in eliminating problematic data segments and thus reducing the false positive detection rate.
Effect of Colored “Physiologic” Noise on the Estimated Alternans Noise
We next investigated the effect of colored noise on the noise band and the probability of a false negative result. We created one thousand, 128-point long random (not alternating) time series with zero mean and variable standard deviation values ranging from 1 μV to 100 μV (σs) representing the signal. We then added colored noise with zero mean and variable standard deviation values, ranging from 0.0 μV to 20.0 μV (σn), representing variable origin input colored noise.
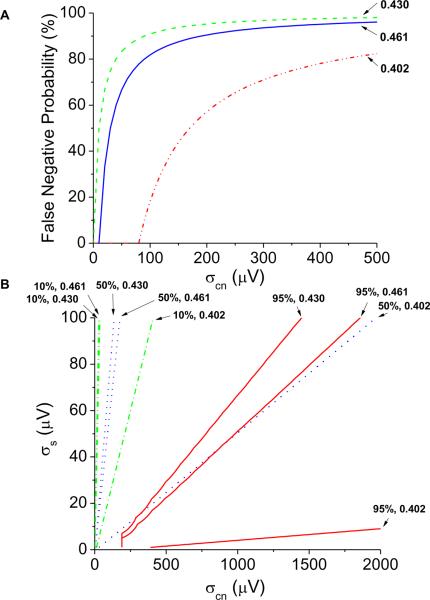
In Figure 6A, we quantify the probability of a false negative detection (alternans voltage ≤ 1.8 μV in the presence of alternans) as a function of colored noise amplitude (at 0.402, 0.430, and 0.461 cycles/beat). The false negative probability is equal to the percent of false negative detections at colored noise amplitudes less than or equal to the plotted colored noise amplitude. In Figure 6B, we quantify the probability of a false negative Kscore (Kscore < 3) in the presence of significant alternans as a function of colored noise amplitude at the same frequencies. False negative Kscore percentages of 10%, 50%, and 95% are plotted. For each colored noise and signal combination, the false negative Kscore percent is equal to the percentage of false negative Kscores at all points less than or equal to the colored noise and signal amplitudes. As colored noise enters into the noise frequency band, the alternans noise is overestimated, the alternans voltage is under-estimated, and the probability of a false negative detection increases. These findings suggest that methods to quantify the respiratory rate may prohibit the respiratory contribution on the noise band, thereby reducing the false negative detection rate.
Figure 6.
Effect of colored noise (at 0.402, 0.430, and 0.461 cycles/beat) on the noise band and the probability for a false negative result. (A) The false negative probability (alternans voltage ≤ 1.8 μV) in the presence of alternans quantified as a function of the colored noise amplitude. (B) False negative Kscore (Kscore < 3) in the presence of alternans quantified as a function of the colored noise amplitude. False negative Kscore percentages of 10%, 50%, and 95% are plotted. For each colored noise and signal combination, the false negative Kscore percent is equal to the percentage of false negative Kscores at all points less than or equal to the colored noise and signal amplitudes.
Discussion
While the FFT spectral method provides a robust quantitative assessment of the alternans amplitude compared to the amplitude of the noise, recent clinical studies have questioned the overall clinical utility of TWA11, 18.
In this study, we show that there are naturally occurring processes that may hamper the alternans estimation and affect the overall accuracy of the method. Specifically, we show that the handling of “bad” beats has a significant impact on the estimation of alternans and that replacing a “bad” point with an odd/even median is a more accurate approach than replacing it with the overall average or the overall median beat. Second, phase resetting may have a significant effect on the alternans estimation and estimation of alternans from frequencies greater than 0.4922 cycles/beat in a 128-point FFT provides the most accurate approach for estimating the alternans voltage and Kscore when phase resetting is likely to occur. Third, alternans noise greater than 1.8 μV has a significant effect on alternans voltage estimation, and the alternans voltage threshold should be directly proportional to the level of the alternans noise within this range, to decrease the number of indeterminate TWA tests due to excessive noise. Fourth, random noise has a significant effect on the alternans voltage, noise, and Kscore estimation and must also be considered when adjusting the alternans voltage threshold at alternans noise levels greater than 1.8 μV. Finally, colored noise that coincides with or is near the alternans frequency may lead to a false positive result while colored noise that falls on the noise band may lead to a false negative result; therefore, methods that estimate the effect of heart and respiratory rates on alternans noise and alternans peak estimation are needed to assign a probability to whether a TWA test is a true positive or negative.
From a clinical perspective, recent studies have suggested that anywhere from 19–41% of patients have an indeterminate TWA test result10–13, with causes of indeterminancy including excessive ventricular ectopy, inadequate heart rate, unsustained alternans and excessive noise. The presence of excessive ventricular ectopy (i.e. bad beats) represents the most common cause of indeterminancy in clinical settings19 and has important prognostic implications20. Our analysis suggests that replacing a bad beat with a median odd or even beat is a much more robust approach than replacing with an average beat. Our data also suggest that rather than using a single threshold for alternans voltage and noise, use of customized thresholds for alternans voltage and Kscore, even when the noise is greater than 1.8 μV, may significantly reduce the number of indeterminate tests due to excessive noise.
Additionally, although the negative predictive value of TWA testing has generally been good, low positive predictive value, in addition to high rates of indeterminate results, has hampered the broad acceptance of TWA testing 6, 14. Although an effort has been made to reduce the effect of respiration on the alternans estimation21, in this study, we have shown that, if not properly addressed (i.e. in ambulatory monitoring), the alternans estimation may be impacted by physiologic parameters such as heart rate and respiration7, which may revert the alternans outcome (i.e. turn a positive result into a negative result and vice versa). Algorithms to account for physiologic sources of noise as outlined in this paper may have an important impact on improving the positive predictive value of TWA testing and enhancing its clinical utility.
In conclusion, physiological processes (i.e. PVCs) as well as random and colored (i.e. due to respiration) noise may hamper the estimation of TWA. This study investigates the conditions under which a PVC, random and colored noise introduce significant error in the estimation of TWA and proposes methods to overcome these limitations.
Supplementary Material
Acknowledgments
Funding Sources: The work was supported by a Scientist Development Grant (#0635127N) from the American Heart Association, by NIA grant 1R21AG035128 and NIH grant 1RO1HL103961. This work was also supported by a Fellowship and a Science Award from the Center for Integration of Medicine and Innovative Technology (CIMIT), the Deane Institute for Integrative Research in Atrial Fibrillation and Stroke and the Cardiovascular Research Society.
Footnotes
Publisher's Disclaimer: This is a PDF file of an unedited manuscript that has been accepted for publication. As a service to our customers we are providing this early version of the manuscript. The manuscript will undergo copyediting, typesetting, and review of the resulting proof before it is published in its final citable form. Please note that during the production process errors may be discovered which could affect the content, and all legal disclaimers that apply to the journal pertain.
Conflicts of interest: T Mela – Medtronic, Biotronik, St. Jude, all modest No other conflict reported
References
- 1.Smith JM, Rosenbaum DS, Cohen RJ. Variability in surface ECG morphology: signal or noise? Comput Cardiol. 1988;14:257–260. [PubMed] [Google Scholar]
- 2.Rosenbaum DS, Jackson LE, Smith JM, et al. Electrical alternans and vulnerability to ventricular arrhythmias. N Engl J Med. 1994;330:235–241. doi: 10.1056/NEJM199401273300402. [DOI] [PubMed] [Google Scholar]
- 3.Ikeda T, Sakata T, Takami M, et al. Combined assessment of T-wave alternans and late potentials used to predict arrhythmic events after myocardial infarction. A prospective study. J Am Coll Cardiol. 2000;35:722–730. doi: 10.1016/s0735-1097(99)00590-2. [DOI] [PubMed] [Google Scholar]
- 4.Zareba W, Moss AJ, le Cessie S, Hall WJ. T wave alternans in idiopathic long QT syndrome. J Am Coll Cardiol. 1994;23:1541–1546. doi: 10.1016/0735-1097(94)90653-x. [DOI] [PubMed] [Google Scholar]
- 5.Armoundas AA, Hohnloser SH, Ikeda T, Cohen RJ. Can microvolt T-wave alternans testing reduce unnecessary defibrillator implantation? Nat Clin Pract Cardiovasc Med. 2005;2:522–528. doi: 10.1038/ncpcardio0323. [DOI] [PubMed] [Google Scholar]
- 6.Armoundas AA, Tomaselli GF, Esperer HD. Pathophysiological basis and clinical application of T-wave alternans. J Am Coll Cardiol. 2002;40:207–217. doi: 10.1016/s0735-1097(02)01960-5. [DOI] [PubMed] [Google Scholar]
- 7.Rosenbaum DS, Albrecht P, Cohen RJ. Predicting sudden cardiac death from T wave alternans of the surface electrocardiogram: promise and pitfalls. J Cardiovasc Electrophysiol. 1996;7:1095–1111. doi: 10.1111/j.1540-8167.1996.tb00487.x. [DOI] [PubMed] [Google Scholar]
- 8.Armoundas AA. Assessment of cardiac electrical stability. Biomedical Engineering, Boston University; Boston: 1994. [Google Scholar]
- 9.Hashimoto H, Suzuki K, Nakashima M. Effects of the ventricular premature beat on the alternation of the repolarization phase in ischemic myocardium during acute coronary occlusion in dogs. J Electrocardiol. 1984;17:229–238. doi: 10.1016/s0022-0736(84)80059-x. [DOI] [PubMed] [Google Scholar]
- 10.Chow T, Kereiakes DJ, Onufer J, et al. Does microvolt T-wave alternans testing predict ventricular tachyarrhythmias in patients with ischemic cardiomyopathy and prophylactic defibrillators? The MASTER (Microvolt T Wave Alternans Testing for Risk Stratification of Post-Myocardial Infarction Patients) trial. J Am Coll Cardiol. 2008;52:1607–1615. doi: 10.1016/j.jacc.2008.08.018. [DOI] [PubMed] [Google Scholar]
- 11.Gold MR, Ip JH, Costantini O, et al. Role of microvolt T-wave alternans in assessment of arrhythmia vulnerability among patients with heart failure and systolic dysfunction: primary results from the T-wave alternans sudden cardiac death in heart failure trial substudy. Circulation. 2008;118:2022–2028. doi: 10.1161/CIRCULATIONAHA.107.748962. [DOI] [PMC free article] [PubMed] [Google Scholar]
- 12.Costantini O, Hohnloser SH, Kirk MM, et al. The ABCD (Alternans Before Cardioverter Defibrillator) Trial: strategies using T-wave alternans to improve efficiency of sudden cardiac death prevention. J Am Coll Cardiol. 2009;53:471–479. doi: 10.1016/j.jacc.2008.08.077. [DOI] [PubMed] [Google Scholar]
- 13.Chow T, Kereiakes DJ, Bartone C, et al. Prognostic utility of microvolt T-wave alternans in risk stratification of patients with ischemic cardiomyopathy. J Am Coll Cardiol. 2006;47:1820–1827. doi: 10.1016/j.jacc.2005.11.079. [DOI] [PubMed] [Google Scholar]
- 14.Bloomfield DM, Hohnloser SH, Cohen RJ. Interpretation and classification of microvolt T wave alternans tests. J Cardiovasc Electrophysiol. 2002;13:502–512. doi: 10.1046/j.1540-8167.2002.00502.x. [DOI] [PubMed] [Google Scholar]
- 15.Nearing BD, Huang AH, Verrier RL. Dynamic tracking of cardiac vulnerability by complex demodulation of the T wave. Science. 1991;252:437–440. doi: 10.1126/science.2017682. [DOI] [PubMed] [Google Scholar]
- 16.Weiss EH, Merchant FM, d'Avila A, et al. A novel lead configuration for optimal spatio-temporal detection of intracardiac repolarization alternans. Circ Arrhythm Electrophysiol. 2011 Jun;1:407–417. doi: 10.1161/CIRCEP.109.934208. [DOI] [PMC free article] [PubMed] [Google Scholar]
- 17.Smith JM, Clancy EA, Valeri CR, Ruskin JN, Cohen RJ. Electrical alternans and cardiac electrical instability. Circulation. 1988;77:110–121. doi: 10.1161/01.cir.77.1.110. [DOI] [PubMed] [Google Scholar]
- 18.Myles RC, Jackson CE, Tsorlalis I, et al. Is microvolt T-wave alternans the answer to risk stratification in heart failure? Circulation. 2007;116:2984–2991. doi: 10.1161/CIRCULATIONAHA.107.699918. [DOI] [PubMed] [Google Scholar]
- 19.Merchant FM, Zheng H, Ikeda T, et al. Clinical utility of microvolt T-wave alternans testing in identifying patients at high or low risk of sudden cardiac death. Heart Rhythm. 2011;8:S206. doi: 10.1016/j.hrthm.2012.03.014. [DOI] [PMC free article] [PubMed] [Google Scholar]
- 20.Narayan SM, Smith JM, Schechtman KB, Lindsay BD, Cain ME. T-wave alternans phase following ventricular extrasystoles predicts arrhythmia-free survival. Heart Rhythm. 2005;2:234–241. doi: 10.1016/j.hrthm.2004.12.010. [DOI] [PubMed] [Google Scholar]
- 21.Cambridge Heart I . CH 2000 Cardiac Diagnostic System.CH 2000. Bedford, MA: [Google Scholar]
Associated Data
This section collects any data citations, data availability statements, or supplementary materials included in this article.


