

Abstract
Purpose
To examine gene expression differences between pre- and post-NST specimens of breast cancers and identify biological changers that may lead to new therapeutic insights.
Methods
Gene expression data from pre-chemotherapy fine needle aspiration specimens were compared to resected residual cancers in 21 patients after 4-6 months of NST. We removed stroma-associated genes to minimize confounding effects. PAM50 was used to assign molecular class. Paired t-test and gene set analysis were used to identify differentially expressed genes and pathways.
Results
The ER and HER2 status based on mRNA expression remained stable in all but two cases and there were no changes in proliferation metrics (Ki67 and PCNA expression). Molecular class changed in 8 cases (33.3%) usually to normal-like class and which was associated with low residual cancer cell cellularity. The expression of 200-600 probe sets changed between baseline and post-NST samples. In basal-like cancers, pathways driven by increased expression of PI3K, small G proteins and CAMK2 and energy metabolism were enriched while immune cell-derived and the sonic hedgehog pathways were depleted in residual cancer. In non-basal-like breast cancers, notch signaling and energy metabolism (e.g. fatty acid synthesis) were enriched and sonic hedgehog signaling and immune-related pathways were depleted in residual cancer. There was no increase in epithelial mesenchymal transition or cancer stem cell signatures.
Conclusions
Our data indicates that energy metabolism related processes are up-regulated and immune related signals are depleted in residual cancers. Targeting these biological processes may represent promising adjuvant treatment strategies for patients with residual cancer.
Keywords: Breast Cancer, Neaodjuvant chemotherapy, Gene expression, Residual disease
Introduction
Neoadjuvant systemic therapy (NST) provides an opportunity to directly assess the chemotherapy sensitivity of breast cancer and also benefits patients with tumor down staging and lesser surgery.1 Residual cancer volume after NST carries important prognostic information, and attaining a pathologic compete response (pCR: absence of invasive cancer in the breast and lymph nodes) heralds excellent long term survival.2-5 Conversely, patients with residual cancer have variable prognosis. Some patients, particularly those with estrogen receptor (ER)-positive cancer have good survival despite residual cancer, others, particularly those with triple receptor negative cancer have poor prognosis if they have residual disease.3-5 NST with anthracycline and/or taxane-containing regimens results in pCR rates between 6% to 30% depending on tumor grade and receptor status.6-8 Because of the clear association between residual cancer burden and survival, NST is an in-vivo screen for efficacy of neoadjuvant chemotherapies. However, despite the well recognized poor prognosis of ER- and HER2-negative patients with residual cancer after neoadjuvant chemotherapy, no effective adjuvant therapy exists for this population.
One approach to increase treatment efficacy is to develop regimens that induce higher rates of pCR; the combination of trastuzumab and chemotherapy represents a successful example of this approach.9 Another strategy could be to develop biologically targeted post-NST, adjuvant therapies that exploit the vulnerabilities of the residual cancer. Such approach will first require detailed molecular characterization of residual cancer and definition of targetable molecular pathways. The purpose of the current analysis was to compare matched gene expression profiles of pretreatment cancer with residual cancer after NST. We assessed changes in molecular class defined by the PAM50 classifier; changes in ER, Ki67 (PCNA), and HER2 status based on mRNA expression and also identified individual genes and gene sets that were differentially expressed between the matched specimens to define molecular pathways that appear to be enriched in post-NST residual cancer.
Methods
Patients and Tumor tissues
Pre-chemotherapy fine needle aspirates (FNA) were collected in the context of a prospective biomarker discovery program conducted at MD Anderson Cancer Center. Matching post-chemotherapy frozen surgical specimens were retrieved from the institutional tumor bank, patients with pCR were excluded from the search. We identified 25 cases with matching specimens, 21 of these patients received NST. The remaining 4 cases with matching FNA biopsy and surgical tissue without NST were used to estimate methodological variability in repeat gene expression data from the same cancer. Patient characteristics for the 21 patients who received NST are in Supplementary Table 1. The amount of residual cancer was determined by routine pathology exam of lumpectomy or mastectomy specimens. In addition, we also performed molecular class prediction on paired FNA and core needle biopsies obtained during one biopsy session, without any intervening chemotherapy from 37 cancers to assess the sensitivity of the classification method to tissue sampling.10 This research was approved by the institutional review board and all patients signed informed consent to allow biomarker studies performed on their specimens.
RNA Extraction and Gene Expression Profiling
RNA was extracted from the FNA and surgical tumor samples using the RNAeasy Kit (Qiagen, Valencia, CA). The amount and quality of RNA were assessed with DU-640 UV Spectrophotometer (Beckman Coulter, Fullerton, CA), and they were considered adequate for further analysis if the optical density260/280 ratio was ≥1.8 and the total RNA yield was ≥1μg. cRNA generation, second-strand cDNA synthesis and gene expression profiling with Affymetrix HG-U133A gene chips (Santa Clara, CA) were performed as described previously.10-12 The 25 matching pre- post-NST gene expression data is available under GEO (Gene Expression Omnibus) accession number GSE 32072 and the 37 matching FNA and core biopsy data is available under accession number GSE 32518.
Data Analysis
All gene expression data was normalized with MAS5 algorithm, mean centered to 600 and log2 transformed before further analysis. We removed from further analysis probe sets with average expression values ≤ the lowest 25% to reduce noise from low expressed probe sets and also excluded stroma related genes (n=1618 probe sets), (Supplementary Table 2) that were defined in a previous publication.10 Stromal genes were removed from the analysis in order to minimize false discovery due to the different tissue composition of the pretreatment FNA and post-chemotherapy surgically resected tissues.13 Paired t-test was used to identify differentially expressed genes between cohorts and false discovery rates (FDR) were calculated by the Benjamini and Hochberg permutation method.14 Differentially expressed genes were defined from the entire data set as well as from basal-like (n=9) and non-basal like (n=12) cancers separately. The function of the differentially expressed genes were mapped to biological pathways using the Ingenuity Pathway Analysis software (IPA, http://www.ingenuity.com/). We also examined changes in the mRNA expression values of ESR1 (“205225_at”) and ERBB2/HER2 (“212022_s_at”) receptors and the proliferation markers Ki67 (,“216836_s_at”) and PCNA (201202_at). An ESR1 mRNA probe set expression value of >10.18 were considered as ER-positive, and HER2 probe set expression value >12.54 were considered HER2-positve based on a previously established thresholds.10,15 Molecular class assignment was performed by using the PAM50 method, briefly, we calculated Spearman’s rank correlation between each sample and each subtype centroid and assigned the class of the most highly correlated centroid to each sample. 16 Six (ANLN, CDCA1, CXXC5, GPR160, TMEM45B, UBE2T) of the 50 genes that are included in the PAM50 predictor could not be mapped to the Affymetrix HGU133A chip, the remaining 44 genes were used for molecular class prediction. PAM50 class concordance rate was calculated using the number of matched pairs that were assigned to the same subtypes divided by the total number of matched pairs. We also used gene set analysis (GSA) to assess changes in a priori defined gene set before and after chemotherapy.17 In this analysis we included 235 canonical biological pathways from IPA and two additional gene sets (Mego et al., n=254 genes, Creighton et al., n=230 genes) previously reported to be associated with residual disease after NST in breast cancer (Supplementary Table 3).18,19 All analysis was performed using BRB Array Tools v 4.1.0 (http://linus.nci.nih.gov/BRB-ArrayTools.html) and R software v 2.7.2 (http://www.r-project.org).20 Significance was estimated with permutation test (n=1000). The null hypothesis was that the average degree of differential expression of members of a given gene set between the pre- and post-NST samples was the same as expected from a random set of genes of similar size.
Results
Changes in estrogen receptor and HER2 expression and proliferation measures
First, we assessed changes in individual molecules with therapeutic and prognostic relevance. Pre- and post-treatment ER and HER2 levels were highly correlated, the Spearman’s rank correlation coefficients were R=0.706 and 0.836, respectively. The ER status before and after NST changed from ER-negative to ER-positive on one case and from ER-positive to -negative in another case (Figure 1A). HER-2 status also changed in two cases in a similar manner (Figure 1B). Interestingly, among the HER2-negative (n=18) cancers ERBB2 mRNA levels were slightly but significantly higher in the post-NST samples (P=0.011, unadjusted for multiple comparisons). However, this was not sufficient to alter HER2 status in any but one case indicating relative stability and robustness of ER and HER2 status. The pre- and post treatment expression levels of proliferation markers Ki67 and PCNA were moderately correlated, Spearman’s rank correlation coefficients were R=0.301 and 0.395, respectively (Figures 1C and 1D). There were no significant differences in proliferation measures between pre- and post-NST samples across all cases or when ER-positive and negative cases were examined separately (data not shown). The ER, HER2 and Ki67 or PCNA expression levels did not change significantly in any of the 4 control specimens that received no NST.
Figure 1.
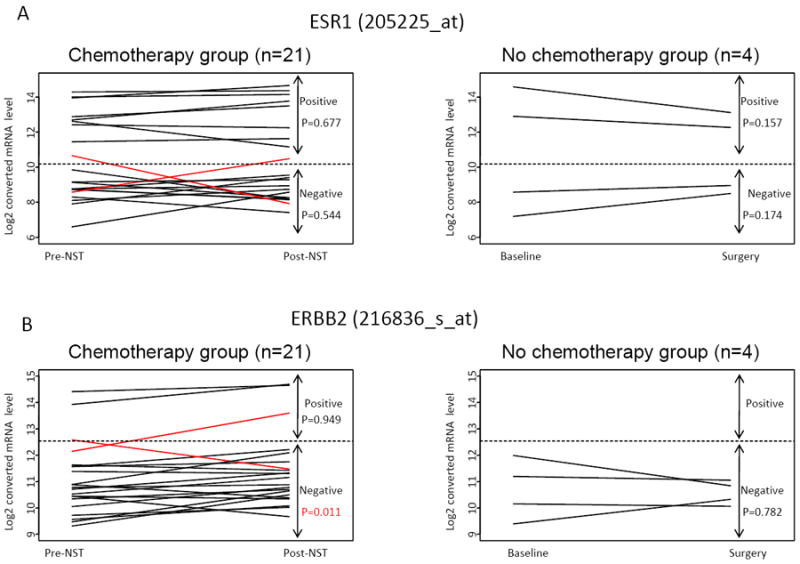
Gene expression levels of ESR1 (A), ERBB2 (B), MiK67(C) and PCNA (D) in pre- and post- neoadjuvant chemotherapy samples (n=21). P-values were calculated from paired t-test comparing pre- and post-treatment groups and are not adjusted for multiple comparisons.
Changes in molecular class before and after chemotherapy
Next, we examined the stability of molecular class in the 21 pre- and post-NST specimens. Table 1 shows the class assignment of each sample including the correlation values to each reference class centroid (the larger the correlation coefficient, the greater similarity the sample has to a given centroid and class is determined by the largest coefficient). There were eight cases in which the molecular subtype by PAM50 changed between pre- and post-chemotherapy samples corresponding to an overall concordance rate of 62%. Most of the time (6 of 8 samples), the change was to normal-like cancer in the post-NST sample; this was accompanied by an increase in the correlation coefficient for the normal-like centroid and decrease in the correlation to the original class centroid. In 3 cases the molecular class changed from basal-like to normal, in 2 cases from luminal A to Normal, and in one case each from HER2-enriched to normal. The residual cancer cellularity in many of these cases were low, 10%, 20%, 30% (in two cases it remained relatively high 50% and 60%) (Table 1). One case changed from HER2-enriched to luminal B, and another from normal to basal-like. In four cases the changes in the correlation metrics were quite large indicating substantial change in the gene expression pattern of the 44 genes that were used for classification. In the remaining cases, relatively small scale changes in correlation values altered the class assignment that suggests less than ideal robustness of the class assignment method under these circumstances. When PAM50 was applied to the baseline FNA and the surgical specimen of the four control cases there were no changes in the molecular subtype of the pairs. To further assess the effect of tissue sampling on molecular class assignment, we also applied the PAM50 predictor to 37 matching FNA and core biopsies that were collected simultaneously before any chemotherapy.10 Molecular class changed for the same tumor depending on sampling method in 6 cases corresponding to an overall concordance rate of 83% (Supplementary Table 4). These observations indicate that alterations in tissue cellularity due to chemotherapy or due to sampling method can introduce substantial variability to molecular class prediction.
Table 1.
PAM50 prediction results of the 21 pre- and post-chemotherapy cases
| Pre-chemo (FNA) | Post-chemo (surgical excision) | ||||||||||||
|---|---|---|---|---|---|---|---|---|---|---|---|---|---|
| Correlation coefficient to each centriod | Correlation coefficient to each centriod | % residual tumor cellularity | |||||||||||
| Sample ID | subtype | Basal | Her2 | LumA | LumB | Normal | subtype | Basal | Her2 | LumA | LumB | Normal | |
| 703 | Normal | 0.006 | -0.07 | 0.156 | -0.329 | 0.302 | Normal | 0.01 | 0.027 | 0.221 | -0.351 | 0.282 | 40 |
| 647 | Basal | 0.376 | -0.141 | -0.093 | -0.356 | 0.291 | Basal | 0.566 | 0.183 | -0.428 | -0.052 | -0.106 | 40 |
| 604 | LumA | -0.525 | -0.376 | 0.679 | 0.027 | 0.153 | LumA | -0.484 | -0.252 | 0.585 | 0.069 | -0.026 | 60 |
| 595 | Her2 | 0.062 | 0.569 | -0.278 | 0.083 | -0.205 | Her2 | 0.197 | 0.511 | -0.521 | 0.151 | -0.353 | 60 |
| 569 | LumA | 0.021 | -0.196 | 0.219 | -0.169 | 0.113 | LumA | -0.549 | -0.34 | 0.689 | -0.101 | 0.195 | 50 |
| 566 | LumA | -0.243 | -0.312 | 0.523 | -0.227 | 0.385 | Normal | -0.13 | -0.261 | 0.285 | -0.222 | 0.309 | 30 |
| 570 | Basal | 0.624 | -0.111 | -0.294 | -0.464 | 0.292 | Basal | 0.461 | -0.159 | -0.135 | -0.381 | 0.286 | 30 |
| 521 | Basal | 0.681 | 0.002 | -0.442 | -0.274 | 0.155 | Basal | 0.615 | 0.159 | -0.52 | -0.145 | 0.041 | 70 |
| 439 | Basal | 0.219 | 0.212 | -0.066 | -0.264 | 0.151 | Normal | 0.16 | 0.195 | -0.122 | -0.355 | 0.216 | 20 |
| 380 | Her2 | 0.119 | 0.141 | -0.311 | 0.088 | -0.173 | LumB | -0.259 | 0.321 | -0.156 | 0.533 | -0.41 | 60 |
| 364 | LumA | -0.221 | -0.312 | 0.482 | -0.208 | 0.326 | LumA | -0.484 | 0.023 | 0.501 | 0.055 | 0.026 | 50 |
| 312 | Basal | 0.539 | -0.047 | -0.223 | -0.485 | 0.358 | Normal | 0.363 | -0.162 | 0.113 | -0.574 | 0.481 | 50 |
| 208 | LumA | -0.501 | -0.386 | 0.677 | -0.085 | 0.137 | LumA | -0.542 | -0.19 | 0.639 | 0.053 | 0.116 | 60 |
| 572 | Basal | 0.642 | 0.129 | -0.4 | -0.254 | 0.098 | Normal | 0.191 | -0.014 | 0.035 | -0.434 | 0.349 | 10 |
| 151 | Basal | 0.406 | 0.177 | -0.284 | -0.228 | 0.107 | Basal | 0.491 | 0.204 | -0.27 | -0.365 | 0.135 | not available |
| 269 | LumA | -0.265 | -0.208 | 0.42 | 0.11 | -0.105 | LumA | -0.165 | -0.4 | 0.647 | -0.511 | 0.589 | not available |
| 307 | Her2 | 0.163 | 0.31 | -0.057 | -0.34 | 0.181 | Normal | 0.122 | 0.099 | 0.111 | -0.562 | 0.409 | 60 |
| 476 | LumA | -0.348 | -0.268 | 0.646 | -0.307 | 0.462 | Normal | -0.107 | -0.327 | 0.47 | -0.384 | 0.539 | not available |
| 517 | Normal | 0.143 | 0.075 | 0.043 | -0.284 | 0.255 | Basal | 0.803 | 0.018 | -0.533 | -0.317 | 0.152 | not available |
| 667 | Basal | 0.498 | 0.199 | -0.591 | -0.001 | -0.222 | Basal | 0.506 | 0.146 | -0.448 | -0.11 | -0.039 | not available |
| 688 | Basal | 0.615 | 0.078 | -0.389 | -0.367 | 0.136 | Basal | 0.586 | 0.089 | -0.424 | -0.362 | 0.1 | not available |
Cases with discordant class assignment before and after chemotherapy are highlighted in gray. Percent cellularity of residual cancer for cases that converted to normal-like status after chemotherapy are bold.
Enriched and depleted molecular pathways in residual cancers
To identify gene expression changes in residual cancer compared to pre-treatment samples we performed paired sample t-test on 15,062 probe for all cases (n=21) and also separately for the basal-like (n=9) and non-basal-like (n=12) cancers. When all cancers were analyzed together, 532 probe sets were differentially expressed between pre- and post-treatment samples at FDR ≤0.005 (corresponding to P-value ≤0.0003), 271 were over-expressed and 261 were under-expressed in residual cancer relative to pre-treatment samples (Supplementary Table 5). When basal-like cancers were considered only, 77 probe sets were over-expressed and 115 were under expressed. In non-basal-like cancers the corresponding numbers were 149 and 135, respectively (Supplementary Table 5). To find out what molecular pathways may be affected by these transcriptional changes, we mapped the over- and under expressed genes into biological pathways by IPA. Table 2 lists the ten canonical pathways that were up- or down-regulated in the residual cancers. Results are presented for all cancers as well as for the basal-like and non-basal like subsets. When cancers were analyzed without molecular stratification, the top 10 up-regulated pathways in residual cancer included Estrogen Receptor Signaling and nuclear receptor signaling (e.g. PPAR Signaling, PPARα/RXRα Activation, Nur77 Signaling in T Lymphocytes, and Aryl Hydrocarbon Receptor Signaling) as well as the Notch and WNT signaling pathways. Pathways involved in Hedgehog signaling, PI3K/AKT, ATM and cell cycle control were depleted in the residual cancers. It is likely that the different molecular subtypes of breast cancer may use different survival pathways or rely on distinct mechanisms of drug resistance and therefore we also performed the same pathway analysis basal-like and non-basal-like breast cancers separately. Metabolic pathways (glutamate metabolism, chondroitin sulphate biosynthesis, propanoate metabolism) were the most consistently up-regulated in basal-like residual cancers, the other up-regulated pathways were united by the key functional roles of increased PI3K, small G-protein and calcium/calmodulin-dependent protein kinase II alpha (CAMK2) expression. Notch, hypoxia and TNF and ILK signaling were up-regulated in non-basal-like cancers. Sonic hedgehog signaling was consistently depleted in residual cancers in both molecular types and the depletion of various immune related pathways was particularly prominent in basal-like cancers (Lipid Antigen Presentation by CD1, Dendritic cell maturation, FC Receptor-mediated phagocytosis and natural killer cell signaling).
Table 2.
Top 10 biological pathways from differentially expressed genes
| Over-expression in post-NST | Under-expression in post-NST | |||
|---|---|---|---|---|
| Canonical pathways | P-value | Canonical pathways | P-value | |
| All cases (n=21) | ||||
| 1 | PPAR Signaling | 0.0029 | ATM Signaling | 0.0001 |
| 2 | PPARα/RXRα Activation | 0.0032 | Hypoxia Signaling in the Cardiovascular System | 0.0005 |
| 3 | Integrin Signaling | 0.0033 | Cell Cycle: G2/M DNA Damage Checkpoint Regulation | 0.0005 |
| 4 | Nur77 Signaling in T Lymphocytes | 0.0079 | IL-1 Signaling | 0.0005 |
| 5 | O-Glycan Biosynthesis | 0.0091 | Sonic Hedgehog Signaling | 0.0009 |
| 6 | Circadian Rhythm Signaling | 0.0120 | D-glutamine and D-glutamate Metabolism | 0.0014 |
| 7 | Estrogen Receptor Signaling | 0.0141 | PI3K/AKT Signaling | 0.0019 |
| 8 | Wnt/β-catenin Signaling | 0.0155 | IGF-1 Signaling | 0.0037 |
| 9 | Aryl Hydrocarbon Receptor Signaling | 0.0174 | Polyamine Regulation in Colon Cancer | 0.0044 |
| 10 | Notch Signaling | 0.0195 | Regulation of eIF4 and p70S6K Signaling | 0.0055 |
| Basal like cases (n=9) | ||||
| 1 | CREB Signaling in Neurons | 0.0032 | Role of NFAT in Regulation of the Immune Response | 0.0007 |
| 2 | TR/RXR Activation | 0.0035 | Mismatch Repair in Eukaryotes | 0.0046 |
| 3 | Thrombin Signaling | 0.0044 | Lipid Antigen Presentation by CD1 | 0.0065 |
| 4 | Glutamate Metabolism | 0.0069 | Systemic Lupus Erythematosus Signaling | 0.0095 |
| 5 | Huntington’s Disease Signaling | 0.0072 | Sonic Hedgehog Signaling | 0.0148 |
| 6 | Chondroitin Sulfate Biosynthesis | 0.0117 | Dendritic Cell Maturation | 0.0166 |
| 7 | CXCR4 Signaling | 0.0170 | Role of CHK Proteins in Cell Cycle Checkpoint Control | 0.0191 |
| 8 | Propanoate Metabolism | 0.0170 | Aminoacyl-tRNA Biosynthesis | 0.0209 |
| 9 | Glioma Invasiveness Signaling | 0.0178 | Fcγ Receptor-mediated Phagocytosis in Macrophages and Monocytes | 0.0214 |
| 10 | GM-CSF Signaling | 0.0209 | Natural Killer Cell Signaling | 0.0275 |
| Non-Basal like cases (n=12) | ||||
| 1 | Notch Signaling | 1.26E-05 | IL-1 Signaling | 0.0001 |
| 2 | Thrombopoietin Signaling | 0.0105 | Androgen Signaling | 0.0002 |
| 3 | ILK Signaling | 0.0162 | BMP signaling pathway | 0.0002 |
| 4 | Hypoxia Signaling in the Cardiovascular System | 0.0166 | RAR Activation | 0.0002 |
| 5 | Agrin Interactions at Neuromuscular Junction | 0.0182 | Amyloid Processing | 0.0005 |
| 6 | Caveolar-mediated Endocytosis Signaling | 0.0219 | Molecular Mechanisms of Cancer | 0.0008 |
| 7 | BMP signaling pathway | 0.0219 | Corticotropin Releasing Hormone Signaling | 0.0011 |
| 8 | O-Glycan Biosynthesis | 0.0224 | Cardiac Hypertrophy Signaling | 0.0011 |
| 9 | TNFR2 Signaling | 0.0224 | Sonic Hedgehog Signaling | 0.0012 |
| 10 | Aryl Hydrocarbon Receptor Signaling | 0.0245 | Melatonin Signaling | 0.0014 |
To gain further insight into the molecular changes that occur in residual cancer specimens, we also performed gene set analysis for 234 canonical biological pathways and two gene signatures that were previously reported to be associated with residual disease after chemotherapy in breast cancer.18,19 When all cases were analyzed together seven gene sets were over-expressed and 12 were under-expressed at p-value ≤ 0.05, in post-NST samples (Table 3). When basal-like cancers were examined separately, again numerous metabolic pathways emerged as up-regulated in residual cancers and various immune pathways dominated the down-regulated gene sets. In non-basal-like cancers, 11 gene sets were over-expressed and five gene sets were under-expressed in post-NST (P≤0.05). The results were broadly consistent with the pathways that were derived from differentially expressed genes. Fatty acid biosynthesis was the only common up-regulated pathway in both basal- and non-basal-like residual cancers and the sonic hedgehog signaling was the only common down-regulated pathway (Table 3, Figure 2). None of the two previously reported residual cancer-associated gene sets showed any significant enrichment before or after therapy in any disease subset (Supplementary Table 6).
Table 3.
Gene set analysis of 236 gene sets between post- and pre-NST specimens (P-value ≤ .05)*
| Gene sets | Number of genes | P-value | Elevated components | |
|---|---|---|---|---|
| All samples (n=21) | ||||
| 1 | Notch Signaling | 44 | 0.008 | Post |
| 2 | Circadian Rhythm Signaling | 37 | 0.021 | Post |
| 3 | Fatty Acid Biosynthesis | 17 | 0.032 | Post |
| 4 | PPAR__RXR_ Activation | 261 | 0.036 | Post |
| 5 | CXCR4 Signaling | 220 | 0.038 | Post |
| 6 | Neurotrophin_TRK Signaling | 101 | 0.040 | Post |
| 7 | O-Glycan Biosynthesis | 26 | 0.048 | Post |
| 1 | Sonic Hedgehog Signaling | 36 | 0.002 | Pre |
| 2 | p38 MAPK Signaling | 135 | 0.009 | Pre |
| 3 | Parkinson’s Signaling | 19 | 0.019 | Pre |
| 4 | Lysine Biosynthesis | 8 | 0.020 | Pre |
| 5 | Nicotinate and Nicotinamide Metabolism | 120 | 0.025 | Pre |
| 6 | Role of PKR in Interferon Induction and Antiviral Response | 69 | 0.025 | Pre |
| 7 | Methionine Metabolism | 31 | 0.033 | Pre |
| 8 | IL-10 Signaling | 87 | 0.039 | Pre |
| 9 | Natural Killer Cell Signaling | 144 | 0.046 | Pre |
| 10 | Role of RIG1-like Receptors in Antiviral Innate Immunity | 54 | 0.049 | Pre |
| 11 | B Cell Receptor Signaling | 228 | 0.050 | Pre |
| 12 | IL-15 Signaling | 85 | 0.050 | Pre |
| Basal samples (n=9) | ||||
| 1 | CXCR4 Signaling | 220 | 0.005 | Post |
| 2 | Thrombin Signaling | 268 | 0.010 | Post |
| 3 | Cardiac Hypertrophy Signaling | 302 | 0.014 | Post |
| 4 | Fatty Acid Biosynthesis | 17 | 0.024 | Post |
| 5 | Ascorbate and Aldarate Metabolism | 20 | 0.027 | Post |
| 6 | Propanoate Metabolism | 82 | 0.031 | Post |
| 7 | Neurotrophin_TRK Signaling | 101 | 0.039 | Post |
| 8 | TR_RXR Activation | 119 | 0.039 | Post |
| 9 | IGF-1 Signaling | 138 | 0.045 | Post |
| 10 | Alanine Metabolism | 55 | 0.046 | Post |
| 1 | Lysine Biosynthesis | 8 | 0.001 | Pre |
| 2 | Natural Killer Cell Signaling | 144 | 0.001 | Pre |
| 3 | Fc Epsilon RI Signaling | 134 | 0.002 | Pre |
| 4 | TREM1 Signaling | 71 | 0.002 | Pre |
| 5 | B Cell Receptor Signaling | 228 | 0.005 | Pre |
| 6 | Role of NFAT in Regulation of the Immune Response | 272 | 0.006 | Pre |
| 7 | Fc Receptor-mediated Phagocytosis in Macrophages and Monocytes | 153 | 0.007 | Pre |
| 8 | IL-10 Signaling | 87 | 0.012 | Pre |
| 9 | Dendritic Cell Maturation | 188 | 0.018 | Pre |
| 10 | p38 MAPK Signaling | 135 | 0.018 | Pre |
| 11 | CTLA4 Signaling in Cytotoxic T Lymphocytes | 135 | 0.027 | Pre |
| 12 | Sonic Hedgehog Signaling | 36 | 0.027 | Pre |
| 13 | IL-15 Signaling | 85 | 0.028 | Pre |
| 14 | Role of PKR in Interferon Induction and Antiviral Response | 69 | 0.030 | Pre |
| 15 | IL-8 Signaling | 217 | 0.033 | Pre |
| 16 | Fc_RIIB Signaling in B Lymphocytes | 54 | 0.037 | Pre |
| 17 | CD28 Signaling in T Helper Cells | 199 | 0.041 | Pre |
| 18 | T Helper Cell Differentiation | 57 | 0.044 | Pre |
| 19 | Cytotoxic T Lymphocyte-mediated Apoptosis of Target Cells | 51 | 0.048 | Pre |
| 20 | NF-_B Signaling | 183 | 0.048 | Pre |
| Non Basal samples (n=12) | ||||
| 1 | Circadian Rhythm Signaling | 37 | 0.005 | Post |
| 2 | Notch Signaling | 44 | 0.006 | Post |
| 3 | O-Glycan Biosynthesis | 26 | 0.011 | Post |
| 4 | Chondroitin Sulfate Biosynthesis | 38 | 0.017 | Post |
| 5 | Caveolar-mediated Endocytosis | 119 | 0.027 | Post |
| 6 | Thrombopoietin Signaling | 84 | 0.029 | Post |
| 7 | Integrin Signaling | 280 | 0.034 | Post |
| 8 | Actin Cytoskeleton Signaling | 267 | 0.035 | Post |
| 9 | Fatty Acid Biosynthesis | 17 | 0.041 | Post |
| 10 | PPAR Signaling | 124 | 0.043 | Post |
| 11 | Semaphorin Signaling in Neurons | 73 | 0.044 | Post |
| 12 | Sonic Hedgehog Signaling | 36 | 0.003 | Pre |
| 13 | Role of RIG1-like Receptors in Antiviral Innate Immunity | 54 | 0.020 | Pre |
| 14 | Phototransduction Pathway | 49 | 0.026 | Pre |
| 15 | BMP signaling pathway | 116 | 0.031 | Pre |
| 16 | Airway Inflammation in Asthma | 3 | 0.044 | Pre |
P-value was calculated by Efron-Tibshirani’s GSA test (under 1000 times permuations); Overlapping gene sets between Basal and Non-basal are highlighted.
Figure 2.
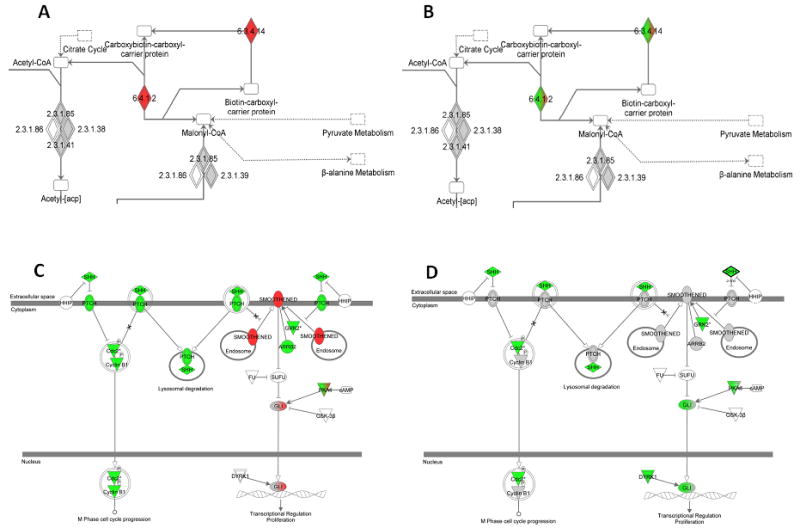
Ingenuity Pathway Maps of the Fatty Acid Biosynthesis gene set that was enriched in both the basal-like (A) and non-basal like residual cancers (B) and the Sonic Hedgehog Signaling gene set that was depleted in basal-like (C) as well as non-basal-like (D) residual cancers. Red = genes over-expressed in residual samples; green = genes under -expressed in residual samples; grey = genes with no statistically significant differential expression (P<.01); white = pathway member not available in data. Mixed colors represent variable association for the same gene depending on probe set (6.3.4.14=biotin carboxylase 6.4.1.2= acetyl-CoA carboxylase).
It has been suggested that the expression of genes involved with epithelial-mesenchymal transition (EMT) may be altered in cancers that survived chemotherapy.19 To test this hypothesis we compared the expression of 8 key EMT genes (CD44, PCNA, CDH1, SNAIL, SLUG, TWIST, SOX9, and TGFβ) in pre- and post-NST samples. When all cancers (n=21) were examined together (Table 4) only SLUG, SOX9 and TWIST were significantly over-expressed (P=0.029, 0.001, and 0.004 respectively, unadjusted for multiple comparisons), and SNAI1 was significantly under-expressed (P=0.001) in post-NST samples. When basal-like and non-basal-like cancers were examined separately, CD44, SLUG SOX9, and TWIST were significantly overexpressed (P=0.012, 0.050, 0.010, and 0.028 respectively), and SNAI1 was significantly under-expressed (P=0.003) in residual post-NST non-basal-like cancers. In basal-like cancers no gene was significantly altered (Table 4).
Table 4.
Paired sample t-test for EMT related genes
| Symbol | Name | ProbeSet | All (n=21) | NonBasal (n=12) | Basal (n=9) | ||||||
|---|---|---|---|---|---|---|---|---|---|---|---|
| p-value | FDR | Ratio (Post/Pre) | p-value | FDR | Ratio (Post/Pre) | p-value | FDR | Ratio (Post/Pre) | |||
| CD44 | CD44 molecule (Indian blood group) | 212063_at | 0.154 | 0.283 | 1.03 | 0.012 | 0.043 | 1.07 | 0.507 | 0.797 | 1.07 |
| CDH1 | cadherin 1, type 1, E-cadherin (epithelial) | 201131_s_at | 0.581 | 0.711 | 1.02 | 0.491 | 0.675 | 1.03 | 0.993 | 0.993 | 1.03 |
| SLUG | snail homolog 2 (Drosophila) | 213139_at | 0.029 | 0.065 | 1.12 | 0.050 | 0.110 | 1.17 | 0.371 | 0.681 | 1.17 |
| SNAI1 | snail homolog 1 (Drosophila) | 219480_at | 0.001 | 0.010 | 0.80 | 0.003 | 0.037 | 0.80 | 0.076 | 0.247 | 0.80 |
| SOX9 | SRY (sex determining region Y)-box 9 | 202935_s_at | 0.002 | 0.011 | 1.08 | 0.010 | 0.043 | 1.09 | 0.107 | 0.247 | 1.09 |
| TGFB1 | transforming growth factor, beta 1 | 203085_s_at | 0.848 | 0.853 | 1.00 | 0.654 | 0.797 | 1.01 | 0.912 | 0.993 | 1.01 |
| TWIST | twist homolog 1 (Drosophila) | 213943_at | 0.004 | 0.015 | 1.11 | 0.028 | 0.077 | 1.12 | 0.090 | 0.247 | 1.12 |
Discussion
Our aim was to determine gene expression differences between primary tumor and corresponding residual cancer after NST. We performed gene expression profiling on baseline FNAs and surgical resections from residual cancer after four to six months of cytotoxic chemotherapy. Any such analysis strategy is fraught not only by the limited number of tumors analyzed, but also with technical challenges that increase the probability for false discovery. In our case, baseline biopsies were obtained with an FNA and residual cancers represented surgically resected tissues. Tissue sampling methods can have a profound effect on gene expression results from the same cancer.13 Also, chemotherapy alters tumor cellularity in most cancers shifting tissue composition towards stromal and fibrotic components in post-NST samples.5 These effects plus the inevitable technical noise in repeat gene expression profiling can mask real biological changes in mRNA expression levels caused by NST in small studies. We tried to minimize tissue composition-related confounders by removing 1618 probe sets that we previously found to be highly associated with tissue sampling and stromal “contamination”.10 We also filtered the lowest expressed 25% of probe sets because these may be the most susceptible to technical noise in repeat measurements.21
After controlling for these confounders, ER and HER2 status based on mRNA expression remained stable in all but two cases (10%). There were also no significant changes in two single gene proliferation metrics, the expression of Ki67 and PCNA. Conversely, molecular class changed in eight cases (38%) mostly to normal-like subtype. This shift to normal-like in post-NST specimens were observed in cancers with the lowest cancer cell cellularity in residual disease and probably reflect a major shift in tumor composition. Since pretreatment FNAs contain mostly neoplastic cells and are devoid of stroma, our analysis is biased to detect increase in stromal components in the surgical specimens even after our best attempt to control for this variable (none of the PAM50 classifier genes were included in our stromal-associated and therefore filtered gene list).22 Nevertheless, these results indicate that molecular classification is susceptible to tissue sampling effects and this should be considered when interpreting results from any repeat measurement of a tumor.
Using a stringent FDR threshold of 0.005, we found 200 to 600 probe sets differentialy expressed between baseline and post-NST samples. When corresponding genes were mapped to biological pathways some interesting observations emerged. In basal-like cancers, pathways driven by PI3K, small G proteins, CAMK2, and several energy metabolism and biosynthetic pathways were enriched in post-NST samples, while immune cell-derived pathways and the sonic hedgehog pathway were depleted. The same broad picture emerged when gene set analysis was applied to the data. In non-basal-like breast cancers, notch signaling and also energy metabolism through fatty acid synthesis were up-regulated and sonic hedgehog signaling as well as several immune-related pathways were depleted in residual cancers. However, due to the small sample size of this study, the variable cytotoxic therapies that these patients received and the possible tissue sampling related confounders, these observations remain hypothesis generating until confirmed in repeated observations and in larger studies. We also note that in our analysis, we could not observe an increase in EMT related features or cancer stem cell signatures in residual cancers as suggested previously.18,19
Two strong themes emerged from this analysis with potential therapeutic implications, the enrichment of energy and metabolism related processes in residual cancers that were most prominent in basal-like cancers and the depletion of immune related signals. There is increasing interest in deciphering the deregulation of energy metabolism in cancer and attempts are being made to develop metabolism-targeted drugs.23 Our data suggests that in response to cytotoxic therapy several metabolic pathways become up-regulated in residual cancer tissue. We hypothesize that the increased metabolic activity may enable cells to survive treatment and targeting these processes may enhance the efficacy of standard chemotherapy regimens. It is also increasingly evident that the presence of immune cells in the tumor microenvironment carries prognostic value, particularly among ER-negative and highly proliferative ER-positive cancers, and is also associated with higher probability of pCR to NST.10,24,25,26 Since residual cancer tissue becomes depleted of immune related transcriptional signals, probably due to the systematic immunosuppressive nature of chemotherapy, stimulating post-NST immune response may become a fruitful adjuvant therapeutic strategy for patients with residual cancer and high risk of recurrence.
Supplementary Material
Translational Relevance.
Neoadjuvant systemic therapy (NST) provides an opportunity to directly assess the therapy response in breast cancer. Residual cancer volume after NST carries important prognostic information. By examine gene expression differences between pre- and post-NST specimens of breast cancers we could identify biological changers that may lead to new therapeutic insights for a biologically resistant disease. By using gene expression data from pre-chemotherapy fine needle aspiration specimens and compared them to surgically resected residual cancers we found that expression of 200-600 probe sets changed between baseline and post-chemotherapy samples and that energy metabolism related processes are up-regulated and immune related signals are depleted in residual cancers. Targeting these biological processes may represent promising adjuvant treatment strategies for patients with residual cancer.
Acknowledgments
Funding: This work was supported in part by 1K23CA121994-01 (AMG) ASCO Career Development Award (AMG), Komen for the Cure Catalystic Award KG090341 (AMG), KG081099 (AMG, GBM), American Cancer Society Research Scholar Grant (AMG), The Breast Cancer Research Foundation (LP and WFS), and National Cancer Institute through The University of Texas MD Anderson’s Cancer Center Support Grant (P30 CA016672).
References
- 1.Wolff AC, Berry D, Carey LA, Colleoni M, Dowsett M, Ellis M, et al. Research issues affecting preoperative systemic therapy for operable breast cancer. J Clin Oncol. 2008;26:806–13. doi: 10.1200/JCO.2007.15.2983. [DOI] [PubMed] [Google Scholar]
- 2.Kuerer HM, Newman LA, Smith TL, Ames FC, Hunt KK, Dhingra K, et al. Clinical course of breast cancer patients with complete pathologic primary tumor and axillary lymph node response to doxorubicin-based neoadjuvant chemotherapy. J Clin Oncol. 1999;17:460–9. doi: 10.1200/JCO.1999.17.2.460. [DOI] [PubMed] [Google Scholar]
- 3.Liedtke C, Mazouni C, Hess KR, Andre F, Tordai A, Mejia JA, et al. Response to neoadjuvant therapy and long-term survival in patients with triple-negative breast cancer. J Clin Oncol. 2008;26:1275–81. doi: 10.1200/JCO.2007.14.4147. [DOI] [PubMed] [Google Scholar]
- 4.Guarneri V, Broglio K, Kau SW, Cristofanilli M, Buzdar AU, Valero V, et al. Prognostic value of pathologic complete response after primary chemotherapy in relation to hormone receptor status and other factors. J Clin Oncol. 2006;24:1037–44. doi: 10.1200/JCO.2005.02.6914. [DOI] [PubMed] [Google Scholar]
- 5.Symmans WF, Peintinger F, Hatzis C, Rajan R, Kuerer H, Valero V, et al. Measurement of residual breast cancer burden to predict survival after neoadjuvant chemotherapy. J Clin Oncol. 2007;25:4414–22. doi: 10.1200/JCO.2007.10.6823. [DOI] [PubMed] [Google Scholar]
- 6.O’Regan RM, Von Roenn JH, Carlson RW, Malik U, Sparano JA, Staradub V, et al. Final results of a phase II trial of preoperative TAC (Docetaxel/doxorubicin/cyclophosphamide) in stage III breast cancer. Clin Breast Cancer. 2005;6:163–8. doi: 10.3816/CBC.2005.n.019. [DOI] [PubMed] [Google Scholar]
- 7.Stearns V, Singh B, Tsangaris T, Crawford JG, Novielli A, Ellis MJ, et al. A prospective randomized pilot study to evaluate predictors of response in serial core biopsies to single agent neoadjuvant doxorubicin or paclitaxel for patients with locally advanced breast cancer. Clin Cancer Res. 2003;9:124–33. [PubMed] [Google Scholar]
- 8.Andre F, Mazouni C, Liedtke C, Kau SW, Frye D, Green M, et al. HER2 expression and efficacy of preoperative paclitaxel/FAC chemotherapy in breast cancer. Breast Cancer Res Treat. 2009;108:183–90. doi: 10.1007/s10549-007-9594-8. [DOI] [PubMed] [Google Scholar]
- 9.Buzdar AU, Ibrahim NK, Francis D, Booser DJ, Thomas ES, Theriault RL, et al. Significantly higher pathologic complete remission rate after neoadjuvant therapy with trastuzumab, paclitaxel, and epirubicin chemotherapy: results of a randomized trial in human epidermal growth factor receptor 2-positive operable breast cancer. J Clin Oncol. 2005 Jun 1;23(16):3676–85. doi: 10.1200/JCO.2005.07.032. [DOI] [PubMed] [Google Scholar]
- 10.Bianchini G, Qi Y, Alvarez RH, Iwamoto T, Coutant C, Ibrahim NK, et al. Molecular anatomy of breast cancer stroma and its prognostic value in estrogen receptor-positive and -negative cancers. J Clin Oncol. 2010;28:4316–23. doi: 10.1200/JCO.2009.27.2419. [DOI] [PubMed] [Google Scholar]
- 11.Symmans WF, Ayers M, Clark EA, Stec J, Hess KR, Sneige N, et al. Total RNA yield and microarray gene expression profiles from fine needle aspiration and core needle biopsy samples of breast cancer. Cancer. 2003;97:2960–71. doi: 10.1002/cncr.11435. [DOI] [PubMed] [Google Scholar]
- 12.Rouzier R, Perou CM, Symmans WF, Ibrahim N, Cristofanilli M, Anderson K, et al. Different molecular subtypes of breast cancer respond differently to preoperative chemotherapy. Clin Cancer Res. 2005;11:5678–85. doi: 10.1158/1078-0432.CCR-04-2421. [DOI] [PubMed] [Google Scholar]
- 13.Stec J, Wang J, Coombes K, Ayers M, Hoersch S, Gold DL, et al. Comparison of the predictive accuracy of DNA array based multigene classifiers across cDNA arrays and Affymetrix GeneChips. J Mol Diagn. 2005;7:357–67. doi: 10.1016/s1525-1578(10)60565-x. [DOI] [PMC free article] [PubMed] [Google Scholar]
- 14.Johnson WE, Rabinovic A, Li C. Adjusting batch effects in microarray expression data using Empirical Bayes methods. Biostatistics. 2007;8:118–27. doi: 10.1093/biostatistics/kxj037. [DOI] [PubMed] [Google Scholar]
- 15.Gong Y, Yan K, Lin F, Anderson K, Sotiriou C, Andre F, et al. Determination of oestrogen-receptor status and ERBB2 status of breast carcinoma: a gene-expression profiling study. Lancet Oncol. 2007;8:203–11. doi: 10.1016/S1470-2045(07)70042-6. [DOI] [PubMed] [Google Scholar]
- 16.Parker JS, Mullins M, Cheang MC, Leung S, Voduc D, Vickery T, et al. Supervised risk predictor of breast cancer based on intrinsic subtypes. J Clin Oncol. 2010;27:1160–67. doi: 10.1200/JCO.2008.18.1370. [DOI] [PMC free article] [PubMed] [Google Scholar]
- 17.Efron B, Tishirani R. On testing the significance of sets of genes. Ann Appl Stat. 2007;1:107–29. [Google Scholar]
- 18.Creighton CJ, Li X, Landis M, Dixon JM, Neumeister VM, Sjolund A, et al. Residual breast cancers after conventional therapy display mesenchymal as well as tumor-initiating features. Proc Natl Acad Sci U S A. 2009;106:13820–5. doi: 10.1073/pnas.0905718106. [DOI] [PMC free article] [PubMed] [Google Scholar]
- 19.Mego M, Mani SA, Lee BN, Li C, Evans KW, Cohen EN, et al. Expression of epithelial-mesenchymal transition-inducing transcription factors in primary breast cancer: The effect of neoadjuvant therapy. Int J Cancer. 2011 Mar 8; doi: 10.1002/ijc.26037. Epub ahead of print. [DOI] [PMC free article] [PubMed] [Google Scholar]
- 20.Jiang Z, Gentleman R. Extensions to gene set enrichment. Bioinformatics. 2007;23:306–13. doi: 10.1093/bioinformatics/btl599. [DOI] [PubMed] [Google Scholar]
- 21.Anderson K, Hess KR, Kapoor M, Tirrell S, Courtemanche J, Wang B, et al. Reproducibility of gene expression signature-based predictions in replicate experiments. Clin Cancer Res. 2006;12(6):1721–7. doi: 10.1158/1078-0432.CCR-05-1539. [DOI] [PubMed] [Google Scholar]
- 22.Symmans WF, Ayers M, Clark EA, Stec J, Hess KR, Sneige N, et al. Total RNA yield and microarray gene expression profiles from fine-needle aspiration biopsy and core-needle biopsy samples of breast carcinoma. Cancer. 2003;97:2960–71. doi: 10.1002/cncr.11435. [DOI] [PubMed] [Google Scholar]
- 23.Denkert C, Loibl S, Noske A, Roller M, Muller BM, Komor M, et al. Tumor-associated lymphocytes as an independent predictor of response to neoadjuvant chemotherapy in breast cancer. J Clin Oncol. 2010;28:105–13. doi: 10.1200/JCO.2009.23.7370. [DOI] [PubMed] [Google Scholar]
- 24.Rody A, Holtrich U, Pusztai L, Liedtke C, Gaetje R, Ruckhaeberle E, et al. T-cell metagene predicts a favorable prognosis in estrogen receptor negative and HER2 positive breast cancers. Breast Cancer Res. 2009;11:R15. doi: 10.1186/bcr2234. [DOI] [PMC free article] [PubMed] [Google Scholar]
- 25.Karn T, Pusztai L, Ruckhaeberle E, Liedtke C, Muller V, Schmidt M, et al. Melanoma antigen family A identified by the bimodality index defines a subset of triple negative breast cancers as candidates for immune response augmentation. Eur J Cancer. 2011 doi: 10.1016/j.ejca.2011.06.025. [DOI] [PubMed] [Google Scholar]
- 26.Cairns RA, Harris IS, Mak TW. Regulation of cancer cell metabolism. Nat Rev Cancer. 2011;11:85–95. doi: 10.1038/nrc2981. [DOI] [PubMed] [Google Scholar]
Associated Data
This section collects any data citations, data availability statements, or supplementary materials included in this article.