

Abstract
Convection enhanced delivery (CED) is a promising technique for administering large therapeutics that do not readily cross the blood brain barrier to neural tissue. It is of vital importance to understand how large drug constructs move through neural tissue during CED to optimize construct and delivery parameters so that drugs are concentrated in the targeted tissue, with minimal leakage outside the targeted zone. Experiments have shown that liposomes, viral vectors, high molecular weight tracers, and nanoparticles infused into neural tissue localize in the perivascular spaces of blood vessels within the brain parenchyma. In this work, we used two-photon excited fluorescence microscopy to monitor the real-time distribution of nanoparticles infused in the cortex of live, anesthetized rats via CED. Fluorescent nanoparticles of 24-nm and 100-nm nominal diameters were infused into rat cortex through microfluidic probes. We found that perivascular spaces provide a high permeability path for rapid convective transport of large nanoparticles through tissue, and that the effects of perivascular spaces on transport are more significant for larger particles that undergo hindered transport through the extra cellular matrix. This suggests that the vascular topology of the target tissue volume must be considered when delivering large therapeutic constructs via CED.
Keywords: microfluidics, two-photon microscopy, neural drug delivery
3. Introduction
Convection enhanced delivery (CED) is a promising technique for delivering drugs that do not readily cross the blood brain barrier (BBB) to neural tissue. In this procedure, a solution containing the drug is infused into the brain through a small needle or catheter inserted into the brain parenchyma. Transport of the infusate in the brain interstitium is driven by pressure gradients rather than concentration gradients (as is the case for diffusive delivery from an implant or other reservoir). Therefore, infused drugs are able to penetrate farther into the tissue3. Since CED is often used to deliver therapeutics that are too large to cross the BBB, such as nanoparticles, liposomes, proteins, and viral vectors, it is essential to fully understand how these large constructs are transported through tissue. This is important in planning CED protocols to minimize leakage of therapeutics away from diseased areas into healthy tissue. Unanticipated outflow can cause serious side effects and diminish the efficacy of the therapy, and has been one of the major drawbacks associated with CED in clinical trials16. The difficulty in controlling the infusate distribution is due to the inhomogeneous nature of brain tissue, which contains regions of varying permeability such as white and gray matter, ventricles, and necrotic regions within diseased tissue.
Recent CED studies of large therapeutics suggest that perivascular spaces may also influence the distribution of infusates by providing high permeability paths for fluid to move through the brain. Perivascular spaces surrounding arterioles that plunge into the cortex are extensions of the sub-pial spaces12. For many years, the role of perivascular spaces has been studied in the bulk flow of cerebrospinal fluid (CSF) through the brain and in solute transport through the central nervous system10, 13, 21, 23, 31, 33. Some data suggest that perivascular spaces may become more prominent when endogenous particles such as amyloid-β aggregates or other particles are present22, 34.
Cserr and Ostrach5 examined how a bolus infusion of blue dye-labeled dextran in the striatum of a rat dispersed through the brain over 24 hours. They found that the dye spread over a greater distance than would be possible through pure diffusion, and noted that the tracer travelled away from the infusion site along perivascular spaces. Furthermore, they demonstrated that when edema around the insertion site was eliminated (either by administering an anti-inflammatory or by waiting 7 days after inserting the cannula before infusion), that the dye remained localized around the insertion site and was not widely distributed throughout the brain. This suggests that perivascular spaces act as conduits for elimination of excess fluid from the brain.
Carare et al4 found that soluble tracers such as fluorescently labeled dextran drained along perivascular spaces and out of the brain. In contrast, Zhang et al35 found that larger insoluble particulate tracers, such as amyloid-β aggregates and fluorescent microspheres, were trapped in the perivascular spaces. This aggregation may impede bulk fluid drainage at sufficiently high deposition levels.
Studies examining CED of liposomes and viral vectors have observed evidence of perivascular transport in rodents and primates6, 11, 15, 17, 24. Mamot and coworkers17 co-infused liposomes and mannitol into rodent brains and intracranial and flank implanted xenograft tumors. During post-mortem histological examination they observed that the liposomes were distributed along the blood vessels of the tumors. Krauze et al15 infused gadolinium- and rhodamine-loaded liposomes into the putamen of non-human primates while performing MRI and magnetic resonance angiography (MRA). Co-localizing images from the MRI and MRA studies showed that the liposomes were travelling along large blood vessels in the brain, and histological examination showed that the liposomes were localized in the perivascular space of these vessels. Hadaczek and colleagues infused viral vectors, fluorescent liposomes, and BSA into the rat striatum while controlling the heart rate and blood pressure of the animal11. They saw evidence of perivascular transport along vessels, and observed that the final distribution volumes of the infusates were directly correlated with heart rate. They suggested that the passage of infusates through the brain may be aided by “perivascular pumping” through the perivascular spaces driven by pulsations of the vessel walls.
Wang and Olbricht have recently developed a model of fluid flow in the perivascular spaces that investigates the possible effects of “perivascular pumping” on transport in the perivascular spaces30. They found that pulsatile motion of the vessel wall could significantly contribute to flow in the perivascular spaces even when there is a pressure gradient due to an ongoing CED infusion. They noted that the perivascular pumping effect became even more important as the distance of the perivascular space from the outlet of the CED infusion increased.
Although these studies demonstrate that large therapeutics tend to accumulate in the perivascular space, it is difficult to garner knowledge about the dynamics of their motion through tissue. Studies using MRI can track the distribution of paramagnetically labeled infusates in real time, but they lack the spatial resolution required for examining dynamic behavior of all but the largest blood vessels of the brain. In this study we used two-photon excited fluorescence (2PEF) microscopy to examine how nanoparticles are transported through the rat cortex during CED. This technique allowed us to monitor the nanoparticle distribution in real time, and with micrometer-scale resolution.
Two-photon excited fluorescence microscopy permits fluorescence imaging with intrinsic optical sectioning deep inside scattering specimens with diffraction-limited resolution8. Briefly, a femtosecond laser pulse is tightly focused inside a specimen that has been labeled with a fluorescent molecule that does not linearly absorb at the wavelength of the femtosecond laser. At the laser focus, the laser intensity can become high enough to induce two-photon excitation of the fluorescent molecule. Because the excitation is nonlinear, the resulting fluorescence is only produced in the focal volume where the laser intensity is high. The fluorescence intensity is then recorded as the position of the laser focus is scanned throughout the specimen, forming a three-dimensional map of the distribution of the fluorescent label. In addition, because photoexcitation occurs only at the laser focus, photobleaching of fluorescent dyes and photodamage to the sample are reduced significantly compared with linear imaging techniques26.
2PEF microscopy is well suited to in vivo imaging, especially deep inside highly scattering specimens. In widefield or confocal fluorescence microscopy, the fluorescence must be imaged to a camera or to a pinhole, respectively. Scattering of the fluorescence light leads to an unwanted background in widefield microscopy and to decreased signal strength in confocal microscopy. In 2PEF microscopy, however, because all the fluorescence originates from the focal volume, it need only be detected in order to contribute to the signal, not imaged to a camera or pinhole. Thus, fluorescence that is scattered on the way to the detector still contributes to image formation, and does not produce any unwanted background. This tolerance to scattering of the fluorescence allows imaging deep into scattering samples. The imaging depth is ultimately limited by scattering of the femtosecond laser beam. In practice, one can image 500 μm or more beneath the surface of typical tissues (brain, skin, kidney, etc) without loss of image resolution7, 8, 14, 28.
Further, the high spatial and temporal resolution that can be obtained with 2PEF microscopy makes it ideal for examining dynamics of processes inside living tissues. This technique has been used to measure and map changes in blood flow within cortical vessels caused by small laser-induced strokes25. The use of calcium sensitive dyes and fast laser rastering techniques can elucidate the dynamics of activity in neuronal and astrocytic networks9. Multi-photon imaging has also been used to track cell migration and angiogenesis in rodent models of gliobastoma mulitforme32.
In this study, we infused fluorescent nanoparticles into the cortex of rats using microfluidic delivery devices. During the infusions, we captured 2PEF images at a fixed location in the brain at a known distance from the tip of the microfluidic probe. By noting where nanoparticles first appeared in the imaging plane, we could determine whether the particles were transported primarily through the perivascular spaces or through the extracellular space (ECS). Furthermore, because both the distance traveled by the nanoparticles and the elapsed time were measured, we were able to determine the primary transport mechanism by comparing the elapsed time with the characteristic times for convective and diffusive transport. We found that the nanoparticles were transported through the perivascular spaces much more readily than through the bulk extracellular space of the brain. These results show that delivery of large (50-150 nm diameter) therapeutic constructs to neural tissue using CED requires careful consideration of the vasculature in the target area to minimize the escape of therapeutics from the disease afflicted regions and to maximize the effectiveness of the infused drug.
4. Materials and Methods
4.1. Nanoparticle Preparation and Characterization
Carboxylate-modified fluorescent nanoparticle stock solutions (24 and 100 nm FluoSpheres, Invitrogen, Carlsbad CA) were sonicated for 15 minutes before being diluted to 0.02 wt% solids in a solution of 1% bovine serum albumen (BSA, Sigma-Aldrich, St. Loius MO) in phosphate buffered saline (approximately 1013 particles/ml and 1011 particles/ml for 24-nm and 100-nm particles, respectively). The nanoparticle solutions were then gently rotated using a laboratory rotisserie at room temperature for 4 hours. This treatment reduced the surface charge of the nanoparticles and thereby reduced non-specific binding of the particles to the extracellular matrix19.
The size and surface charge of the nanoparticles were determined before and after BSA incubation via dynamic light scattering and laser Doppler measurements of particle mobility under electrophoresis (Zetasizer Nano, Malvern Instruments Ltd., UK), respectively. The diameters of the particles determined from light scattering as received from the manufacturer were 44.5±1.6 nm for the small particles (24-nm nominal diameter) and 134.8±0.6 nm for the large particles (100-nm nominal diameter). These differences between the measured and nominal diameters may be due to slight aggregation of the sample combined with the fact that dynamic light scattering measurements can be skewed by the presence of a few large particles. After incubation with BSA, the measured diameter of the particles increased to 62.1±3.9 nm and 152.3±2.7 nm for the small and large nanoparticles, respectively. The average increase in diameter of the particles is 17.6 nm, which is in good agreement with the hydrodynamic size of BSA (7.2 nm2). The zeta potentials of the nanoparticles before BSA coating were −36.8±2.8 mV and −38.6±3.6 mV for the small particles and large particles, respectively. After BSA coating the zeta potentials were reduced to −10.8±3.4 mV for the small, and −11.4±2.5 mV for the large particles. As anticipated, the surface charge was substantially decreased by the presence of BSA.
4.2. Microfluidic Device Preparation
Silicon-based microfluidic devices were fabricated as previously described18. The devices had a 5-mm long insertable shank with a 100×100-μm cross-section. The microfluidic probes were attached to 150-mm long borosilicate micropipettes (1-mm OD, 0.58-mm ID) (World Precision Instruments Inc., Sarasota FL) with two-part epoxy (Epoxy 907, Miller-Stephenson, Danbury CT). The devices were backfilled with the nanoparticle solution under vacuum before the glass capillary was filled via a syringe with a custom MicroFil tip (World Precision Instruments Inc., Sarasota FL). The micropipette served as the fluidic reservoir for the microfluidic device. The proximal end of the glass micropipette was connected to a programmable pressure injector (PM8000, World Precision Instruments Inc.) using a micro-electrode holder. To infuse fluid using the microfluidic device, a constant pressure was applied to the fluidic reservoir in the micropipette via the pressure injector.
4.3. In Vivo Nanoparticle Infusions
Five male Sprague Dawley rats (weighing 283 – 370 g) were anesthetized via intra-peritoneal injection of 30 wt/vol% urethane in deionized water (urethane dose of 150 mg /100-g body weight). Animals were then secured in a stereotaxic frame and an incision was made in the skin along the dorsal midline to expose the skull. A dental drill was used to open a large craniotomy (∼1-cm diameter), exposing the brain from near the midline to the zygomatic arch. The dura was removed using a fine hook. The vasculature was labeled via tail vein injection of either fluorescein isothiocyanate (FITC) conjugated to 2-MD dextran or tetramethylrhodamine conjugated to 155-kDa dextran (Sigma-Aldrich, St. Loius MO). The tail vein injection fluorescently labels blood serum, allowing blood vessels of the cortex to be visualized under 2PEF. When red fluorescent nanoparticles were used, the blood vessels were labeled with green FITC-dextran; when green fluorescent nanoparticles were used, the vasculature was labeled with red tetramethylrhodamine-dextran.
Animals were then transferred to the stage of the 2PEF microscope, and microfluidic probes were inserted 1 mm into the cortex at a downward angle of 15° using a micromanipulator. The tissue was allowed to equilibrate for at least 2 min before infusions began. During this time, imaging stacks were collected in the dorsoventral direction to map the vasculature and to determine a suitable imaging location for monitoring the nanoparticle distribution during the infusion. The selected imaging location was the level directly above the probe outlet that had the greatest number of vertically oriented blood vessels (i.e. penetrating arterioles and ascending venules) that intersected the imaging frame. Arterioles and venules were easily distinguished on the cortical surface by their morphology and flow direction. To categorize subsurface vessels, the vessels were traced to readily identifiable surface arterioles and venules. A schematic of the experimental set-up is shown in Figure 1. Infusions were started at a driving pressure of 0.5 psi. The infusion pressure was increased at a rate of 0.1 psi/30 sec to a final pressure of 1 psi. In bench-top test infusions in agarose phantoms this resulted in a flow rate of about 0.1 μl/min, which was sufficiently low to prevent backflow around the device. However, during imaging of in vivo infusions, direct measurement of the actual flow rate was precluded by the position of the microfluidic device within the stage of the multiphoton microscope. 2PEF imaging frames were captured at 3.4 frames/s throughout the infusions and examined for the location of the first appearance of nanoparticle fluorescence (in perivascular spaces or in ECS). After an infusion was complete, the imaging plane was scanned through the tissue in the dorsoventral direction to sample the final nanoparticle distribution (up to a maximum depth of approximately 700 μm below the brain surface). Two animals received a second infusion of nanoparticles within the same craniotomy; the second infusion sites were chosen so that no residual fluorescence could be seen from the first infusion (>5 mm distance between sites).
Figure 1.
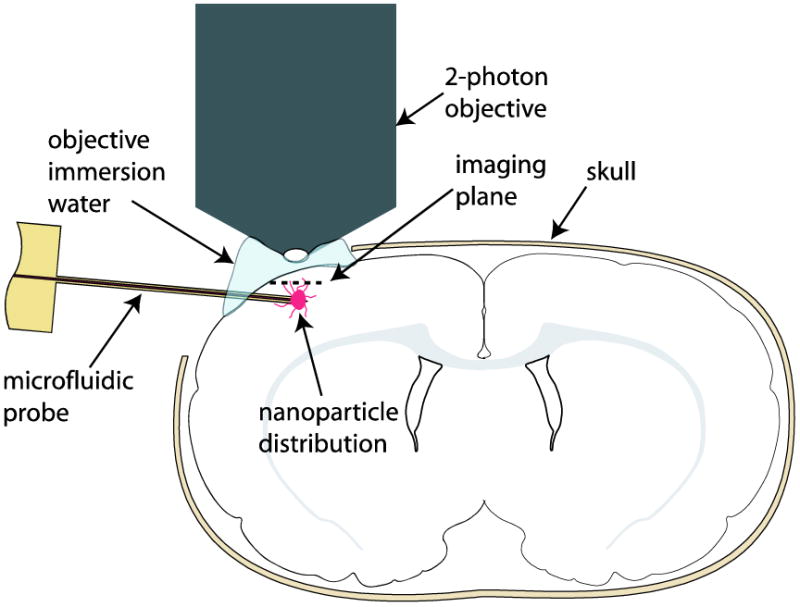
Experimental set-up for real-time two-photon excited fluorescence imaging of perivascular transport of nanoparticles.
2PEF images were taken on a two-channel microscope of local design using 100-fs duration pulses from a 76-MHz repetition rate Ti:sapphire oscillator (Mira-HP, Coherent, Santa Clara CA) pumped by a continuous wave laser (Verdi-V18, Coherent, Santa Clara CA). Excitation wavelengths were centered at 810 nm and 850 nm for yellow-green and red fluorescent nanoparticles, respectively. Detection filters were 525/70 nm (center wavelength/spectral width) and 615/70 nm. Low magnification images were taken with a 0.28 numerical aperture (NA), 4× air objective (Olympus). High magnification images used a 0.95 NA, 20× water immersion objective (Olympus) with a 2-mm working distance.
All animal procedures were carried out in accordance with the Cornell University Institutional Animal Care and Use Committee guidelines and regulations.
4.4. Image Analysis
2PEF imaging files were exported to ImageJ1 as multi-image tagged image file format (TIFF) stacks for analysis. Each channel of the 2PEF image (one for vasculature, one for nanoparticles) was adjusted for brightness and contrast and combined into a two-color imaging stack for viewing and export.
Where applicable, spot areas were measured by first importing the single-channel 2PEF file containing the nanoparticle fluorescence data to ImageJ as a TIFF. This file was adjusted for brightness and contrast, and then converted to binary where the nanoparticle fluorescence was bright and the background was dark. The threshold for this operation was determined by the ImageJ “getAutoThreshold” function using the IsoData algorithm. Next, noise was removed from the binary image by applying a 2×2 pixel median filter. The total area of the white pixels in each frame of the imaging stack could then be measured to assess the change in spot area over time.
5. Results
5.1. Nanoparticle transport in the rat cortex
We used 2PEF microscopy to examine in real-time how BSA-coated polystyrene fluorescent nanoparticles are transported through the cortex of live, anesthetized rats during CED. Microfluidic probes were inserted 1 mm into the cortex of rats at a downward angle of approximately 15°, and nanoparticle solutions were infused using the ramped pressure profile described above (0.5 psi to 1 psi over the first 150 s of the infusion). Imaging frames were captured during infusions at a fixed level within the cortex, directly above the probe outlet (Figure 1). We found that nanoparticles of both sizes traveled preferentially along perivascular spaces rather than through the ECS. Table 1 summarizes experimental conditions and results for each infusion, giving the particle size, the distance from the microfluidic probe outlet to the imaging plane, and the time taken for nanoparticles to reach the imaging plane.
Table 1.
Summary of the results of the nanoparticle infusions, giving the size of the particle infused, the distance from the probe tip to the imaging plane, and the time taken for the particles to appear in the imaging frame.
| Infusion | Nominal particle size (nm) |
Distance to imaging plane (μm) |
Time to arrival at imaging plane (s) | Figure | |
|---|---|---|---|---|---|
| Pervivascular | ECS | ||||
| 1 | 24 | 92 | No NP seen at imaging plane | - | |
| 2 | 24 | 243 | 13 | 50 | Fig. 2 |
| 3 | 24 | 290 | 200 | N/A | - |
| 4 | 24 | 220 | 12 | 35 | Fig. 3 |
| 5 | 24 | 360 | 30 | 135 | Fig. 4 |
| 6 | 100 | 300 | N/A | 110 | - |
| 7 | 100 | 280 | No NP seen at imaging plane | Fig. 5 | |
5.1.1. 24-nm nanoparticle transport
Infusions 1 through 5 in Table 1 involve 24-nm BSA-coated nanoparticles. For infusion 1, we chose an imaging plane 94 μm above the outlet of the microfluidic device. Nanoparticles were seen to transport through the extra cellular space (ECS), and no perivascular transport was observed in the imaging plane during the infusion. Post-infusion imaging up to 5 min after the end of the infusion showed that nanoparticles had localized in perivascular spaces in a more dorsal plane than the imaging plane used during the infusion.
In cases 2 through 5, nanoparticles were observed in the imaging plane shortly after the infusion started. In these instances, the nanoparticles first appeared in the perivascular spaces of blood vessels that intersected the imaging plane. The particles later filled the extracellular space between the vessels. Figure 2 shows a sequence of images recorded at times of 0, 30, 90, and 150 s after the start of the infusion. The first image (Figure 2(A)) shows the imaging plane at the start of the infusion. Fluorescently-labeled blood vessels (green) that intersect the imaging plane can be seen, but there are no nanoparticles present because they are released from the probe that is 243 μm below the imaging plane. In the second image (Figure 2(B)), fluorescently-labeled nanoparticles (red) can be seen in the perivascular spaces of a few blood vessels in the lower left part of the image. In the third panel (Figure 2(C)), more of the blood vessels are surrounded by nanoparticles. Other nanoparticles have started to fill the space between vessels in Figures 2(C) and 2(D). The nanoparticles did not spread into the tissue in a direction perpendicular to the penetrating vessels in appreciable amounts on the time scale of our experiments. The fluorescence in the perivascular space was primarily constrained around arterioles, with a small amount of fluorescence extending a short distance (∼40-50 μm) along capillaries that branch from penetrating arterioles. This can be seen in detail in Figure 3. This distribution of perivascular fluorescence could be expected, because we selected our imaging plane to have the greatest possible number of vertically penetrating cortical vessels. Researchers have demonstrated that particulates injected into sub-pial spaces and cortex are likely to be trapped in the perivascular spaces of arterioles4. The imaging data we collected represents a small fraction of the overall nanoparticle distribution in the tissue. Therefore, it is difficult to estimate the fraction of nanoparticles that were transported in perivascular spaces.
Figure 2.
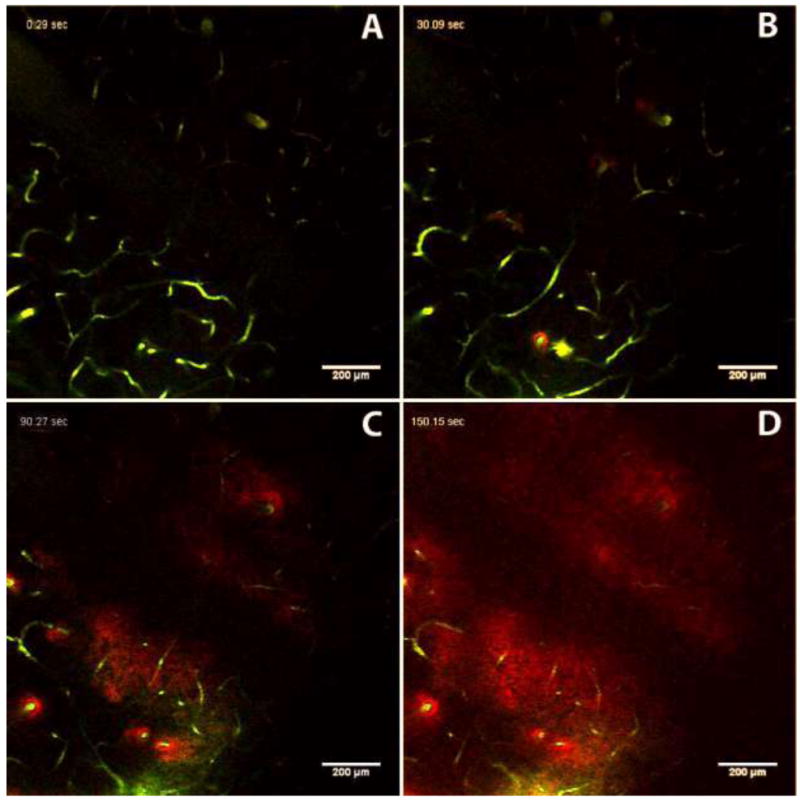
Time course showing transport of fluorescent nanoparticles (red, 24-nm nominal diameter) through perivascular spaces during CED. Fluorescently-labeled blood vessels are shown in green. Images were captured 243 μm above the outlet of the microfluidic device. Image A is at infusion time = 0 s; B = 30 s; C = 90 s; D = 150 s. Note appearance of nanoparticles around vessels in panel B, and gradual filling in of background ECS in panels C and D. The dark band across the image from top right to bottom left is due to a large blood vessel on the surface of the brain that obscures the imaging below.
Figure 3.
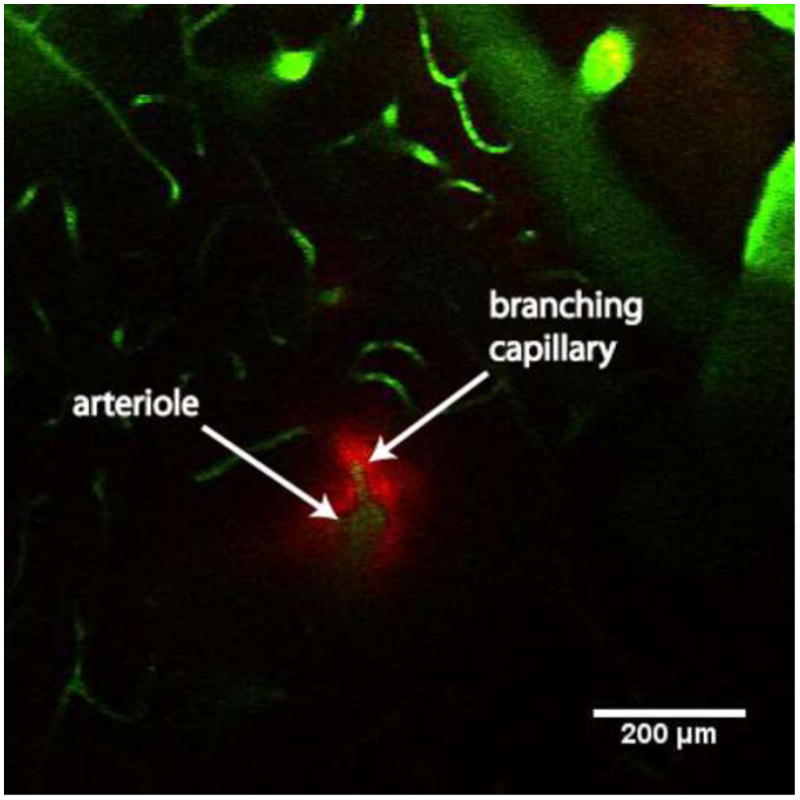
Image showing 24-nm nanoparticles (red) in perivascular spaces around a penetrating arteriole and branching capillary (blood vessels shown in green). BSA-coated red fluorescent nanoparticles were infused into the rat cortex, and the vasculature was labeled with FITC-dextran. The image shows the distribution of fluorescent nanoparticle around a branching capillary (∼10-μm diameter). Nanoparticles extend for ∼50 μm along the capillary after branching from the arteriole.
In the infusion that took 200 s (infusion 3), post-infusion analysis showed that the majority of infused fluid had travelled along the insertion track of the microfluidic device. A mechanical disturbance to the microfluidic probe resulted in tearing of the tissue around the device tip. Most of the infused fluid was transported along the high permeability device track, reducing the driving pressure to force fluid through the ECS to the perivascular space. The perivascular transport observed at the fixed imaging plane during the infusion was along a vessel that passed close to the microfluidic probe in a more ventral plane, and thereby intersected the backflowing nanoparticles in the insertion track.
For the other infusions (2, 4, and 5), the time for particles to arrive at the imaging plane was between 13 and 30 s. Fluorescence first appeared in the perivascular spaces, before gradually filling in the ECS (arrival time of 35 – 135 s; Table 1).
In infusion 4, we observed the motion of nanoparticles along an arteriole (approximately 30 μm in diameter) that lay in the imaging plane at a distance of 360 μm above the tip of the probe (Figure 4). The measured width of the perivascular space around this vessel after it filled with nanoparticles was 8 – 10 μm.
Figure 4.
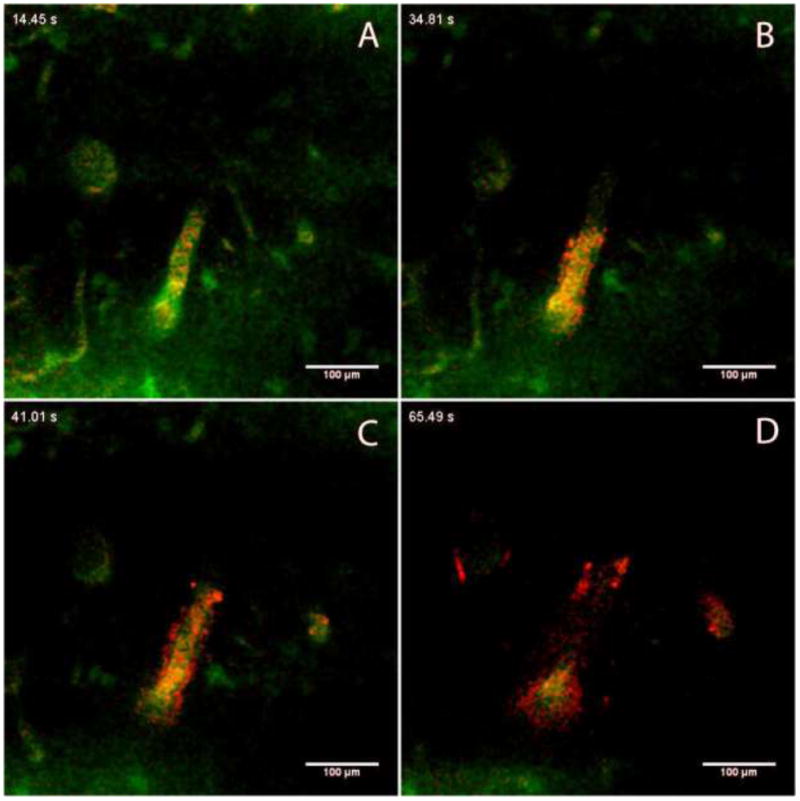
Time course showing transport of fluorescent nanoparticles (red, 24-nm nominal diameter) along a vessel in the imaging plane. The vasculature is labeled with FITC-dextran. Times represent duration of the infusion (A = 14.5 s, B = 34.8 s, C = 41.0 s and D = 65.5 s). Images were captured at a plane 360 μm above the outlet of the microfluidic probe, 240 μm below the surface of the brain.
5.1.2. 100-nm nanoparticle transport
Infusions 6 and 7 in Table 1 involve 100-nm BSA-coated nanoparticles. In infusion 6 we saw nanoparticles reach the imaging plane (a distance of 300 μm) 110 s after the infusion started. In infusion 7, nanoparticles were not observed at the fixed imaging plane during the infusion. However, post-infusion analysis revealed that the infused particles followed the perivascular space of a vessel that passed close to the outlet of the microfluidic device, but did not intersect the fixed imaging frame. Figure 5 shows a series of imaging planes in the dorso-ventral direction from this infusion. The figure shows 100-nm particles in the perivascular space of an arteriole that stretches over a distance of more than 150 micrometers. Post-infusion imaging showed that in both infusions the nanoparticles did not move extensively through the ECS, but, instead, were confined in the perivascular space of vessels (Figure 5).
Figure 5.
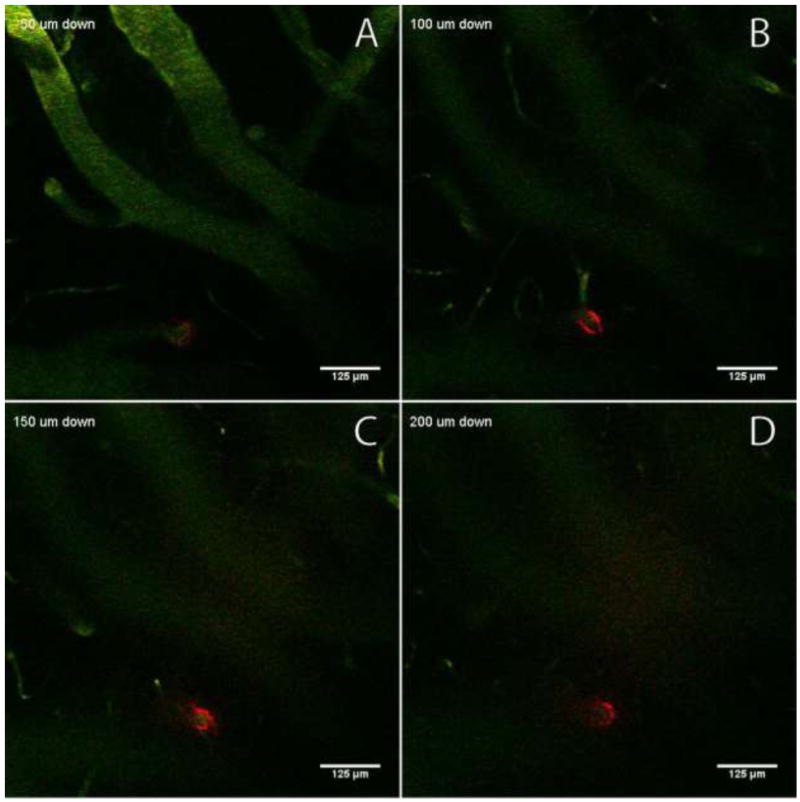
Sections from a post-infusion imaging stack in the dorsoventral direction, showing red fluorescent 100-nm nanoparticles constrained in the perivascular space (vessels shown in green). Frame A is an optical section 50 μm below the brain surface; B = 100 μm; C = 150 μm; D = 200 μm. Images show that the nanoparticles are distributed in the perivascular space of the vessel over a distance of several hundred micrometers. The outlet of the microfluidic device was 550 μm below the brain surface.
6. Discussion
6.1. 24-nm nanoparticle transport
During infusion 1, we observed a growing spot of fluorescence caused by convection of the nanoparticles through the ECS. This fluorescent area represented a plane section through an infusion volume (VINF) that increased with time. If we assume that the infusion is isotropic into a porous medium without perivascular transport, we can use data from the experiment to obtain an estimate of the flow rate of the fluorescent nanoparticles through the ECS. This procedure probably overestimates the actual flow rate through the ECS because it ignores some transport through the perivascular space. Nevertheless, we can use this estimated flow rate to compute the expected arrival times at the imaging plane in our experiments in the absence of perivascular transport and compare the expected values with our measurements to gain insight into the significance of perivascular spaces on nanoparticle transport.
Under the assumption of an isotropic infusion into a porous medium from a point source, the infusion volume is spherical, and the plane section is a circle (see Figure 6(a)). The area of this plane section is given by:
Figure 6.
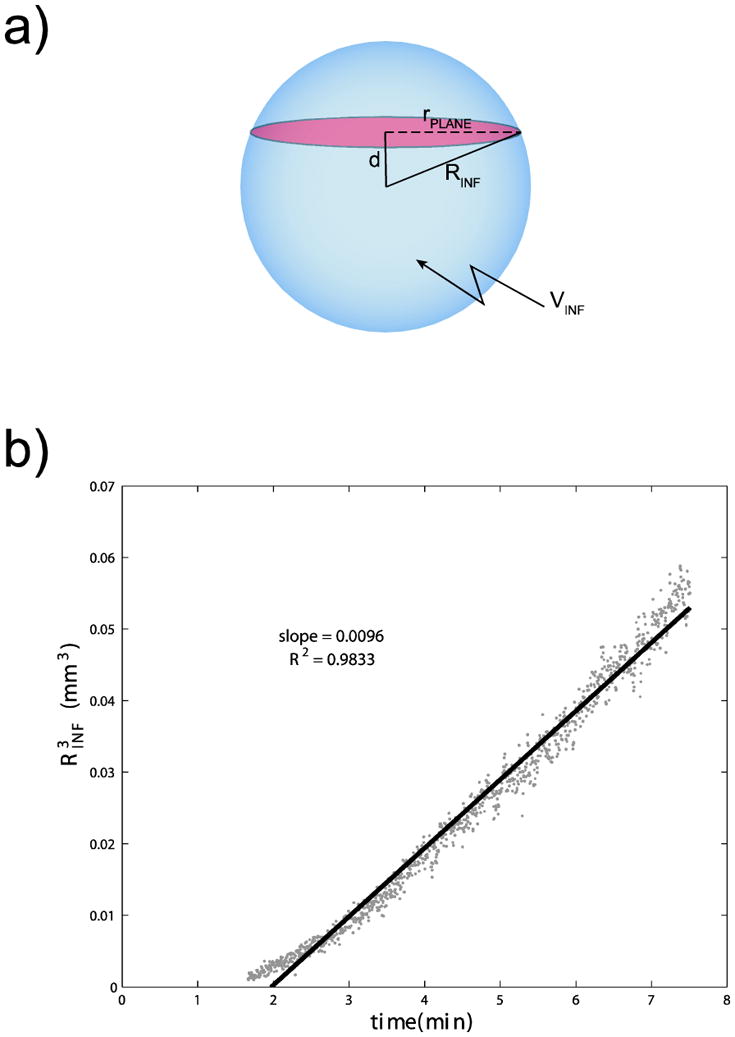
a) Schematic showing geometry used in determining the flow rate of nanoparticles. The blue sphere represents the volume of infusion, and the red plane represents the area measured in our imaging stacks. b) Plot of (see Equation 2) as a function of time, for infusion of 24-nm nanoparticles (infusion 1). The slope of 0.0096 μl/min allows us to determine the nanoparticle flow rate to be 0.008 μl/min.
| (1) |
where APLANE is the cross-sectional area of the observed spot of fluorescence, RINF is the radius of the spherical infusion volume, and d is the distance of the plane section from the center of the infusion volume, which is 94 μm in this case.
Rearranging equation 1 yields:
| (2) |
The infusion volume at time, t, is given by:
| (3) |
where Q is the volumetric infusion rate, and φ is the porosity of brain tissue (∼0.220). Combining equations 2 and 3 gives:
| (4) |
Plotting the right hand side of equation 4 (i.e. ) as a function of time yields a straight line of slope, m, where:
| (5) |
Using APLANE as measured from our imaging stack and d = 0.094 mm, (Figure 6(b)), we can estimate the flow rate of nanoparticles through the ECS for this infusion to be 0.008 μl/min. This approximation is subject to the following assumptions: 1) effects of perivascular transport are neglected; 2) there is minimal diffusion of the nanoparticles on the timescale of the imaging experiments, which is reasonable given that the nanoparticle diameter is close to the reported pore size of the extracellular matrix29; and 3) the concentration of nanoparticles is uniform in the measured spot, which also is reasonable given that the imaging plane is 2 μm thick.
Studies of particle diffusion in the brain indicate the pore size of the extracellular matrix is between 38 and 64 nm29, which is comparable to the particle size in this experiment. Interactions between the suspended particles and constituents of the extracellular matrix can hinder the motion of particles, resulting in a longer than expected convective time. Previous studies by our group involving CED infusions of identical 24-nm nanoparticles into the rat striatum examined the penetration of infused nanoparticles into gray matter and compared it with the penetration of infused fluid. The results showed that the nanoparticles move through the tissue much more slowly than the infused fluid, which indicates that particle motion is strongly hindered19.
If we again consider the infusion to be an isotropic infusion into a porous medium from a point source, then the characteristic time tc for the convective front of infused fluid to reach a radial distance r from the point source is:
| (6) |
Using this equation with the estimated flow rate of 0.008 μl/min, we find that the characteristic times for a convective front of infused nanoparticles to reach the imaging planes in our experiments (distances of 220-360μm) are between 67 and 292 seconds.
The characteristic time td for a particle to diffuse a distance r through brain tissue can be determined from:
| (7) |
where D* is the effective diffusion coefficient of the particle in the tissue given by:
| (8) |
where D is the diffusion coefficient of the particle in a free medium and τ is the tortuosity of the extra cellular space of the brain (τ∼ 2 27, 29). The diffusion coefficient of a particle in a free medium (e.g. water) can be estimated from the Stokes-Einstein equation:
| (9) |
where k is the Boltzmann constant (1.38065×10⁻²³ m2kgs−2K−1), T is the temperature in Kelvin (310 K), dH is the hydrodynamic diameter of the particle (24 nm for the largest possible value of D), and η is the viscosity of the free medium at the temperature T (6.915×10⁻⁴ Pa.s29). Using these equations, and assuming that the nanoparticles are able to diffuse through the pores of the ECM, we find that the characteristic time required for a particle to reach our imaging plane from the outlet of the probe, a distance of 220 to 360 μm, by pure diffusion is between 90 and 241 min.
In our experiments, the time taken for fluorescence to appear at the imaging plane ranged from 13 to 30 s (infusions 2, 4, and 5; Table 1), which is much shorter than the characteristic time for hindered convective transport (67 – 292 s) or diffusive transport (90 – 241 min). Note that Infusion 3 was not included due to the fact that a mechanical disturbance caused the infusate to backflow around the shank of the device. This suggests that convective transport through the perivascular spaces allows these particles to move through brain tissue much more rapidly than by convection or diffusion through the ECS.
In infusion 4 we observed nanoparticles moving through the perivascular spaces of an arteriole that lay in the imaging plane (Figure 4; Movie 2). This in-plane view of the vessel unequivocally demonstrates that nanoparticles are constrained in, and rapidly travelling along, the perivascular spaces of the vessels.
6.2. 100-nm nanoparticle transport
In infusion 6, 100-nm particles reached the imaging plane (a distance of 300 μm) 110 s after the infusion started, which was approximately 4 times longer than required for 24-nm particles. The long time taken for the nanoparticles to appear at the imaging plane is likely due to greatly hindered transport through the ECS, since their diameter is about twice the estimated average pore size of the extracellular matrix29. However, once the nanoparticles reach the perivascular space, there is little structure present to impede their motion21. This suggests that perivascular spaces are more important transport routes for particles larger than the pore size of the ECS than for smaller particles that undergo less hindered transport in the ECS.
It seems clear from these limited data that the spread of the 100-nm particles in the ECS is much less than the corresponding spread of the 24-nm particles. This suggests that the fraction of particles that moved through the perivascular space rather than through the ECS was larger for the 100-nm particles than for the 24-nm particles, which could explain the relatively inhomogeneous distribution observed for the larger particles.
6.3. Implications for CED-based therapies
These results suggest that it is essential to consider effects of perivascular transport when planning CED protocols. Effects of perivascular transport may be beneficial in some cases, but detrimental in others. 2PEF studies of cancer cells have shown that migrating glioma cells travel farther and faster in perivascular spaces than they do through the ECS, and that these cells promote angiogenesis from the blood vessels they track32. These are the cells that are most likely to be left behind after tumor resection, leading to tumor recurrence. One could envision a post-resection CED treatment that exploits the hydrodynamic properties of nanoparticles to preferentially track and target infiltrating glioma cells in the perivascular spaces of the peritumoral tissue. A thorough understanding of the target tissue vasculature and the in vivo transport characteristics of the therapy would be required to exploit this strategy.
Conversely, there may be situations where perivascular transport of infused therapeutics is undesirable. If a CED therapy involves delivering constructs that undergo hindered transport through the ECM to a target where perivascular spaces are present, those perivascular spaces may provide a high permeability path of undesired egress into healthy tissue. In such a case, it may be of use to increase the hydraulic permeability of the bulk extracellular space to reduce the likelihood that the particles will travel along the blood vessels to healthy tissue. The hydraulic permeability can be modified through degrading or dilating the extra cellular matrix as demonstrated by Neeves and coworkers19. An alternative way to decrease the fraction of the therapeutic that escapes the target area through perivascular spaces would be to make the constructs smaller, thereby increasing the apparent permeability of the ECM seen by the particles.
The use of 2PEF to observe the dynamics of perivascular transport provides high resolution and quantitative information that cannot be obtained with other imaging techniques. However, there are limitations to the use of 2PEF that should be mentioned. Even for the relatively low infusion rates and low infusion volumes used in these experiments, it was not possible to map the entire infusate distribution in the parenchyma. Since the infusate distribution is roughly symmetrical about the outlet of the device, some of the infusate moves too deep into the tissue for us to image. Further, the imaging plane we use covers only a small cross section (up to ∼2 mm square) of the injected volume. Without rapidly moving the imaging plane in all three dimensions, it is impossible to image the infusate distribution outside of the imaging plane. If the front of infused fluid reaches a fluid sink, such as the surface of the brain or a ventricle, it would not be captured in the 2PEF image. Despite these limitations, the technique is a still a powerful method to assess particle and infusate dynamics at the leading edge of an infusion volume, since no other in vivo imaging technique provides comparable temporal and spatial resolution.
6.4. Conclusions
We used 2PEF microscopy to study the transport of fluorescent nanoparticles through the cortex of rats during convection-enhanced delivery via microfluidic probes. These experiments represent, to our knowledge, the first use of 2PEF microscopy for real-time in vivo tracking of infusates during CED, and show that 2PEF microscopy is a powerful tool for identifying transport characteristics of fluorescently labeled infusates through tissue. Furthermore, we present a viable technique for measuring the in vivo parenchymal flow rate of infused compounds. We examined the distributions of two different sizes of nanoparticles, and observed that perivascular spaces in the area of the microfluidic device outlet can greatly affect the transport of the particles by providing high permeability conduits for fluid transport.
Furthermore, we noted that perivascular transport is dependent on the size of the infused nanoparticle. For smaller particles that can readily pass through the ECM, the fraction of the infused particles that move through the perivascular spaces rather than through the ECS is smaller than for large particles that undergo significantly hindered transport in the ECM.
From these results, it is clear that a thorough understanding of the vasculature of the target tissue and the transport properties of the therapy being delivered are of critical importance in designing effective CED protocols.
Supplementary Material
Video 1. Movie of real-time images corresponding to the time-course in Figure 2. Images were captured at a static plane 243 μm above the outlet of the microfluidic device. Movie shows perivascular transport of 24-nm nanoparticles (red) with gradual filling of the ECS.
Video 2. Movie of real-time images corresponding to the time-course in Figure 4. Movie shows perivascular transport of 24-nm nanoparticles (red) in the perivascular space of a vessel lying in the image plane 360 μm above the microfluidic probe outlet.
Acknowledgments
This work was supported by the National Institutes of Health (Grant NS-045236 to WLO), the Ellison Medical Foundation (Grant AG-NS-0330-06 to CBS), and the American Heart Association (Grant 0735644T to CBS). This work was performed in part at the Cornell NanoScale Facility, a member of the National Nanotechnology Infrastructure Network, which is supported by the National Science Foundation (Grant ECS-0335765). Also, this work made use of STC shared experimental facilities supported by the National Science Foundation under Agreement No. ECS-9876771.
References
- 1.Abramoff MD, Magelhaes PJ, Ram SJ. Image Processing with Image. J Biophotonics International. 2004;11:36–42. [Google Scholar]
- 2.Bezemer JM, Grijpma DW, Dijkstra PJ, van Blitterswijk CA, Feijen J. A controlled release system for proteins based on poly(ether ester) block-copolymers: polymer network characterization. J Control Release. 1999;62:393–405. doi: 10.1016/s0168-3659(99)00170-4. [DOI] [PubMed] [Google Scholar]
- 3.Bobo RH, Laske DW, Akbasak A, Morrison PF, Dedrick RL, Oldfield EH. Convection-enhanced delivery of macromolecules in the brain. Proc Natl Acad Sci U S A. 1994;91:2076–2080. doi: 10.1073/pnas.91.6.2076. [DOI] [PMC free article] [PubMed] [Google Scholar]
- 4.Carare RO, Bernardes-Silva M, Newman TA, Page AM, Nicoll JAR, Perry VH, Weller RO. Solutes, but not cells, drain from the brain parenchyma along basement membranes of capillaries and arteries: significance for cerebral amyloid angiopathy and neuroimmunology. Neuropathol Appl Neurobiol. 2008;34:131–144. doi: 10.1111/j.1365-2990.2007.00926.x. [DOI] [PubMed] [Google Scholar]
- 5.Cserr HF, Ostrach LH. Bulk flow of interstitial fluid after intracranial injection of blue dextran 2000. Exp Neurol. 1974;45:50–60. doi: 10.1016/0014-4886(74)90099-5. [DOI] [PubMed] [Google Scholar]
- 6.Cunningham J, Pivirotto P, Bringas J, Suzuki B, Vijay S, Sanftner L, Kitamura M, Chan C, Bankiewicz KS. Biodistribution of adeno-associated virus type-2 in nonhuman primates after convection-enhanced delivery to brain. Mol Ther. 2008;16:1267–1275. doi: 10.1038/mt.2008.111. [DOI] [PMC free article] [PubMed] [Google Scholar]
- 7.Denk W, Delaney KR, Kleinfeld D, Strowbridge B, Tank DW, Yuste R. Anatomical and functional imaging of neurons and circuits using two photon laser scanning microscopy. Journal of Neuroscience Methods. 1994;54:151–162. doi: 10.1016/0165-0270(94)90189-9. [DOI] [PubMed] [Google Scholar]
- 8.Denk W, Strickler JH, Webb WW. Two-photon laser scanning fluorescence microscopy. Science. 1990;248:73–76. doi: 10.1126/science.2321027. [DOI] [PubMed] [Google Scholar]
- 9.Göbel W, Kampa BM, Helmchen F. Imaging cellular network dynamics in three dimensions using fast 3D laser scanning. Nat Methods. 2007;4:73–79. doi: 10.1038/nmeth989. [DOI] [PubMed] [Google Scholar]
- 10.Gregory TF, Rennels ML, Blaumanis OR, Fujimoto K. A method for microscopic studies of cerebral angioarchitecture and vascular-parenchymal relationships, based on the demonstration of ‘paravascular’ fluid pathways in the mammalian central nervous system. J Neurosci Methods. 1985;14:5–14. doi: 10.1016/0165-0270(85)90110-4. [DOI] [PubMed] [Google Scholar]
- 11.Hadaczek P, Yamashita Y, Mirek H, Tamas L, Bohn MC, Noble C, Park JW, Bankiewicz K. The “perivascular pump” driven by arterial pulsation is a powerful mechanism for the distribution of therapeutic molecules within the brain. Mol Ther. 2006;14:69–78. doi: 10.1016/j.ymthe.2006.02.018. [DOI] [PMC free article] [PubMed] [Google Scholar]
- 12.Hutchings M, Weller RO. Anatomical relationships of the pia mater to cerebral blood vessels in man. J Neurosurg. 1986;65:316–325. doi: 10.3171/jns.1986.65.3.0316. [DOI] [PubMed] [Google Scholar]
- 13.Ichimura T, Fraser PA, Cserr HF. Distribution of extracellular tracers in perivascular spaces of the rat brain. Brain Res. 1991;545:103–113. doi: 10.1016/0006-8993(91)91275-6. [DOI] [PubMed] [Google Scholar]
- 14.Kleinfeld D, Mitra PP, Helmchen F, Denk W. Fluctuations and stimulus-induced changes in blood flow observed in individual capillaries in layers 2 through 4 of rat neocortex. Proceedings of the National Academy of Sciences USA. 1998;95:15741–15746. doi: 10.1073/pnas.95.26.15741. [DOI] [PMC free article] [PubMed] [Google Scholar]
- 15.Krauze MT, Saito R, Noble C, Bringas J, Forsayeth J, McKnight TR, Park J, Bankiewicz KS. Effects of the perivascular space on convection-enhanced delivery of liposomes in primate putamen. Exp Neurol. 2005;196:104–111. doi: 10.1016/j.expneurol.2005.07.009. [DOI] [PubMed] [Google Scholar]
- 16.Lidar Z, Mardor Y, Jonas T, Pfeffer R, Faibel M, Nass D, Hadani M, Ram Z. Convection-enhanced delivery of paclitaxel for the treatment of recurrent malignant glioma: a phase I/II clinical study. J Neurosurg. 2004;100:472–479. doi: 10.3171/jns.2004.100.3.0472. [DOI] [PubMed] [Google Scholar]
- 17.Mamot C, Nguyen JB, Pourdehnad M, Hadaczek P, Saito R, Bringas JR, Drummond DC, Hong K, Kirpotin DB, McKnight T, Berger MS, Park JW, Bankiewicz KS. Extensive distribution of liposomes in rodent brains and brain tumors following convection-enhanced delivery. J Neurooncol. 2004;68:1–9. doi: 10.1023/b:neon.0000024743.56415.4b. [DOI] [PubMed] [Google Scholar]
- 18.Neeves KB, Lo CT, Foley CP, Saltzman WM, Olbricht WL. Fabrication and characterization of microfluidic probes for convection enhanced drug delivery. J Control Release. 2006;111:252–262. doi: 10.1016/j.jconrel.2005.11.018. [DOI] [PubMed] [Google Scholar]
- 19.Neeves KB, Sawyer AJ, Foley CP, Saltzman WM, Olbricht WL. Dilation and degradation of the brain extracellular matrix enhances penetration of infused polymer nanoparticles. Brain Res. 2007;1180:121–132. doi: 10.1016/j.brainres.2007.08.050. [DOI] [PMC free article] [PubMed] [Google Scholar]
- 20.Nicholson C. Diffusion and related transport mechanisms in brain tissue. Reports On Progress In Physics. 2001;64:815–884. [Google Scholar]
- 21.Patek P. The perivascular spaces of the mammalian brain. The Anatomical Record. 1944;88:1–24. [Google Scholar]
- 22.Preston SD, Steart PV, Wilkinson A, Nicoll JAR, Weller RO. Capillary and arterial cerebral amyloid angiopathy in Alzheimer's disease: defining the perivascular route for the elimination of amyloid beta from the human brain. Neuropathol Appl Neurobiol. 2003;29:106–117. doi: 10.1046/j.1365-2990.2003.00424.x. [DOI] [PubMed] [Google Scholar]
- 23.Rennels ML, Gregory TF, Blaumanis OR, Fujimoto K, Grady PA. Evidence for a ‘paravascular’ fluid circulation in the mammalian central nervous system, provided by the rapid distribution of tracer protein throughout the brain from the subarachnoid space. Brain Res. 1985;326:47–63. doi: 10.1016/0006-8993(85)91383-6. [DOI] [PubMed] [Google Scholar]
- 24.Saito R, Krauze MT, Noble CO, Drummond DC, Kirpotin DB, Berger MS, Park JW, Bankiewicz KS. Convection-enhanced delivery of Ls-TPT enables an effective, continuous, low-dose chemotherapy against malignant glioma xenograft model. Neuro Oncol. 2006;8:205–214. doi: 10.1215/15228517-2006-001. [DOI] [PMC free article] [PubMed] [Google Scholar]
- 25.Schaffer CB, Friedman B, Nishimura N, Schroeder LF, Tsai PS, Ebner FF, Lyden PD, Kleinfeld D. Two-photon imaging of cortical surface microvessels reveals a robust redistribution in blood flow after vascular occlusion. PLoS Biol. 2006;4:e22. doi: 10.1371/journal.pbio.0040022. [DOI] [PMC free article] [PubMed] [Google Scholar]
- 26.Squirrell JM, Wokosin DL, White JG, Bavister BD. Long-term two-photon fluorescence imaging of mammalian embryos without compromising viability. Nat Biotechnol. 1999;17:763–7. doi: 10.1038/11698. [DOI] [PMC free article] [PubMed] [Google Scholar]
- 27.Stroh M, Zipfel WR, Williams RM, Webb WW, Saltzman WM. Diffusion of nerve growth factor in rat striatum as determined by multiphoton microscopy. Biophys J. 2003;85:581–588. doi: 10.1016/S0006-3495(03)74502-0. [DOI] [PMC free article] [PubMed] [Google Scholar]
- 28.Svoboda K, Denk W, Kleinfeld D, Tank DW. In vivo dendritic calcium dynamics in neocortical pyramidal neurons. Nature. 1997;385:161–165. doi: 10.1038/385161a0. [DOI] [PubMed] [Google Scholar]
- 29.Thorne RG, Nicholson C. In vivo diffusion analysis with quantum dots and dextrans predicts the width of brain extracellular space. Proc Natl Acad Sci U S A. 2006;103:5567–5572. doi: 10.1073/pnas.0509425103. [DOI] [PMC free article] [PubMed] [Google Scholar]
- 30.Wang P, Olbricht WL. Fluid mechanics in the perivascular space. J Theor Biol. 2011;274:52–57. doi: 10.1016/j.jtbi.2011.01.014. [DOI] [PubMed] [Google Scholar]
- 31.Weed L. The absorption of cerebrospinal fluid into the venous system. American Journal of Anatomy. 1923;31:191–221. [Google Scholar]
- 32.Winkler F, Kienast Y, Fuhrmann M, Baumgarten LV, Burgold S, Mitteregger G, Kretzschmar H, Herms J. Imaging glioma cell invasion in vivo reveals mechanisms of dissemination and peritumoral angiogenesis. Glia. 2009;57:1306–1315. doi: 10.1002/glia.20850. [DOI] [PubMed] [Google Scholar]
- 33.Woollam DH, Millen JW. The perivascular spaces of the mammalian central nervous system and their relation to the perineuronal and subarachnoid spaces. J Anat. 1955;89:193–200. [PMC free article] [PubMed] [Google Scholar]
- 34.Zhang ET, Inman CB, Weller RO. Interrelationships of the pia mater and the perivascular (Virchow-Robin) spaces in the human cerebrum. J Anat. 1990;170:111–123. [PMC free article] [PubMed] [Google Scholar]
- 35.Zhang ET, Richards HK, Kida S, Weller RO. Directional and compartmentalised drainage of interstitial fluid and cerebrospinal fluid from the rat brain. Acta Neuropathol. 1992;83:233–239. doi: 10.1007/BF00296784. [DOI] [PubMed] [Google Scholar]
Associated Data
This section collects any data citations, data availability statements, or supplementary materials included in this article.
Supplementary Materials
Video 1. Movie of real-time images corresponding to the time-course in Figure 2. Images were captured at a static plane 243 μm above the outlet of the microfluidic device. Movie shows perivascular transport of 24-nm nanoparticles (red) with gradual filling of the ECS.
Video 2. Movie of real-time images corresponding to the time-course in Figure 4. Movie shows perivascular transport of 24-nm nanoparticles (red) in the perivascular space of a vessel lying in the image plane 360 μm above the microfluidic probe outlet.