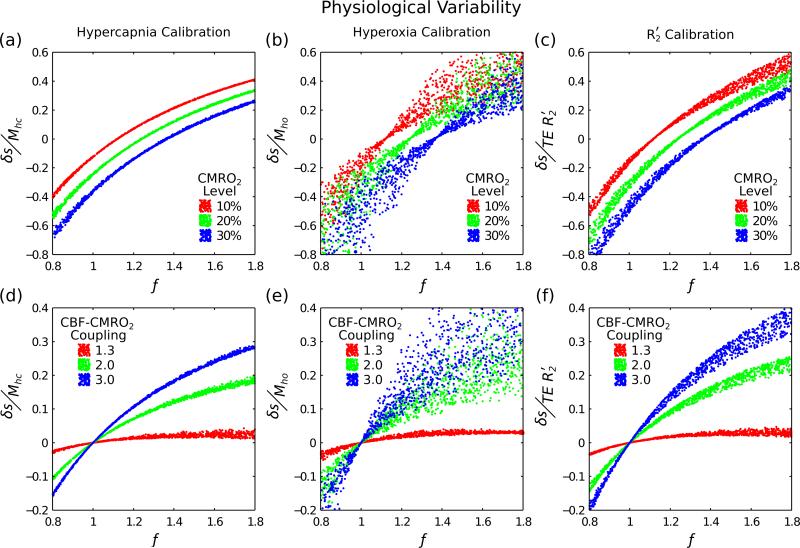
Figure 2.
Three different calibration techniques were investigated to account for physiological variability; hypercapnia, hyperoxia, and R2′ calibration (columns left-right). By simultaneously varying haematocrit (0.37-0.50), oxygen extraction fraction (0.30-0.55) and blood volume (0.01-0.10) we are able to assess how well each method copes with this physiological variability. Simulations were performed for both fixed increases in CMRO2 (top row) and for fixed coupling of CBF and CMRO2 (Eq. (10)) (bottom row). For a perfect calibration each of simulated points should fall on a single curve, which should be distinctly different for each CMRO2 level or CBF-CMRO2 coupling value.

