Abstract
We have developed an adaptive optics photoacoustic microscope (AO-PAM) for high-resolution imaging of biological tissues, especially the retina. To demonstrate the feasibility of AO-PAM we first designed the AO system to correct the wavefront errors of the illuminating light of PAM. The aberrations of the optical system delivering the illuminating light to the sample in PAM was corrected with a close-loop AO system consisting of a 141-element MEMS-based deformable mirror (DM) and a Shack-Hartmann (SH) wavefront sensor operating at 15 Hz. The photoacoustic signal induced by the illuminating laser beam was detected by a custom-built needle ultrasonic transducer. When the wavefront errors were corrected by the AO system, the lateral resolution of PAM was measured to be better than 2.5 µm using a low NA objective lens. We tested the system on imaging ex vivo ocular samples, e.g., the ciliary body and retinal pigment epithelium (RPE) of a pig eye. The AO-PAM images showed significant quality improvement. For the first time we were able to resolve single RPE cells with PAM.
OCIS codes: (110.1085) Adaptive imaging, (110.5120) Photoacoustic imaging, (110.0180) Microscopy
1. Introduction
Photoacoustic microscopy (PAM) [1–6] is a novel microscopic imaging modality that can provide three–dimensional, high-resolution vasculature imaging. It can also provide functional imaging of biological tissues such as the blood vessel oxygen saturation by using multiple wavelength illumination. PAM detects the ultrasonic waves (PA waves) generated by pulsed laser-induced localized thermal expansion in biological tissues as a result of specific optical absorption. Recently, we developed the optical coherence tomography (OCT) guided photoacoustic ophthalmoscopy (PAOM) [7], which extended the laser scanning optical-resolution PAM (LSOR-PAM) [8–10] to retinal imaging. We have successfully used PAOM to image the retinal vasculature and the melanin distribution in the retinal pigment epithelium (RPE) of rat eye in vivo. Imaging RPE is important since its dysfunction contributes to age-related macular degeneration (AMD), a leading blinding disease in the industrialized world.
The axial resolution of PAOM is determined by the bandwidth and center frequency of the ultrasonic transducer. The lateral resolution of PAOM is determined by the smallest achievable spot size of the illuminating light on the retina. In imaging the eye in vivo, for large pupil diameters, monochromatic aberrations of the eye are the major factors that limit the achievable resolution of retinal images [11]. Although the depth resolution of PAOM could be improved by increasing the bandwidth of the ultrasonic detecting system, the lateral resolution of PAOM is still limited by the optics. One possible approach for correcting the ocular aberrations to decrease the spot size of the illuminating light on the retina, and therefore improve the lateral resolution of PAOM, is to use adaptive optics (AO) [12,13]. AO has been applied to ophthalmic imaging with great success, which makes it possible to image single photo-receptors [14–17]. AO has also been successfully integrated in OCT [18–23], scanning laser ophthalmoscopy (SLO) [24–28], and microscopy [29–33].
In this paper we present a feasibility study on the integration of AO with PAM for ex vivo imaging of ocular tissues, which is a technical preparation for the ultimate AO-PAOM for in vivo retinal imaging. The goal of the current study is to correct the aberrations of the optical system for delivering the illuminating light to the sample.
2. Experimental system
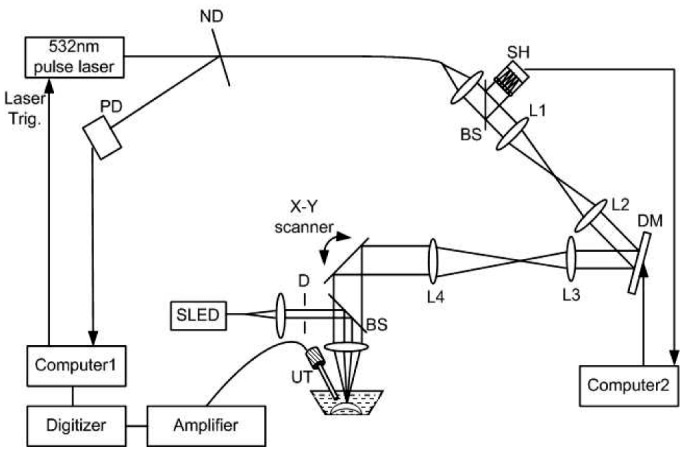
Figure 1 shows a schematic of the AO-PAM experimental system. A compact close-loop AO system was integrated into a LSOR-PAM. The AO system consists of a real-time Shack-Hartmann wavefront sensor (SH sensor, 39x31 maximum active lenslets, Thorlabs, USA) operating at 15Hz and a 141-element MEMS-based deformable mirror (DM, Thorlabs, USA).
Fig. 1.

Schematic of the experimental AO-PAM system. ND: neutral density filter; PD: photodiode; D: diaphragm; L1-L4: achromatic lenses; DM: deformable mirror; SH: Shack-Hartmann wavefront sensor; BS: pellicle beamsplitter (reflection: 8%, transmission 92%); UT: ultrasonic transducer.
The illumination light source of the PAM was a frequency-doubled Q-switched Nd:YAG laser (SPOT-10-100-532, Elforlight Ltd, UK) with the following parameters: wavelength = 532nm, pulse energy = 10 µJ/pulse, pulse duration = 2 ns, and maximal pulse repetition rate = 30 kHz. The output laser light was attenuated with a neutral density (ND) filter before coupled into a single mode optical fiber (SMF). The light reflected from the surface of the ND filter is detected by a photodiode (DET10A, Thorlabs, Inc.), which provided trigger for PAM signal acquisition. The output laser light from the SMF was first collimated into a beam diameter of 4.4 mm, passed through a two-f system (L1 and L2, f = 75mm), and was then projected onto the DM (Clear aperture: 4.4mm x 4.4mm). Another two-f system (L3 and L4, f = 100 mm and f = 225 mm, respectively) expanded the beam reflected from the DM into 10mm in diameter and projected the beam onto an X-Y galvanometer scanner. The X-Y galvanometer, DM, and SH were conjugated with each other. The light beam was finally focused on the sample by an objective lens (f = 30 mm, Φ = 25.4 mm, Achromatic Lens, VIS-NIR, Edmund Optics, Inc). The galvanometer scanner was controlled by an analogue-output board, whose sample clock was used to trigger the laser.
To avoid speckles formed by the interference of the reflected light from the sample, a superluminescent diode (SLD, power = 10 mW, bandwidth = 50nm, central wavelength = 840nm, Superlum, Russia) was used as the AO light source. The AO beam was first collimated (beam diameter < 1 mm) and then coupled into the center line of the PAM illuminating light path by a pellicle beam-splitter (BP-108, Uncoated, Throlabs, USA), which reflects 8% of the AO light onto the objective lens while transmitting 92% of the back-scattered light from the sample. The diffusely reflected light from the sample could be considered to have a spherical wavefront emitted from a point light source. This wavefront passed through the DM and was delivered into the SH by another pellicle beam-splitter. Therefore, the AO beam travelled through the same path as the PA laser beam illuminating the samples. The DM consists of a continuous mirror membrane that is deformed by electrostatic actuators ensuring deformation without hysteresis. Each actuator provides a stroke of 3.5µm over a compact area with low influence on neighboring actuators. The control software AOkit (Thorlabs, USA) [34] minimized the wavefront errors by analyzing the signals from the SH and determined the appropriate drive signals for the DM actuators to compensate for the wavefront aberrations. After successfully correcting the wavefront errors for the reflected AO beam, the surface profile of the DM was recorded and used to compensate for the PAM light.
The induced PA waves from the sample were detected by a custom-built needle ultrasonic transducer (30 MHz; bandwidth: 50%; active element diameter: 1 mm). The detected PA signals were first amplified by 80 dB and then digitized by a high-speed digitizer (CompuScope14200, Gage Applied Technologies) at a sampling rate of 200 MS/s. The laser pulse energy was measured to be 40 nJ at the sample surface, which is within the ANSI laser safety limit for eye imaging [7]. As reported in our previous publications, the depth resolution is 23 µm. In the experiments the laser was triggered at a pulse repetition rate of 24 kHz. The acquisition of one three-dimensional PAM data set consisting of 256 × 256 A-lines took 2.7 seconds. During imaging, the samples were immersed in a water tank and the transducer was positioned about 4 mm away from them.
3. Results and discussion
We first used a white paper as a sample for the measurement and correction of the wavefront errors. Figure 2(a) shows the first four order Zernike coefficients before and after wavefront correction [35]. The Zernike coefficients, especially the lower-order Zernike coefficients (the first and second orders) decreased significantly after AO correction. Figure 2(b) and 2(c) show the corresponding point-spread-functions (PSFs) and RMS wavefront errors with and without AO calculated from the measured wavefronts, respectively. The results demonstrated the effective measurement and correction of the lower and higher order aberrations using the AO light. After the correction capability of our system was demonstrated, the surface profile of the DM was saved for the next experiments.
Fig. 2.
(a) The first four order Zernike coefficients without/within AO, (b) corresponding PSF without AO, (c) corresponding PSF with AO.
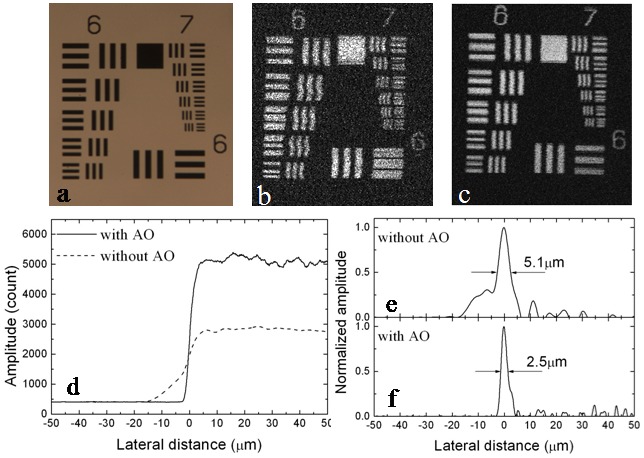
The lateral resolution of the AO-PAM was first evaluated by imaging a United States Air Force resolution target (USAF 1951 Chart, Edmund Optics, Inc.), which reached element 6 of group 7, corresponding to a resolution of 2.19 µm (228.07 cycles/mm). The measured images of Group 6 and 7 of the target are shown in Fig. 3 : (a) light microscopy image, (b) maximum amplitude projection (MAP) of the PAM image without AO, and (c) MAP of the PAM image with AO. The bars within the 6th element of Group 7 were clearly resolved in Fig. 3(c). We also measured the edge response by imaging the edge of the black square on the same resolution target [Fig. 3(d)]. The PSFs [Fig. 3(c) and 3(d)] were calculated from the measured edge response by differentiation. The calculation showed that the lateral resolution was improved from 5.1 µm without AO to 2.5 µm with AO. From the images we can also see that our system has uniform lateral resolutions in the X and Y directions.
Fig. 3.
(a) – (c) Images of Group 6 and 7 of the USAF 1951 Chart: (a) Light microscopy image, (b) MAP of the PAM image without AO, (c) MAP of the PAM image of the same target with AO. d: measured edge response; e: PSF calculated from the data in (d) without AO; f: PSF calculated from the data in (d) with AO.
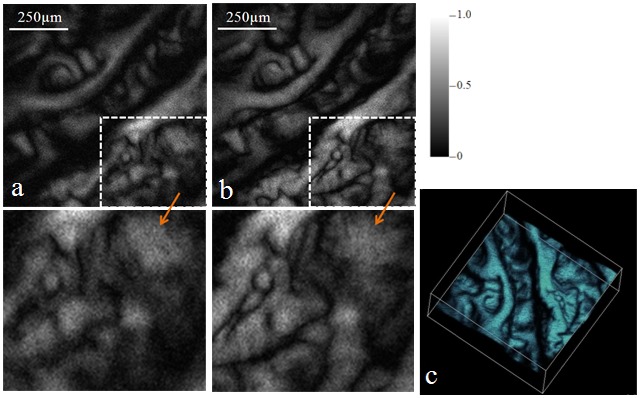
We then tested the system on imaging excised biological samples ex vivo. We first imaged the ciliary body of a pig eye. The eye was acquired from a local slaughter house and was fixed in 10% formalin. The eyeball was cut in half to expose the ciliary body. Figure 4 shows the experimental results. Figure 4(a) and 4(b) show the MAP of the PAM images without and with AO corrections, respectively. Each image consists of 256 × 256 pixels covering an area of about 1mm × 1mm. Figure 4(c) is a 3D rendering of the PAM data set. The images showed interesting melanin distributions in the ciliary body. Compared with the image without AO correction, the PAM image with AO correction resolved many more details of the sample (see the enlarged areas pointed by the arrows). Due to better light energy concentration within the focus with AO correction, the PA signals are also stronger in Fig. 4(b) than in Fig. 4(a). As a result, the images with AO correction also have a better signal-to-noise ratio (SNR).
Fig. 4.
MAP of the PAM images of the ciliary body of a pig eye: (a) without AO, (b) with AO, (c) ( Media 1 (1.8MB, MPG) ) 3D rendering of the PAM data set. The area outlined in each image was enlarged and shown as pointed by the arrows.
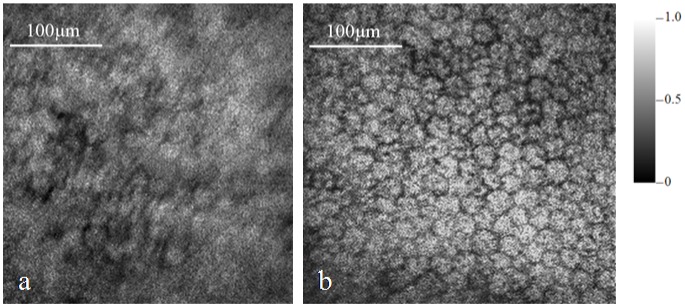
We then moved on to image the RPE of the same pig eye. The acquired PAM images without and with AO correction are shown in Fig. 5(a) and 5(b), respectively. The MAP images consist of 256 × 256 pixels covering an area of 0.4 mm × 0.4 mm. From the images we can see significant resolution improvement of the image with AO compared with the image without AO. In the image with AO single RPE cells are well resolved while in the image without AO the RPE cells are barely recognizable.
Fig. 5.
MAP of the PAM images of the RPE of the pig eye: (a) without AO, (b) with AO.
Since PAM images the absorption contrast, Fig. 5(b) shows the concentration of absorbers at the wavelength of the laser light (532 nm). The main light-absorbing substances in RPE at 532 nm are melanin and lipofusin. We have verified in our previous experiments with lipofusin control slides that lipofusin does not generate detectable PA signals at the same experimental conditions, i.e., the same illuminating wavelength, pulse energy, and ultrasonic detecting system. As a result, we can conclude that Fig. 5(b) shows the melanin distribution in and outside the RPE cells. From the image we can see that the boundaries among the RPE cells have no or weak PA signals, which means that RPE melanin concentrates inside the cells. We can also observe a dark spot inside each RPE cell. We hypothesize that the dark spot represents the location of the nucleus.
4. Conclusion
We have successfully integrated AO with PAM. We have evaluated the improved lateral resolution by correcting the wavefront aberrations of the illuminating optics of PAM with AO. The experimental results on biological samples have demonstrated not only significant improvement on the lateral resolution of PAM but also improvement on the SNR. For the first time single RPE cells are resolved with AO-PAM based on optical absorption contrast. The current study has laid the foundation for the ultimate AO-PAM for in vivo imaging of the RPE. Although for in vivo imaging the major task of the AO system will be correcting the aberrations of the eye, the system layout will be the same except an ocular lens will be added.
Acknowledgment
The research was supported in part by the National Institutes of Health grant 7R21EB008800-02 and the Juvenile Diabetes Research Foundation Innovative Grant 5-2009-498. Both S. Jiao and H. F. Zhang are corresponding authors for this work.
References and links
- 1.Maslov K., Zhang H. F., Hu S., Wang L. V., “Optical-resolution photoacoustic microscopy for in vivo imaging of single capillaries,” Opt. Lett. 33(9), 929–931 (2008). 10.1364/OL.33.000929 [DOI] [PubMed] [Google Scholar]
- 2.Zhang H. F., Maslov K., Stoica G., Wang L. V., “Functional photoacoustic microscopy for high-resolution and noninvasive in vivo imaging,” Nat. Biotechnol. 24(7), 848–851 (2006). 10.1038/nbt1220 [DOI] [PubMed] [Google Scholar]
- 3.Zhang H. F., Maslov K., Wang L. V., “In vivo imaging of subcutaneous structures using functional photoacoustic microscopy,” Nat. Protoc. 2(4), 797–804 (2007). 10.1038/nprot.2007.108 [DOI] [PubMed] [Google Scholar]
- 4.Zhang H. F., Maslov K., Stoica G., Wang L. V., “Imaging acute thermal burns by photoacoustic microscopy,” J. Biomed. Opt. 11(5), 054033 (2006). 10.1117/1.2355667 [DOI] [PubMed] [Google Scholar]
- 5.Hu S., Wang L. V., “Photoacoustic imaging and characterization of the microvasculature,” J. Biomed. Opt. 15(1), 011101 (2010). 10.1117/1.3281673 [DOI] [PMC free article] [PubMed] [Google Scholar]
- 6.Rao B., Li L., Maslov K., Wang L., “Hybrid-scanning optical-resolution photoacoustic microscopy for in vivo vasculature imaging,” Opt. Lett. 35(10), 1521–1523 (2010). 10.1364/OL.35.001521 [DOI] [PMC free article] [PubMed] [Google Scholar]
- 7.Jiao S., Jiang M., Hu J., Fawzi A., Zhou Q., Shung K. K., Puliafito C. A., Zhang H. F., “Photoacoustic ophthalmoscopy for in vivo retinal imaging,” Opt. Express 18(4), 3967–3972 (2010), http://www.opticsinfobase.org/abstract.cfm?URI=oe-18-4-3967 10.1364/OE.18.003967 [DOI] [PMC free article] [PubMed] [Google Scholar]
- 8.Xie Z., Jiao S., Zhang H. F., Puliafito C. A., “Laser-scanning optical-resolution photoacoustic microscopy,” Opt. Lett. 34(12), 1771–1773 (2009). 10.1364/OL.34.001771 [DOI] [PubMed] [Google Scholar]
- 9.Jiao S., Xie Z., Zhang H. F., Puliafito C. A., “Simultaneous multimodal imaging with integrated photoacoustic microscopy and optical coherence tomography,” Opt. Lett. 34(19), 2961–2963 (2009). 10.1364/OL.34.002961 [DOI] [PMC free article] [PubMed] [Google Scholar]
- 10.Zhang H. F., Wang J., Wei Q., Liu T., Jiao S., Puliafito C. A., “Collecting back-reflected photons in photoacoustic microscopy,” Opt. Express 18(2), 1278–1282 (2010), http://www.opticsinfobase.org/abstract.cfm?URI=oe-18-2-1278 10.1364/OE.18.001278 [DOI] [PMC free article] [PubMed] [Google Scholar]
- 11.Artal P., Guirao A., Berrio E., Williams D. R., “Compensation of corneal aberrations by the internal optics in the human eye,” J. Vis. 1(1), 1–8 (2001). 10.1167/1.1.1 [DOI] [PubMed] [Google Scholar]
- 12.Liang J., Williams D. R., Miller D. T., “Supernormal vision and high-resolution retinal imaging through adaptive optics,” J. Opt. Soc. Am. A 14(11), 2884–2892 (1997). 10.1364/JOSAA.14.002884 [DOI] [PubMed] [Google Scholar]
- 13.Fernández E. J., Iglesias I., Artal P., “Closed-loop adaptive optics in the human eye,” Opt. Lett. 26(10), 746–748 (2001). 10.1364/OL.26.000746 [DOI] [PubMed] [Google Scholar]
- 14.Li K. Y., Roorda A., “Automated identification of cone photoreceptors in adaptive optics retinal images,” J. Opt. Soc. Am. A 24(5), 1358–1363 (2007). 10.1364/JOSAA.24.001358 [DOI] [PubMed] [Google Scholar]
- 15.Pircher M., Zawadzki R. J., Evans J. W., Werner J. S., Hitzenberger C. K., “Simultaneous imaging of human cone mosaic with adaptive optics enhanced scanning laser ophthalmoscopy and high-speed transversal scanning optical coherence tomography,” Opt. Lett. 33(1), 22–24 (2008). 10.1364/OL.33.000022 [DOI] [PMC free article] [PubMed] [Google Scholar]
- 16.Liang J., Williams D. R., Miller D. T., “Supernormal vision and high-resolution retinal imaging through adaptive optics,” J. Opt. Soc. Am. A 14(11), 2884–2892 (1997). 10.1364/JOSAA.14.002884 [DOI] [PubMed] [Google Scholar]
- 17.Chui T. Y., Song H., Burns S. A., “Adaptive-optics imaging of human cone photoreceptor distribution,” J. Opt. Soc. Am. A 25(12), 3021–3029 (2008). 10.1364/JOSAA.25.003021 [DOI] [PMC free article] [PubMed] [Google Scholar]
- 18.Hermann B., Fernández E. J., Unterhuber A., Sattmann H., Fercher A. F., Drexler W., Prieto P. M., Artal P., “Adaptive-optics ultrahigh-resolution optical coherence tomography,” Opt. Lett. 29(18), 2142–2144 (2004). 10.1364/OL.29.002142 [DOI] [PubMed] [Google Scholar]
- 19.Zawadzki R. J., Jones S. M., Olivier S. S., Zhao M., Bower B. A., Izatt J. A., Choi S., Laut S., Werner J. S., “Adaptive-optics optical coherence tomography for high-resolution and high-speed 3D retinal in vivo imaging,” Opt. Express 13(21), 8532–8546 (2005), http://www.opticsinfobase.org/abstract.cfm?id=85806 10.1364/OPEX.13.008532 [DOI] [PMC free article] [PubMed] [Google Scholar]
- 20.Zhang Y., Cense B., Rha J., Jonnal R. S., Gao W., Zawadzki R. J., Werner J. S., Jones S., Olivier S., Miller D. T., “High-speed volumetric imaging of cone photoreceptors with adaptive optics spectral-domain optical coherence tomography,” Opt. Express 14(10), 4380–4394 (2006), http://www.opticsinfobase.org/abstract.cfm?id=89918&CFID=113107704&CFTOKEN=11132256 10.1364/OE.14.004380 [DOI] [PMC free article] [PubMed] [Google Scholar]
- 21.Zhang Y., Rha J., Jonnal R., Miller D., “Adaptive optics parallel spectral domain optical coherence tomography for imaging the living retina,” Opt. Express 13(12), 4792–4811 (2005), http://www.opticsinfobase.org/abstract.cfm?URI=oe-13-12-4792 10.1364/OPEX.13.004792 [DOI] [PubMed] [Google Scholar]
- 22.Zawadzki R. J., Choi S. S., Jones S. M., Oliver S. S., Werner J. S., “Adaptive optics-optical coherence tomography: optimizing visualization of microscopic retinal structures in three dimensions,” J. Opt. Soc. Am. A 24(5), 1373–1383 (2007). 10.1364/JOSAA.24.001373 [DOI] [PMC free article] [PubMed] [Google Scholar]
- 23.Kurokawa K., Sasaki K., Makita S., Yamanari M., Cense B., Yasuno Y., “Simultaneous high-resolution retinal imaging and high-penetration choroidal imaging by one-micrometer adaptive optics optical coherence tomography,” Opt. Express 18(8), 8515–8527 (2010), http://www.opticsinfobase.org/abstract.cfm?URI=oe-18-8-8515 10.1364/OE.18.008515 [DOI] [PubMed] [Google Scholar]
- 24.Roorda A., Romero-Borja F., Donnelly Iii W., Queener H., Hebert T., Campbell M., “Adaptive optics scanning laser ophthalmoscopy,” Opt. Express 10(9), 405–412 (2002), http://www.opticsinfobase.org/abstract.cfm?URI=OE-10-9-405 [DOI] [PubMed] [Google Scholar]
- 25.Merino D., Dainty C., Bradu A., Podoleanu A. G., “Adaptive optics enhanced simultaneous en-face optical coherence tomography and scanning laser ophthalmoscopy,” Opt. Express 14(8), 3345–3353 (2006), http://www.opticsinfobase.org/oe/abstract.cfm?URI=oe-14-8-3345 10.1364/OE.14.003345 [DOI] [PubMed] [Google Scholar]
- 26.Zhang Y., Poonja S., Roorda A., “MEMS-based adaptive optics scanning laser ophthalmoscopy,” Opt. Lett. 31(9), 1268–1270 (2006). 10.1364/OL.31.001268 [DOI] [PubMed] [Google Scholar]
- 27.Hammer D. X., Ferguson R. D., Bigelow C. E., Iftimia N. V., Ustun T. E., Burns S. A., “Adaptive optics scanning laser ophthalmoscope for stabilized retinal imaging,” Opt. Express 14(8), 3354–3367 (2006), http://www.opticsinfobase.org/abstract.cfm?id=89323&CFID=113107704&CFTOKEN=11132256 10.1364/OE.14.003354 [DOI] [PMC free article] [PubMed] [Google Scholar]
- 28.Burns S. A., Tumbar R., Elsner A. E., Ferguson D., Hammer D. X., “Large-field-of-view, modular, stabilized, adaptive-optics-based scanning laser ophthalmoscope,” J. Opt. Soc. Am. A 24(5), 1313–1326 (2007). 10.1364/JOSAA.24.001313 [DOI] [PMC free article] [PubMed] [Google Scholar]
- 29.Sherman L., Ye J. Y., Albert O., Norris T. B., “Adaptive correction of depth-induced aberrations in multiphoton scanning microscopy using a deformable mirror,” J. Microsc. 206(1), 65–71 (2002). 10.1046/j.1365-2818.2002.01004.x [DOI] [PubMed] [Google Scholar]
- 30.Booth M. J., Neil M. A., Juskaitis R., Wilson T., “Adaptive aberration correction in a confocal microscope,” Proc. Natl. Acad. Sci. U.S.A. 99(9), 5788–5792 (2002). 10.1073/pnas.082544799 [DOI] [PMC free article] [PubMed] [Google Scholar]
- 31.Marsh P., Burns D., Girkin J., “Practical implementation of adaptive optics in multiphoton microscopy,” Opt. Express 11(10), 1123–1130 (2003), http://www.opticsinfobase.org/abstract.cfm?&id=72382 10.1364/OE.11.001123 [DOI] [PubMed] [Google Scholar]
- 32.Girkin J. M., Poland S., Wright A. J., “Adaptive optics for deeper imaging of biological samples,” Curr. Opin. Biotechnol. 20(1), 106–110 (2009). 10.1016/j.copbio.2009.02.009 [DOI] [PubMed] [Google Scholar]
- 33.Cha J. W., Ballesta J., So P. T. C., “Shack-Hartmann wavefront-sensor-based adaptive optics system for multiphoton microscopy,” J. Biomed. Opt. 15(4), 046022 (2010). 10.1117/1.3475954 [DOI] [PMC free article] [PubMed] [Google Scholar]
- 34.Thorlabs, “Operation Manual of AOkit,” http://www.thorlabs.com/NewGroupPage9.cfm?ObjectGroup_ID=3208
- 35.Thorlabs, “Operation Manual of Optical Wavefront Sensor,” http://www.thorlabs.com/NewGroupPage9.cfm?ObjectGroup_ID=2946


