

Abstract
This paper describes the preconcentration of the biomarker cardiac troponin I (cTnI) and a fluorescent protein (R-phycoerythrin) using cationic isotachophoresis (ITP) in a 3.9 cm long poly(methyl methacrylate) (PMMA) microfluidic chip. The microfluidic chip includes a channel with a 5× reduction in depth and a 10× reduction in width. Thus, the overall cross-sectional area decreases by 50× from inlet (anode) to outlet (cathode). The concentration is inversely proportional to the cross-sectional area so that as proteins migrate through the reductions, the concentrations increase proportionally. In addition, the proteins gain additional concentration by ITP. We observe that by performing ITP in a cross-sectional area reducing microfluidic chip we can attain concentration factors greater than 10 000. The starting concentration of cTnI was 2.3 μg mL−1 and the final concentration after ITP concentration in the microfluidic chip was 25.52 ± 1.25 mg mL−1. To the author’s knowledge this is the first attempt at concentrating the cardiac biomarker cTnI by ITP. This experimental approach could be coupled to an immunoassay based technique and has the potential to lower limits of detection, increase sensitivity, and quantify different isolated cTnI phosphorylation states.
Introduction
According to the World Health Organization, cardiovascular diseases are the world’s largest killers, claiming 17.1 million lives per year.1 In 2009, 80 million American adults were affected by cardiovascular diseases resulting in total direct and indirect cost of $475.3 billion.2 22.5 million of these people suffered from coronary heart disease and heart failure.2 In addition, it is estimated that 25% of all myocardial infarctions are silent, without chest pain or other symptoms.3,4 Currently, cardiac troponin I (cTnI) has supplanted creatine kinase as the preferred biomarker for diagnosing patients with myocardial injury;5–9 however, these tests are only run after a heart-related incident.
cTnI is specific to myocardial damage because it is produced only in the myocardium.5,10 cTnI differs from the skeletal TnI by possessing an additional 32-amino acid N-terminal extension9 making it highly specific to the myocardium and a good indicator of overall heart health. Elevation in cTnI levels is the most sensitive method available for detecting myocardial damage.11 However, for healthy individuals cTnI levels are oftentimes too low to be detected because concentrations of cTnI are lower than the limit of detection (0.009–0.06 μg L−1) of the diagnostic test.9 Typically, a concentration of cTnI > 0.08–0.1 μg L−1 in the blood is considered elevated.7,12 However, without known baseline concentrations of the current individual this may or may not be elevated depending on factors such as age, sex, race, and medical history. For instance, cTnI is found at elevated concentrations in the blood of elderly individuals (>65 years of age) without having any actual heart related illness.13
Many assays11,12,14–20 have been developed to detect cTnI of which the i-STAT by Abbott Diagnostics is the preferred point-of-care technique in detecting cTnI levels in hospital facilities.12,18,20 The i-STAT cTnI method utilizes basic ELISA principles involving monoclonal capture, antibody/antigen bound to a silicon chip surface, and polyclonal label antibody/alkaline phosphate detection.12,16 These assays, however, only quantify the total cTnI concentration and do not indicate up or down regulation of the phosphorylation state, studies of which suggest that these are better indicators of the overall heart health and functionality of the heart muscle.21–26 In addition, a 6× increase in phosphorylation of cTnI in healthy heart samples was observed in comparison to failing heart samples.24 In particular, quantification of phosphorylated vs. unphosphorylated cTnI could benefit the elderly in determining whether these patients are at-risk of myocardial damage or if the elevation is just a result of physiological changes due to age.
Current detection strategies for measuring phosphorylation levels in cTnI include non-equilibrium isoelectric focusing,27,28 mass spectrometry,29,30 and phosphate affinity SDS-PAGE;24,25 however, these techniques are generally slow, cumbersome, and low throughput. The present limitation in detecting differences in phosphorylation states using point-of-care instrumentation is that cTnI levels are already low (sub-ng mL−1 range), especially in healthy individuals whose levels fall below current detection limits. Thus, detecting the cTnI molecule and the various phosphorylation states becomes more difficult to quantify. However, antibodies have been developed that differentiate between phosphorylated and unphosphorylated states of cTnI31 and have the potential to quantify the concentration of both phosphorylated and unphosphorylated cTnI in at-risk patients suffering from chest pain. There are currently no commercial assays available that differentiate and quantify the various phosphorylation states of the cTnI molecule in symptomatic patients.
A potential solution to quantifying cTnI phosphorylation states is by coupling a preconcentration technique to a current immunoassay technique using the aforementioned antibodies. Signals from immunoaffinity assays are antigen concentration dependent.32 Therefore, a preconcentration step prior to analysis can lower the limit of detection, increase the sensitivity of these immunoassays, and isolate phosphorylated forms of cTnI.
Preconcentration is a necessary step in the analysis of complex samples where the molecule of interest is a low abundant species or where the difference in the dynamic range of the molecule of interest and other components is large.33 This is even more important with the detection of trace analytes, such as cTnI in healthy patients where the blood concentration is undetectable by current instrumentation. This is further exacerbated in detecting the cTnI phosphorylation states in healthy or unhealthy patients since these concentrations must be even lower than the total cTnI. The preconcentration step should be simple, cost-effective and fast in order to obtain cTnI results within the recommended 60 min time frame,7,34 be capable of concentrating sample components by several orders of magnitude, and be easily coupled to a method for analyte detection. Isotachophoresis (ITP) is an electrophoresis technique that has the potential to fulfill all the aforementioned requirements. ITP can be performed on a microfluidic chip platform which offers low reagent consumption, high throughput, and fast analysis.
ITP requires a discontinuous electrolyte system comprising a leading electrolyte and a terminating electrolyte, respectively,35 electrodes, and a power supply. The chosen electrolyte system is designed to assemble sample components into nearly pure zones in order of their electrophoretic mobilities between the leading and terminating electrolytes. In addition, ITP has the power to concentrate sample components in minutes by several orders of magnitude.36–38 Further, ITP can be coupled to a number of analytical techniques such as capillary zone electrophoresis,37–39 isoelectric focusing,40 gel electrophoresis,41 mass spectrometry,42 or an on-chip sandwich immunoassay.43 One can envision coupling ITP to an immunoassay-based affinity chromatography technique; however, further research needs to be performed to develop this method. Our lab is currently attempting to couple ITP to a monolith-based immunoaffinity assay in microchips to differentiate and quantify several cTnI phosphorylation states.
This work describes the preconcentration of clinically high concentrations of cTnI using cationic ITP to demonstrate the potential of this approach to preconcentrate cardiac biomarkers. Fluorescently tagged cTnI and another fluorescent protein (R-phycoerythrin) with initial concentrations of less than 4 μg mL−1 were concentrated into the mg mL−1 range in a poly(methyl methacrylate) (PMMA) microchip. This work describes a microfluidic channel that includes a 5× reduction in depth and a 10× reduction in width along the length of the channel. Thus, the overall cross-sectional area from inlet to outlet decreases by a factor of 50.
A mass balance on the sample indicates that, as the cross-sectional area of the channel is decreased, the sample concentration will increase proportionally while ITP is in peak mode. This is shown in eqn (1) below,
| (1) |
where ci is the concentration of sample component, Mi is the total mass or molar load of species i, wi is the peak width of species i, and A is the cross-sectional area of the channel. The cascaded microchannel includes a 50× reduction in A which will result in a 50× increase in ci according to eqn (1). The peak width is assumed to remain constant until the plateau concentration (eqn (8)) is reached.
Dolnik and co-workers44 first described how trace analytes were concentrated by ITP in microfluidic capillaries that included reductions in the cross-sectional area. This work builds on the work of Dolnik and co-workers and utilizes microchip fabrication to generate a microfluidic channel that includes two reductions in the cross-sectional area to concentrate protein samples by over a factor of 10 000. This work demonstrates the potential of using ITP as a preconcentration technique that could eventually be coupled to an immunoassay technique to increase the sensitivity and decrease limits of detection. In addition, ITP must be coupled to an additional technique to differentiate cTnI phosphorylation states. The simplest approach may be to couple ITP to an immunoassay that explicitly recognizes and quantifies both phosphorylated and unphosphorylated forms of the cTnI using antibodies specific to the different phosphorylated forms.
Experimental
Chemicals
R-Phycoerythrin (PE, Mw = 240 000 Da) was purchased from Molecular Probes (Eugene, OR, USA). Potassium acetate, polyvinylpyrrolidone K-90 (PVP, Mw = 360 000 Da), urea, terrific broth (TB), carbenicillin, Triton X-100, sodium azide (NaN3), phenylmethylsulfonylfluoride (PMSF), benzamidine, ammonium sulfate ((NH4)2SO4), citric acid, dithiothreitol (DTT), ethylenediaminetetraacetic acid, β-mercaptoethanol sodium chloride (NaCl), potassium chloride (KCl), potassium phosphate (KH2PO4), and disodium phosphate (Na2HPO4) were purchased from Sigma-Aldrich (St Louis, MO, USA). Pacific Blue™ C5-maleimide was purchased from Molecular Probes (Carlsbad, CA, USA).
Human cardiac troponin I (hcTnI) purification
Human cardiac troponin I (HcTnI) encoding gene was subcloned into the expression vector pET3d (Novagen, Madison, WI). The resultant plasmid pET3d–HcTnI (a kind gift from Dr Murali Chandra, WSU, VCAPP) was transformed into OneShot® BL21 Star™ (DE3) chemically competent Escherichia coli cells (Invitrogen, Carlsbad, CA, USA) by heat shock method according to manufacturer’s instructions. The cells were grown on Luria Broth (LB) medium agar plates supplemented with 50 μg mL−1 of carbenicillin at 37 °C overnight. Several colonies were picked up and inoculated into a 15 mL LB–carbenicillin liquid medium and shaked at 37 °C until OD600 is up to 0.8–1. The preculture was inoculated into a 2 L TB medium with 50 μg mL−1 carbenicillin. After shaking at 37 °C for 18 h, the cells were spun down at 7000 × g for 10 min. The cell pellets were suspended in the carboxy-methyl (CM) buffer (6 M urea, 30 mM citric acid, 1 mM EDTA, and 1 mM DTT) with 0.01% Triton X-100, 0.01% NaN3, 2 mM PMSF and 2 mM benzamidine and sonicated with a Misonix Sonicator® 3000 Ultrasonic Liquid Processor (Misonix Inc., Farmingdale, NY, USA) on ice. The crude lysate was clarified by centrifugation at 40 000 × g for 30 min. The supernatant was brought to 30% and 60% saturation with (NH4)2SO4 sequentially, followed by gently stirring at 4 °C for 1 h, and spun down at 28 000 × g for 20 min. The supernatant was decanted and the pellet was resuspended in a 50 mL CM buffer. The solution was dialyzed against 1 L CM buffer overnight at 4 °C to remove the residual (NH4)2SO4. Next, the dialyzed and clarified supernatant was loaded onto an equilibrated CM Sepharose (GE) column and an ÄKTA™ FPLC™ System (GE) was used to run gradient elution of NaCl concentration increasing from 0 to 0.3 M. The potential cTnI peak fractions were collected and sodium dodecyl sulfate polyacrylamide gel electrophoresis (SDS-PAGE) was performed to evaluate the purity of the cTnI fractions.
Labeling of cTnI
Phosphate buffer saline (PBS) was prepared using NaCl, KCl, Na2HPO4, and KH2PO4 to pH 7.4, and 1.5 mL of purified cTnI was dialyzed three times in 1 L solutions of PBS 7.4 with 4 M urea for at least 8 hours at 4 °C in a 10 000 MWCO Slide-A-Lyzer Dialysis Cassette (Piercenet, Rockford, IL, USA). After dialysis, the cTnI was labeled with Pacific Blue™ C5-maleimide according to the manufacturer’s instructions. Pacific Blue™ C5-maleimide is a UV fluorescent, thiol-reactive probe that readily reacts with the two cysteine groups on the cTnI molecule. Briefly, a 10× molar excess of dye was mixed with the cTnI and allowed to react at 4 °C overnight. An excess of β-mercaptoethanol was added to quench the reaction. The labeled cTnI was again dialyzed as mentioned previously to remove the excess dye. A Beckman Coulter DU 730 UV/Vis spectrophotometer (Beckman Coulter, Inc., Brea, CA, USA) was used to determine the final protein concentration and the degree of labeling. The final protein concentration of cTnI was 0.46 mg mL−1 and the degree of labeling was ~2. The cTnI isoelectric point was checked by running isoelectric focusing PAGE (IEF-PAGE). The labeling did not significantly affect the isoelectric point of the labeled cTnI compared to the native cTnI (data not shown).
Electrolyte solutions
The leading electrolyte (LE) solution was prepared by adjusting the pH of 20 mM potassium acetate solution to 4.5 with 10% (v/v) acetic acid. The terminating electrolyte (TE) solution consisted of 10 mM acetic acid at pH 3.8. PVP at 1% (w/v) was added to both leading and terminating electrolyte solutions in order to suppress the electroosmotic flow.45 PE and labeled cTnI stock solutions were diluted in LE solution to concentrations of 4.0 μg mL−1 and 2.3 μg mL−1, respectively. All electrolyte solutions were made up using nanopure water from a Barnstead Thermolyne Nanopure Infinity UV/UF system (Dubuque, IA, USA). Electrolyte solutions were degassed with a CPS-8B vacuum pump (US Vacuum Pumps LLC, Canton, TX, USA) to remove dissolved gases which could be unfavorable in ITP experiments.46
Microfluidic chip fabrication
The procedure used to fabricate a 2-D reducing poly(methyl methacrylate) (PMMA) microfluidic chip was reported in our previous work.47 Briefly, a PMMA microchannel was formed using a hot embossing technique and a surface-modified assisted bonding method. First, a positive pattern of the desired channel structure was formed on a glass substrate using negative photolithography. The channel includes three different depth sections: 100 μm, 20 μm, and 100 to 20 μm transition region. Next, a thin layer of PDMS48 was used to cover half of a glass substrate (75 mm × 50 mm, Fisher scientific, PA). Next, SU8 2025 (Microchem Crop., MA) was spun onto the open portion of the glass substrate at 1000 rpm for 30 s to obtain an 80 μm thick layer. Then, the thin PDMS layer was removed from the glass substrate. A small amount of SU8 migrated ~1 mm towards the previously covered PDMS half of the glass substrate. This extended SU8 region was used to create an ~1 mm long 100 to 20 μm depth transition section on the microfluidic chip. Then, the glass substrate was baked at 70 °C for 5 min and, baked again, at 95 °C, for 1 h. Next, SU8 3010 (Microchem Crop., MA) was spin-coated on the entire glass substrate at 2000 rpm. This yielded a 20 μm SU8 layer. Thus, three different depth sections were obtained on the glass substrate. Next, the SU8 photoresist was baked at 70 °C for 5 min and baked again at 95 °C for 1 h. Then, the glass substrate was exposed to 365 nm UV light with a patterned mask for 120 s. Finally, the photoresist was baked at 70 °C for 3 min on a hotplate, 100 °C for 10 min in an oven, and at 70 °C for 5 min on a hotplate. The baked photoresist was developed according to standard photolithography technique.47 This photolithography produced the SU8 pattern of the desired channel structure on a glass substrate. Then, a UV transparent PMMA piece (ACRYLITE® OP-4, Evonik Cyro LLC, NJ, USA) was trimmed to size (60 cm × 45 cm × 0.3 cm) and cleaned with isopropanol and deionized water. The SU8 pattern was hot embossed into the trimmed PMMA substrate using a hot press (Fred S. Carver Inc., Summit, NJ) at 200 psi and 120 °C.
Another piece of PMMA was trimmed to size, cleaned, and inlet and outlet reservoirs were drilled at appropriate locations. This was followed by surface modification of both PMMA substrates using oxygen plasma and tetraethyl orthosilicate (TEOS ≥ 99.0%).49 The two substrates were brought into contact and pressed together with a hot press for 20 min at 75 °C and 300 psi to form the final microchip. Finally, the bonded chip was baked at 60 °C for 2 h to increase the bond strength. A bonded microchip fabricated using this technique is shown in Fig. 1.
Fig. 1.
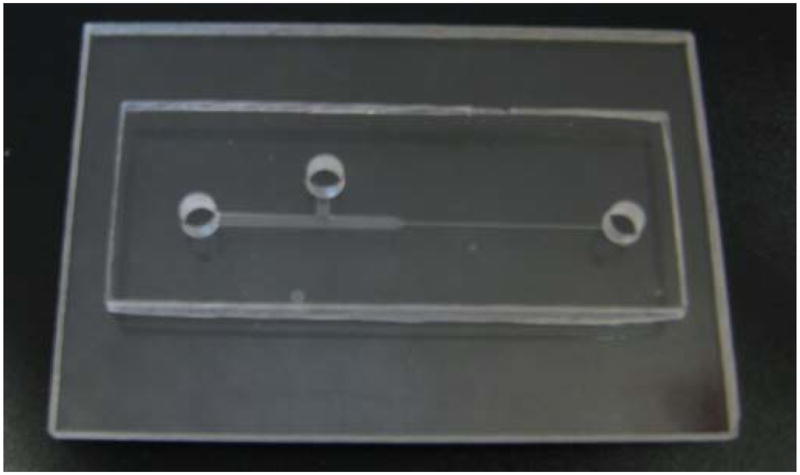
A 2-D step reducing microfluidic chip.
Cascade microchip
A schematic of the microfluidic chip is shown in Fig. 2. The entire microfluidic chip is initially filled with leading electrolyte from the cathode reservoir to the anode reservoir using a 3 mL disposable syringe. Next, diluted PE and labeled cTnI in the leading electrolyte were introduced into the sample reservoir and filled through the tee channel towards the anode reservoir so that all LE occupying the region between the sample reservoir and anode reservoir was washed out of the anode reservoir. At this point, sample solution occupied the entire region of the micro-chip between the sample reservoir and the anode reservoir. The total mass load (Mi) of both PE and cTnI injected into the microfluidic chip could then be calculated by multiplying the initial concentration by the volume of the sample loading zone (1.1 μL). Electrical tape was placed over the sample reservoir to avoid sample removal due to Laplace pressure differences between the sample and anode reservoir. Next, the anode reservoir was rinsed several times with terminating electrolyte and then filled with terminating electrolyte. Chips were rinsed with nanopure water between runs, blown out with house air, and reloaded as previously described.
Fig. 2.

Schematic of PMMA microfluidic chip geometry showing two reductions in the cross-sectional area. The total channel length is 3.3 cm. The reservoirs are 3 mm in diameter. The channel dimensions vary from 1 mm wide and 100 μm deep, to 1 mm wide and 20 μm deep, to 100 μm wide and 20 μm deep. The depth change begins 1.3 cm from the anode reservoir and the width change begins 1.6 cm from the anode reservoir. Both cross-sectional area changes occur over a distance of ~1 mm. The microchip includes a tee channel between the sample reservoir and the anode reservoir in order to control the initial mass load of the two proteins. Thus, the sample loading zone length is 11 mm, and the sample loading volume is 1.1 μL.
Experimental setup—fluorescent microscope and power supply
The filled microfluidic chip was placed underneath the 5× objective lens of a Leica DM 2000 fluorescence microscope equipped with a DFC310 digital color camera (Leica Microsystems Inc., Bannockburn, IL, USA). The camera was controlled with the provided Leica Application Suite (LAS) V3.6 software to collect images of the fluorescent proteins as the proteins migrated through the microfluidic chip via ITP. The exposure time was set to 67.7 ms and the gain was set to 4.1×. The fluorescent proteins were excited with a Leica Microsystems EL 6000 light source using an A type filter cube. Platinum electrodes were submerged in the anode reservoir and cathode reservoir while the sample reservoir was left to float.
Initially, the anode reservoir voltage was set to ground and the cathode reservoir was set to 400 V with an XHR 600-1 power supply (Xantrex technology Inc, Vancouver, Canada). After the proteins migrate past the T-junction and before the depth reduction (see Fig. 2), the voltage on the cathode was reduced to 100 V. Voltage reduction was performed to slow down the migrating proteins so that more images could be collected across the entire microfluidic chip. The protein migration speed is proportional to the current density so that, as ITP progressed through the microfluidic chip, the proteins migrated at a velocity inversely proportional to the cross-sectional area. Thus, this was partially offset by voltage reduction. Representative images at the end of each experiment were collected and modified using the crop and brightness/contrast function in Adobe Photoshop 5.5 (Adobe Systems Inc., San Jose, CA) to remove background signal. Electropherograms of the images were obtained for further analysis using the software ImageJ (http://rsb.info.nih.gov/ij).
Results and discussion
Potassium ion was chosen as the leading ion because it has a higher effective electrophoretic mobility than the protein samples. Hydronium ion was the terminating ion even though it has a higher electrophoretic mobility than the protein samples because its net electrophoretic mobility was sufficiently reduced by its association with the acetic acid. The total protein loaded onto the microfluidic chip was controlled by the addition of a tee channel between the sample reservoir and the anode reservoir. Therefore, the initial mass load (Mi) was calculated from the following equation:
| (2) |
where ci0 is the initial concentration of protein i (4.0 μg mL−1 and 2.3 μg mL−1 for PE and cTnI, respectively), L is the length of the sample loading zone (11 mm), and A is the cross-sectional area of the channel (0.1 mm2). Thus, the total mass loaded for PE and cTnI was 4.40 and 2.53 ng, respectively. The loaded chip was mounted on the microscope platform, platinum electrodes were immersed in the anode and cathode reservoirs, power was applied, and protein migration was observed through the microfluidic chip. Both proteins were positively charged at the running pH and migrated from the anode to the cathode.
The protein migration was initially slow because the current density in the large cross-sectional area of the microfluidic channel was low. The proteins were not visualized until just before the T-junction where sufficient mass had accumulated in the zone to detect both PE and labeled cTnI (Fig. 3(a)). At the running pH, cTnI ran ahead of PE because it had a higher effective electrophoretic mobility. The proteins continued to collect mass through the sample loading zone and the intensity of the fluorescence increased as they migrated through the 1st reducing union (Fig. 3(b)). Prior to the 1st reducing union, the voltage on the cathode was reduced from 400 V to 100 V. Voltage reduction was performed to slow down the migrating proteins to collect more images to be obtained over the course of the ITP experiment. Therefore, voltage reduction was not required, but performed in order to record protein migration through the two reductions. Still, the entire experiment could be completed in less than 20 min.
Fig. 3.

Experimental ITP stacking of labeled cTnI and PE at different locations in the microfluidic chip. (a) The proteins begin to stack into their respective zones but are difficult to see until just before the tee junction. (b) The proteins have migrated past the 1st cross-sectional area reduction (5× depth change) and have stacked into relatively distinct zones that are easily visualized. (c) The proteins are entering the 2nd cross-sectional area reduction (10× width change) where slight distortion occurs; however, the proteins become much brighter and easier to visualize. (d) The proteins have now migrated into the final leg of the microfluidic channel and have concentrated into pure zones. In addition, the slight distortion seen in Fig. 3(c) is gone as a result of ITP’s self-sharpening effect. (e) The proteins have migrated further into the final leg of the microfluidic channel and are approaching the cathode reservoir. It is assumed at this point that all sample mass loaded into the microfluidic chip has concentrated into each respective protein band. These images have not been altered in any way to subtract background noise and are the raw images collected directly from the digital color camera.
No distortion is observed through the 1st reduction (5× depth change), however; as the proteins migrate through the 2nd reduction (10× width change) a slight distortion of the protein bands occurred where the protein concentration is higher at the walls than at the center of the channel (Fig. 3(c)). Distortion through reducing unions is normal;44,50 however, this distortion is quickly eliminated by ITP’s self-sharpening effect (Fig. 3(d)). No discernible differences in protein band attributes are observed as the proteins migrate through the last leg of the microfluidic channel (Fig. 3(d) and (e)). A final image was collected prior to protein bands migration into the cathode reservoir clearly demonstrating ITP stacking of labeled cTnI and PE into nearly pure and distinct zones (Fig. 3(e)). The images illustrated in Fig. 3 are raw images collected directly from the digital color camera and have not been modified in any way.
Over 60 images were acquired for each successive trial and compiled into a movie using Windows Movie Maker 2.6. A representative video of the protein migration through the microfluidic channel can be viewed as a movie file found in the ESI†. Final images from three successive trials were modified for further analysis using Adobe Photoshop 5.5 as previously described to remove background noise (Fig. 4(b)). However, the raw data pictures are also shown in Fig. 4(a). After background noise removal, the images were transferred to ImageJ software where electropherograms were produced. Electropherograms were obtained by plotting distance (mm) relative to the field of view of the camera versus average intensity over the entire width of the channel for each protein. An example electropherogram is shown in Fig. 5 including the raw data and modified data. The inset in Fig. 5 is a blow-up of the protein peaks and reveals that the protein peaks are more Gaussian than plateau shaped. This indicates that the proteins have not reached their maximum allowable concentration, i.e., plateau concentration (eqn (8)), derived from the Kohlrausch regulating function.51 The electropherograms for all three trials were necessary to perform a statistical analysis of band attributes such as peak width. Moment analysis obtained from the data of the electropherogram was used to obtain peak width information for each trial and is described below.
Fig. 4.

(a) Representative images of three subsequent trials of ITP performed in the microfluidic chip. The images are taken in the small-cross-sectional area portion of the channel just before the cathode reservoir. The images are the raw figures collected from the camera. Labeled cTnI (blue) migrates in front of the PE (red) because at the running pH the effective electrophoretic mobility of cTnI is higher. (b) The images have been modified using the crop and brightness/contrast function in Adobe Photoshop 5.5 to subtract out background noise.
Fig. 5.

This is a representative electropherogram obtained from the middle figures in Fig. 4(a) and (b). Electropherograms were obtained by plotting distance (mm) relative to the field of view of the camera versus average intensity over the entire width of the channel. Using moment analysis, the peak width of each protein can be determined from the data. Subsequent concentrations and concentration factors for each protein are then calculated based on the electropherograms taken from the modified pictures. The final results are tabulated in Table 1. The inset shows an expanded view of the two proteins indicating a Gaussian peak shape.
The nth moment converted from temporal to spatial moments52,53 is given by
| (3) |
where I(x) is the intensity value, x is the spatial position, a and b are the limits of integration based on the field of view of the camera, and mn,i was calculated using the trapezoidal rule54 at distinct position values such that
| (4) |
The variance (σ2) is defined by the following relationship
| (5) |
where xm is the mean location of mass. The variance can then be derived using nth moments to the following equation
| (6) |
where the complete derivation from eqn (5) to eqn (6) is shown in Appendix 1. The resulting peak width (Wi) for each peak is then given by
| (7) |
where σ is the standard deviation. The peak widths at the end of the ITP experiments for labeled cTnI and PE are 49.66 ± 2.37 μm and 31.68 ± 3.23 μm, respectively. The final concentration can then be calculated from eqn (1) where Wi is the peak width of each protein calculated from eqn (7), A is the cross-sectional area of the last leg in the microfluidic chip (0.002 mm2), and Mi is the initial mass load calculated from eqn (2) (2.53 ng for cTnI and 4.40 ng for PE). The authors assume that all of the protein loaded onto the microfluidic chip collects into the bands presented in Fig. 4. There is no evidence of protein being lost during the experiment, such as by protein adsorption on the channel walls. Using eqn (7), the final protein concentrations were 25.52 ± 1.25 mg mL−1 and 69.91 ± 6.76 mg mL−1 for cTnI and PE, respectively. The concentration factors were determined by dividing the final concentration by the initial concentration. For cTnI the concentration factor was 11 094 ± 545 and for PE the concentration factor was 17 477 ± 1689. The peak widths, final concentrations, and concentration factors of each protein for each trial are summarized in Table 1.
Table 1.
Summary of experimental peak widths determined from moment analysis, final concentrations from eqn (1), and concentration factors for PE and cTnI
| PE
|
cTnI
|
|||||
|---|---|---|---|---|---|---|
| Trial # | Peak width/μm | Concentration/mg mL−1 | Concentration factor | Peak width/μm | Concentration/mg mL−1 | Concentration factor |
| 1 | 30.21 | 72.84 | 18 210 | 50.83 | 24.89 | 10 822 |
| 2 | 35.58 | 62.18 | 15 545 | 51.21 | 24.70 | 10 739 |
| 3 | 29.45 | 74.70 | 18 675 | 46.93 | 26.96 | 11 722 |
| Average | 31.68 | 69.91 | 17 477 | 49.66 | 25.52 | 11 094 |
| St. Dev. | 3.23 | 6.76 | 1689 | 2.37 | 1.25 | 545 |
The plateau concentration (ci) or maximum concentration of proteins that can be obtained using ITP can be derived from the Kohlrausch regulating function51 so that
| (8) |
where cLE is the concentration of the leading electrolyte (20 mM), μS, μLE, and μC are the electrophoretic mobilities of the sample, leading electrolyte, and counterion, respectively, and zLE (+1) and zS are the charge on the leading electrolyte and sample, respectively. A direct comparison of plateau concentrations for cTnI and PE could not be performed because mobility and charge data could not readily be obtained for cTnI and PE without further experimentation. In addition, mobility and charge data were not found in the literature. As a result, the authors used the protein bovine serum albumin (BSA), whose mobility and charge data were available from the literature,35 as a surrogate protein to compare the plateau concentration of BSA to the experimentally determined concentrations of cTnI and PE.
The mobility and charge of BSA at pH 4.0 are ~2.00 × 10⁻⁸ m2 V−1 s−55 and +13, respectively.35 The mobilities of the leading electrolyte (potassium) and counterion (acetate) are 7.62 × 10⁻⁸ m2 V−1 s−1 and −4.24 × 10⁻⁸ m2 V−1 s−1.56 By plugging these values into eqn (8) and modifying eqn (8) from a molar concentration to a mass concentration by using the molecular weight of BSA (66 kDa), a plateau concentration of 50.65 mg mL−1 was calculated for BSA. As a result, the BSA based plateau concentration is much higher than the experimentally determined concentration for cTnI but slightly lower than the PE concentration. One possible explanation for the PE concentration being slightly higher is that the molecular weight of PE (240 kDa) is significantly higher than the Mw of BSA so when eqn (8) is calculated based on the mass concentration, one would expect the plateau concentration to be directly proportional to the ratio of molecular weights, assuming all other values in eqn (8) are nearly identical for the two proteins. Therefore, it is safe to assume that the plateau concentration calculated from eqn (8) would be higher for PE which is the case described here.
The authors are aware that the initial concentration of cTnI is significantly higher (10 000×) than clinical levels; however, this paper addresses a potential solution in current technologies that are unable to detect cTnI levels in some patients. In addition, the authors on-going research includes performing cationic ITP at pH 8 of cTnI in serum samples to determine the limit of detection and the potential use of ITP to concentrate and fractionate cTnI for clinical applications. We believe that by incorporating a pre-concentration step prior to an immunoassay, the limits of detection will be lowered, sensitivity will be increased, and different phosphorylation states of cTnI can then be detected and quantified. Future experimentation will need to be performed to test this hypothesis.
Conclusions
This report demonstrates a 10 000 fold increase in both cTnI and PE concentration using cationic ITP in a PMMA microfluidic chip with two reductions in the cross-sectional area. This increase results from the ITP concentrating effect and a 50× reduction in the cross-sectional area from inlet to outlet along the axial direction of the microchannel. The cTnI molecule was fluorescently tagged with Pacific Blue™ C5-maleimide to label only thiol groups. In addition, the fluorescent labeling allowed visualization of cTnI migration under UV excitation. Both cTnI and PE were loaded through a tee channel to control the protein mass load. Both proteins were positively charged at the running pH and migrated from the anode to the cathode. The proteins quickly formed distinct, adjacent zones between the leading electrolyte and the terminating electrolyte. The protein’s concentration increased as a function of distance from the anode as a result of both mass accumulation through the sample loading zone and mass conservation through the two reductions in the cross-sectional area along the microchannel. Final concentrations were determined from moment analysis calculations and exceeded 25 mg mL−1 and 65 mg mL−1 for cTnI and PE, respectively. The experiment was fast and could be performed in less than 20 min with applied voltages no greater than 400 V. This is the first attempt at using ITP as a preconcentration technique for a cardiac biomarker, in particular, cTnI. This experimental approach could potentially be coupled to an immunoassay-based technique in order to improve limits of detection, increase sensitivity, and quantify different cTnI phosphorylation states. On-going research is being performed to test this hypothesis.
Acknowledgments
The research was supported by Life Science Discovery Fund and the Washington State University National Institutes of Health Protein Biotechnology Training Program Award Number T32GM008336 from the NIGMS. The content is solely the responsibility of the authors and does not necessarily represent the official views of the National Institute of General Medical Sciences or the National Institutes of Health.
Appendix 1
We know that
The mean location (xm) and the variance (σ2) are defined as
By expanding out the variance we get
After simplification
Finally
Footnotes
Electronic supplementary information (ESI) available: Representative video of the protein migration through the microfluidic channel. See DOI: 10.1039/c0lc00490a
References
- 1.World Heatlh Organization. [accessed 6 Aug 2010.];Cardiovascular diseases. http://www.who.int/cardiovascular_diseases/en/
- 2.Lloyd-Jones D, Adams R, Carnethon M, De Simone G, Ferguson TB, Flegal K, Ford E, Furie K, Go A, Greenlund K, Haase N, Hailpern S, Ho M, Howard V, Kissela B, Kittner S, Lackland D, Lisabeth L, Marelli A, McDermott M, Meigs J, Mozaffarian D, Nichol G, O’Donnell C, Roger V, Rosamond W, Sacco R, Sorlie P, Stafford R, Steinberger J, Thom T, Wasserthiel-Smoller S, Wong N, Wylie-Rosett J, Hong Y M Writing Group; and for the American heart association statistics committee and stroke statistics. Circulation. 2009;119:e21–e181. doi: 10.1161/CIRCULATIONAHA.108.191261. [DOI] [PubMed] [Google Scholar]
- 3.Wang JY, Wang XQ, Ren L, Wang Q, Li L, Liu WM, Wan ZF, Yang LY, Sun P, Ren LL, Li ML, Wu H, Wang JF, Zhangt L. Anal Chem. 2009;81:6210–6217. doi: 10.1021/ac9007418. [DOI] [PubMed] [Google Scholar]
- 4.Kannel WB, Stokes J, Abbott RD. Circulation. 1984;70:160. [Google Scholar]
- 5.Jaffe AS, Ravkilde J, Roberts R, Naslund U, Apple FS, Galvani M, Katus H. Circulation. 2000;102:1216–1220. doi: 10.1161/01.cir.102.11.1216. [DOI] [PubMed] [Google Scholar]
- 6.Braunwald E, Antman EM, Beasley JW, Califf RM, Cheitlin MD, Hochman JS, Jones RH, Kereiakes D, Kupersmith J, Levin TN, Pepine CJ, Schaeffer JW, Smith EE, Steward DE, Theroux P, Gibbons RMJ, Alpert JS, Eagle KA, Faxon DP, Fuster V, Gardner TJ, Gregoratos G, Russell RO, Smith SC, Unstable CMP. Cathet Cardiovasc Interv. 2000;51:505–521. doi: 10.1161/01.cir.102.10.1193. [DOI] [PubMed] [Google Scholar]
- 7.Fonarrow GC. Cardiac Troponin-I Assay. http://www.med.ucla.edu/champ/Troponin%20Guidelines.PDF.
- 8.Setiadi BM, Lei H, Chang J. Chin Med J (Beijing, China, Engl Ed) 2009;122:351–358. [PubMed] [Google Scholar]
- 9.Babuin L, Jaffe AS. Can Med Assoc J. 2005;173:1191–1202. doi: 10.1503/cmaj.050141. [DOI] [PMC free article] [PubMed] [Google Scholar]
- 10.Alpert JS, Antman E, Apple F, Armstrong PW, Bassand JP, de Luna AB, Beller G, Breithardt G, Chaitman BR, Clemmensen P, Falk E, Fishbein MC, Galvani M, Garson A, Grines C, Hamm C, Jaffe A, Katus H, Kjekshus J, Klein W, Klootwijk P, Lenfant C, Levy D, Levy RI, Luepker R, Marcus F, Naslund U, Ohman M, Pahlm O, Poole-Wilson P, Popp R, Alto P, Pyorala K, Ravkilde J, Rehnquist N, Roberts W, Roberts R, Roelandt J, Ryden L, Sans S, Simoons ML, Thygesen K, Tunstall-Pedoe H, Underwood R, Uretsky BF, Van de Werf F, Voipio-Pulkki LM, Wagner G, Wallentin L, Wijns W, Wood D, Ame JESC. J Am Coll Cardiol. 2000;36:959–969. doi: 10.1016/s0735-1097(00)00804-4. [DOI] [PubMed] [Google Scholar]
- 11.Bock JL, Singer AJ, Thode HC. Am J Clin Pathol. 2008;130:132–135. doi: 10.1309/NVXH8DL5HWFDNB74. [DOI] [PubMed] [Google Scholar]
- 12.Apple FS, Murakami MM, Christenson RH, Campbell JL, Miller CJ, Hock KG, Scott MG. Clin Chim Acta. 2004;345:123–127. doi: 10.1016/j.cccn.2004.03.010. [DOI] [PubMed] [Google Scholar]
- 13.Myint PK, Al-Jawad M, Chacko SM, Chu GS, Vowler SL, May HM. Cardiology. 2008;110:62–67. doi: 10.1159/000109408. [DOI] [PubMed] [Google Scholar]
- 14.Lam Q, Black M, Youdell O, Spilsbury H, Schneider HG. Clin Chem (Washington, DC, U S) 2006;52:298–300. doi: 10.1373/clinchem.2005.057216. [DOI] [PubMed] [Google Scholar]
- 15.Jossi S, Gordon SL, Legge MA, Armstrong GP. Intern Med J. 2006;36:325–327. doi: 10.1111/j.1445-5994.2006.01073.x. [DOI] [PubMed] [Google Scholar]
- 16.Di Serio F, Lovero R, Leone M, De Sario R, Ruggieri V, Varraso L, Pansini N. Clin Chem Lab Med. 2006;44:768–773. doi: 10.1515/CCLM.2006.125. [DOI] [PubMed] [Google Scholar]
- 17.Hamm CW, Goldmann BU, Heeschen C, Kreymann G, Berger J, Meinertz T. N Engl J Med. 1997;337:1648–1653. doi: 10.1056/NEJM199712043372302. [DOI] [PubMed] [Google Scholar]
- 18.Apple FS, Ler R, Chung AY, Berger MJ, Murakami MM. Clin Chem (Washington, DC, U S) 2006;52:322–325. doi: 10.1373/clinchem.2005.060293. [DOI] [PubMed] [Google Scholar]
- 19.La’ulu SL, Roberts WL. Clin Chim Acta. 2010;411:1095–1101. doi: 10.1016/j.cca.2010.04.008. [DOI] [PubMed] [Google Scholar]
- 20.Singh J, Akbar MS, Adabag S. Clin Chim Acta. 2009;403:259–260. doi: 10.1016/j.cca.2009.01.017. [DOI] [PubMed] [Google Scholar]
- 21.Wolff MR, Buck SH, Stoker SW, Greaser ML, Mentzer RM. J Clin Invest. 1996;98:167–176. doi: 10.1172/JCI118762. [DOI] [PMC free article] [PubMed] [Google Scholar]
- 22.Lamberts RR, Hamdani N, Soekhoe TW, Boontje NM, Zaremba R, Walker LA, de Tombe PP, van der Velden J, Stienen GJM. J Physiol. 2007;582:695–709. doi: 10.1113/jphysiol.2007.134486. [DOI] [PMC free article] [PubMed] [Google Scholar]
- 23.van der Velden J, de Jong JW, Owen VJ, Burton PBJ, Stienen GJM. Cardiovasc Res. 2000;46:487–495. doi: 10.1016/s0008-6363(00)00050-x. [DOI] [PubMed] [Google Scholar]
- 24.Messer AE, Gallon CE, McKenna WJ, Dos Remedios CG, Marston SB. Proteomics: Clin Appl. 2009;3:1371–1382. doi: 10.1002/prca.200900071. [DOI] [PubMed] [Google Scholar]
- 25.Gallon CE. J Muscle Res Cell Motil. 2008;29:169–172. doi: 10.1007/s10974-009-9170-4. [DOI] [PubMed] [Google Scholar]
- 26.Zakhary DR, Moravec CS, Stewart RW, Bond M. Circulation. 1999;99:505–510. doi: 10.1161/01.cir.99.4.505. [DOI] [PubMed] [Google Scholar]
- 27.Kobayashi T, Yang XF, Walker LA, Van Breemen RB, Solaro RJ. J Mol Cell Cardiol. 2005;38:213–218. doi: 10.1016/j.yjmcc.2004.10.014. [DOI] [PubMed] [Google Scholar]
- 28.Scruggs SB, Walker LA, Lyu T, Geenen DL, Solaro RJ, Buttrick PM, Goldspink PH. J Mol Cell Cardiol. 2006;40:465–473. doi: 10.1016/j.yjmcc.2005.12.009. [DOI] [PubMed] [Google Scholar]
- 29.Zabrouskov V, Ge Y, Schwartz J, Walker JW. Mol Cell Proteomics. 2008;7:1838–1849. doi: 10.1074/mcp.M700524-MCP200. [DOI] [PubMed] [Google Scholar]
- 30.Bunk DM, Dalluge JJ, Welch MJ. Anal Biochem. 2000;284:191–200. doi: 10.1006/abio.2000.4710. [DOI] [PubMed] [Google Scholar]
- 31.Al-Hillawi E, Chilton D, Trayer IP, Cummins P. Eur J Biochem. 1998;256:535–540. doi: 10.1046/j.1432-1327.1998.2560535.x. [DOI] [PubMed] [Google Scholar]
- 32.Tok JBH, Chuang FYS, Kao MC, Rose KA, Pannu SS, Sha MY, Chakarova G, Penn SG, Dougherty GM. Angew Chem, Int Ed. 2006;45:6900–6904. doi: 10.1002/anie.200601104. [DOI] [PubMed] [Google Scholar]
- 33.Hatch AV, Herr AE, Throckmorton DJ, Brennan JS, Singh AK. Anal Chem. 2006;78:4976–4984. doi: 10.1021/ac0600454. [DOI] [PubMed] [Google Scholar]
- 34.Apple FS, Jesse RL, Newby LK, Wu AHB, Christenson RH, Cannon CP, Francis G, Morrow DA, Ravkilde J, Storrow AB, Tang W, Jaffe AS, Mair J, Ordonez-Llanos J, Pagani F, Panteghini M, Tate J, Members NWG, Members NC, Markers ICS. Clin Chem (Washington, DC, U S) 2007;53:547–551. doi: 10.1373/clinchem.2006.084715. [DOI] [PubMed] [Google Scholar]
- 35.Mosher RA, Saville DA, Thormann W. The Dynamics of Electrophoresis. VCH; Weinheim, New York: 1992. [Google Scholar]
- 36.Gebauer P, Mala Z, Boček P. Electrophoresis. 2009;30:29–35. doi: 10.1002/elps.200800425. [DOI] [PubMed] [Google Scholar]
- 37.Jung B, Bharadwaj R, Santiago JG. Anal Chem. 2006;78:2319–2327. doi: 10.1021/ac051659w. [DOI] [PubMed] [Google Scholar]
- 38.Wainright A, Williams SJ, Ciambrone G, Xue QF, Wei J, Harris D. J Chromatogr, A. 2002;979:69–80. doi: 10.1016/s0021-9673(02)01246-3. [DOI] [PubMed] [Google Scholar]
- 39.Jung BG, Zhu YG, Santiago JG. Anal Chem. 2007;79:345–349. doi: 10.1021/ac060949p. [DOI] [PubMed] [Google Scholar]
- 40.Mohan D, Lee CS. Electrophoresis. 2002;23:3160–3167. doi: 10.1002/1522-2683(200209)23:18<3160::AID-ELPS3160>3.0.CO;2-L. [DOI] [PubMed] [Google Scholar]
- 41.Mohamadi MR, Kaji N, Tokeshi M, Baba Y. Anal Chem. 2007;79:3667–3672. doi: 10.1021/ac0623890. [DOI] [PubMed] [Google Scholar]
- 42.Tomás R, Koval M, Foret F. J Chromatogr, A. 2010;1217:4144–4149. doi: 10.1016/j.chroma.2010.02.021. [DOI] [PubMed] [Google Scholar]
- 43.Kawabata T, Wada HG, Watanabe M, Satomura S. Electrophoresis. 2008;29:1399–1406. doi: 10.1002/elps.200700898. [DOI] [PubMed] [Google Scholar]
- 44.Dolnik V, Deml M, Boček P. J Chromatogr. 1985;320:89–97. doi: 10.1016/s0021-9673(01)90483-2. [DOI] [PubMed] [Google Scholar]
- 45.Kaneta T, Ueda T, Hata K, Imasaka T. J Chromatogr, A. 2006;1106:52–55. doi: 10.1016/j.chroma.2005.08.062. [DOI] [PubMed] [Google Scholar]
- 46.Khurana TK, Santiago JG. Lab Chip. 2009;9:1377–1384. doi: 10.1039/b815460k. [DOI] [PubMed] [Google Scholar]
- 47.Bottenus D, Jubery TZ, Dutta P, Ivory CF. Electrophoresis. 2010 doi: 10.1002/elps.201000510. submitted. [DOI] [PMC free article] [PubMed] [Google Scholar]
- 48.Cui HC, Horiuchi K, Dutta P, Ivory CF. Anal Chem. 2005;77:1303–1309. doi: 10.1021/ac048915+. [DOI] [PubMed] [Google Scholar]
- 49.Tennico YH, Koesdjojo MT, Kondo S, Mandrell DT, Remcho VT. Sens Actuators, B. 2010;143:799–804. [Google Scholar]
- 50.Slais K. Electrophoresis. 1995;16:2060–2068. [PubMed] [Google Scholar]
- 51.Everaerts FM, Mikkers FEP, Verheggen TPEM. Analytical isotachophoresis: proceedings of the 2nd International Symposium on Isotachophoresis; Eindhoven. September 9–11, 1980; US and Canada: North Holland, Amsterdam, New York: Elsevier Scientific Pub. Co; Elsevier; 1981. [Google Scholar]
- 52.Abramowitz M, Stegun IA. Handbook of Mathematical Functions, with Formulas, Graphs, and Mathematical tables. Dover Publications; New York: 1972. [Google Scholar]
- 53.Levenspiel O. Chemical Reaction Engineering. Wiley; New York: 1972. [Google Scholar]
- 54.Kreyszig E. Advanced Engineering Mathematics. John Wiley; Hoboken, NJ: 2006. [Google Scholar]
- 55.Douglas NG, Humffray AA, Pratt HRC, Stevens GW. Chem Eng Sci. 1995;50:743–754. [Google Scholar]
- 56.Boček P, Deml M, Gebauer P, Dolnik V. Analytical Isotachophoresis. VCH; Weinheim, Federal Republic of Germany, New York, NY, USA: 1988. [Google Scholar]