

Abstract
Our previous work in perfused rat livers has demonstrated that 4-hydroxynonenal (HNE) is catabolized predominantly via beta oxidation. Therefore, we hypothesized that perturbations of beta oxidation, such as diet-altered fatty acid oxidation activity, could lead to changes in HNE levels. To test our hypothesis, we (i) developed a simple and sensitive GC/MS method combined with mass isotopomer analysis to measure HNE and HNE analogs, 4-oxononenal (ONE) and 1,4-dihydroxynonene (DHN), and (ii) investigated the effects of four diets (standard, low fat, ketogenic, and high fat mix diets) on HNE, ONE, and DHN concentrations in rat livers. Our results showed that livers from rats fed ketogenic diet or high fat mix diet had high ω-6 polyunsaturated fatty acid concentrations and markers of oxidative stress. However, high concentrations of HNE (1.6 ± 0.5 nmol/g) and ONE (0.9 ± 0.2 nmol/g) were only found in livers from rats fed the high fat mix diet. Livers from rats fed the ketogenic diet had low HNE (0.8 ± 0.1 nmol/g) and ONE (0.4 ± 0.07 nmol/g), similar to rats fed the standard diet. A possible explanation is that the predominant pathway of HNE catabolism (i.e. beta oxidation) is activated in the liver by the ketogenic diet. This is consistent with a 10 fold decrease in malonyl-CoA in livers from rats fed a ketogenic diet compared to a standard diet. The accelerated catabolism of HNE lowers HNE and HNE analog concentrations in livers from rats fed the ketogenic diet. On the other hand, rats fed the high fat mix diet had high rates of lipid synthesis and low rates of fatty acid oxidation, resulting in the slowing down of the catabolic disposal of HNE and HNE analogs. Thus, decreased HNE catabolism by a high fat mix diet induces high concentrations of HNE and HNE analogs. The results of the present work suggested a potential causal relationship to metabolic syndrome induced by western diets (i.e. high fat mix), as well as the effects of the ketogenic diet on the catabolism of lipid peroxidation products in liver.
Keywords: 4-hydroxynonenal; 4-oxononenal; 1,4-dihydroxynonene; diet; rat liver; metabolism; lipid peroxidation; mass isotopomer analysis
Introduction
HNE is an abundant lipid peroxidation product of ω-6 polyunsaturated fatty acids (linoleic acid and arachidonic acid) [1–4]. The detrimental effects of HNE originate from its high reactivity because of its strong electrophilic functional groups (i.e. the 2,3-double bond close to the hydroxyl group on C4 and the carbonyl group on C1). HNE conjugates with the cysteine, histidine, and lysine moieties of proteins or with N2-amino group of deoxyguanosine by Michael addition and Schiff base reaction [5,6]. Such conjugations with glutathione (GSH), proteins, lipoproteins, and DNA [7,8] impair enzyme activity, affect gene expression, and inhibit cardiomyocyte contraction [9]. When compared to HNE, ONE, an HNE analog, is a more reactive lipid peroxidation product because of its 4-oxo group [10,11]. The rate constant of an ONE reactions with amino acids or peptides is around 5~150 fold higher than HNE [12,13]. As a result, ONE exhibits a higher level of toxicity than HNE [14]. DHN is the reduction product of HNE by aldehyde reductase that was found to have a higher activity in the kidneys than any other organs [15]. The reduction of HNE to the much less reactive DHN is seen as one of HNE’s disposal and detoxification pathways [16].
Two main factors affect HNE and HNE analog concentrations. The first factor is the upstream of HNE metabolism (the productions of HNE and HNE analogs). As mentioned above, HNE and ONE are peroxidation products of ω-6 polyunsaturated fatty acids (ω-6 PUFAs). High lipid peroxidation is the index of high levels of oxidative stress. The second factor is the downstream of HNE metabolism, which mainly involved in following pathways: (1) conjugation with GSH, cysteine, and carnosine [17], (2) reduction to DHN by cytosolic aldehyde reductase [18,19], and (3) oxidation to 4-hydroxynonanoic acid that can be catabolized to form acetyl-CoA and propionyl-CoA entering the citric acid cycle [20,21]. Perturbation of the balance of production and disposal could lead to accumulation of HNE and HNE analogs, and causing further damage by protein, lipid, and DNA modification.
Our previous work in perfused rat livers has shown that HNE is completely catabolized to acetyl-CoA and propionyl-CoA via two parallel pathways in the perfused rat livers [21,22]. A new class of acyl-CoA, 4-phosphononanoyl-CoA, is an intermediate metabolite through which 4-hydroxynonanoyl-CoA is isomerized to 3-hydroxynonanoyl-CoA [21,22]. 3-Hydroxynonanoyl-CoA is a regular beta oxidation intermediate that is further metabolized via beta oxidation processes. We have observed that HNE catabolism in the rat liver was its major disposal pathway. Therefore, we hypothesized that any alteration of the beta oxidation pathway could affect HNE catabolism and thus alter HNE levels. Different diets alter intrinsic energy metabolic pathways [23,24]. Lower beta oxidation and higher lipid synthesis rates were found in livers of rats fed a high fat plus carbohydrate diet [23]. On the contrary, a ketogenic (KG) diet (very high fat with very low carbohydrate) showed a unique pattern of gene expression with increased expression of genes in fatty acid oxidation pathways and a reduction in lipid synthesis pathways [25]. Therefore, both diets could interfere with HNE and HNE analog metabolism in different ways.
The beneficial and detrimental effects of various diets have been extensively studied. For example, KG diets have been used for the treatment of children with epilepsy [26] as well as Rett Syndrome [27]. The induction of metabolic syndrome by high fat diets has been extensively reported [28,29]. Low fat/high carbohydrate diets are traditionally recommended to help reduce the risk of diabetes and cardiovascular disease, and it has also been recently suggested to increase risk for insulin resistance syndrome among susceptible individuals [30].
The aforementioned points raised the idea that dietary alteration might affect the metabolism of HNE and HNE analogs. Thus, we investigated the effects of various diets on HNE and HNE analog levels in rats fed different diets. Ideal methods for HNE assay should include HNE and HNE analogs interconversions under different dietary conditions. HNE and DHN quantitation in biological samples have, in fact, been previously reported [31–34]. However, to the best of our knowledge, there is no concentration data on ONE in biological samples probably due to its high reactivity. ONE is an unstable compound that needs protection during identification and analysis from side reactions, such as by oxime derivatization [10]. Our rationale to measure ONE originated from the work of Des Rosiers et al. [35] who quantified malondialdehyde and HNE by reduction to alcohols, i.e. DHN, with sodium borodeuteride. DHN is stable and can be easily measured by GC/MS using simple trimethylsilyl (TMS) derivatization. A similar strategy is used for ONE since the dicarbonyl groups of ONE can be reduced by sodium borodeuteride. Although both HNE and ONE are reduced to DHN, the number of incorporated deuterium atoms is different. Therefore, DHN, HNE, and ONE treated with sodium borodeuteride form M0, M1, and M2 DHN that can be differentiated and quantified by GC/MS. M0, M1 and M2 represent molecules that have 0, 1, and 2 heavy atoms (described in the methods section).
The aims of the present work were: (i) to develop a simple and sensitive GC-MS method with the combination of mass isotopomer analysis to simultaneously quantify DHN, HNE, and ONE in rat livers, (ii) to demonstrate the effects of different diets on the concentrations of HNE and HNE analogs in rat livers, and (iii) to identify the possible mechanism of altered HNE and HNE analog concentrations in livers from rats fed with different diets. Markers of oxidative stress (reduced and oxidized glutathione concentration and antioxidant ascorbate concentration) and HNE disposal (glutathione conjugation, reduction to DHN and HNE catabolism) were investigated.
Materials and methods
Materials
Materials—General chemicals, GSH, oxidized glutathione, malonyl-CoA, 3-hydroxybutyryl-CoA (BHB-CoA), acetoacetyl-CoA (AcAc-CoA), sodium borodeuteride, sodium borohydride, ascorbic acid, linoleic acid, arachidonic acid, and heptadecanoic acid (C17 fatty acid) were purchased from Sigma-Aldrich. ONE, HNE, and 4-hydroxydecanenal were synthesized in our lab [22]. [3,3,4,5,5,5,-2H6]-4-hydroxypentanoic acid was synthesized according to our previous work [21].
Principle of DHN, ONE, and HNE analysis by mass isotopomer analysis
The main rationale in quantifying DHN, HNE, and ONE simultaneously by GC/MS and mass isotopomer analysis is to reduce HNE and ONE to one and two deuterium labeled DHN by sodium borodeuteride with no effect on unlabeled DHN. The DHN and its mass isotopomers were measured by a simple and sensitive GC/MS method using TMS derivatization. The details are outlined in Fig 1. Measurement of the M0, M1, and M2 DHN by GC/MS was used for the quantitation of DHN, HNE, and ONE, respectively.
Figure 1.
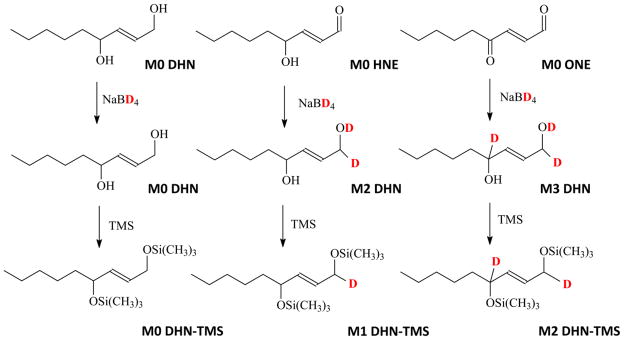
The scheme of DHN, HNE and ONE reduced by sodium borodeuteride and the chemical structures of TMS derivatives.
However, elements have their own natural stable mass isotope distributions (MID), such as 13C (1.10%), 2H (0.015%), 15N(0.37%), 18O (0.20%) and 29Si (5.06%). A molecule composed of the above elements has its own natural MID. The measured M1 or M2 DHN contains two sources, one is from DHN natural MID and the other from HNE and ONE. To measure HNE and ONE, the measured M1 and M2 DHN were corrected from the natural MID background of DHN. The net increase of M1 and M2 DHN after correction reflects HNE and ONE concentration. The mass isotopomer correction was carried out by matrix correction that has been discussed in detail in our previous work [36].
To verify the accuracy of DHN mass isotopomer analysis and matrix correction in the measurement of DHN, HNE, and ONE, we proportionally mixed DHN, HNE, and ONE with increasing concentration ratios of HNE and ONE versus DHN from 0 to 2. The mixture was reduced by NaBD4 to form M0, M1, and M2 DHN. GC/MS was used to determine M0, M1, and M2 DHN. Unlabeled DHN was used to formulate the natural MID matrix. The difference between measured enrichments by mass isotopomer analysis and actual concentrations of DHN, HNE, and ONE was used to evaluate the method accuracy.
The preparation of DHN
To make DHN, 1 ml of 1 mM HNE aqueous was reacted with 100 μl of 1 M NaBH4 (pH =10). The reaction was kept at room temperature for 10 minutes. DHN was extracted by 3 ml of ethyl acetate extraction that was repeated 3 times. The possible HNE or DHN remnants in the aqueous solution were checked by GC/MS for the completion of reaction and full extraction. The combined ethyl acetate extracts containing DHN were dried by nitrogen gas. The dried residues were dissolved in Milli-Q water to make a stock solution of DHN that was verified by GC-MS.
The preparation of HNE glutathione (GSH-HNE) conjugate
Michael addition adducts were synthesized by the modified method of Alary and colleagues [37]. Briefly, GSH-HNE was synthesized by the incubation of HNE (0.5 mM) with L-GSH (0.8 mM) in a final volume of 1 ml phosphate buffer (50 mM, pH=7.4). The reaction was incubated at room temperature over night under N2 gas protection. The HNE in the reaction mixture was checked by GC/MS for the completion of conjugation.
Animal experiments
To investigate lipid peroxidation products in livers from rats fed with different diets that could alter fatty acid metabolism, four groups of male Wistar rats (8 weeks old, n=6 per group) were fed either high fat, low fat, or standard chow diets for four weeks. Four diets were implemented: carbohydrate free (KG), high fat “Surwit” (58% fat, 25.5% carbohydrate, HFmix), low fat (carbohydrate, LF), and standard rodent chow (SD). Diets were purchased from LabDiet, USA, RMH3000 (SD), or Research Diets, New Brunswick, NJ, D12359 (LF), Surwit (HFmix), D12369B (KG). The calorie composition and detailed ingredients of each diet are shown in Table 1. Rats were allowed to acclimate in the animal facility at Case Western Reserve University for one week before starting the feeding study. All rats were kept on a 12 h light/dark cycle with ad libitum access to different diet food and water. All experiments were performed in accordance with the Institutional Animal Care and Use Committee (IACUC) at Case Western Reserve University. On the experimental day, rats were lightly anesthetized with isoflurane (2.5% in air). An abdominal incision was made and the rat livers were quickly dissected, freeze clamped in liquid nitrogen, and keep frozen (−80°C) until biochemical processing.
Table 1.
The calorie components and main ingredients in four different groups of diets
| Component | SD | LF | KG | HFmix | |
|---|---|---|---|---|---|
| Calorie components | Fat (%kcal) | 27.5 | 11.5 | 89.5 | 58.1 |
| Protein (%kcal) | 20.0 | 10.4 | 10.4 | 16.4 | |
| Carbohydrate (%kcal) | 52.5 | 78.1 | 0.1 | 25.5 | |
|
| |||||
| Main ingredients | Linoleic acid (g/kg) | 17.3 | 30.1 | 59.5 | 13.5 |
| Linolenic acid (g/kg) | 1.6 | 0.7 | 0.7 | 2.0 | |
| Arachidonic acid (g/kg) | 0 | 0 | 0 | 0 | |
| Omega-3 fatty acid (g/kg) | 3.4 | 0.7 | 0.7 | 2.0 | |
| Total saturated fatty acid (g/kg) | 17.5 | 6.4 | 90.2 | 334.0 | |
| Total monounsaturated fatty acid (g/kg) | 16.0 | 12.5 | 236.5 | 8.7 | |
| Sucrose (g/kg) | 10.0 | 13.9 | 4.9 | 189.5 | |
| Vitamin A (mg/kg) | 8.7 | 1.2 | 1.2 | 1.2 | |
| Vitamin E (mg/kg) | 50.2 | 33.5 | 33.5 | 33.5 | |
| Vitamin D3 (μg/kg) | 60.0 | 25.0 | 25.0 | 25.0 | |
| Vitamin C (mg/kg) | 0 | 0 | 0 | 0 | |
| Riboflavin(mg/kg) | 14.0 | 6.0 | 6.0 | 6.0 | |
| Pantothenic acid (mg/kg) | 13.0 | 16.0 | 16.0 | 16.0 | |
| Biotin (mg/kg) | 0.4 | 0.2 | 0.2 | 0.2 | |
| Pyridoxine (mg/kg) | 7.6 | 7.0 | 7.0 | 7.0 | |
| Folic acid (mg/kg) | 1.2 | 2.0 | 2.0 | 2.0 | |
| Thiamin hydrochloride (mg/kg) | 10.0 | 6.0 | 6.0 | 6.0 | |
| Calcium (g/kg) | 10 | 5.2 | 5.2 | 5.9 | |
| Phosphorus (g/kg) | 7.5 | 4.0 | 4.0 | 4.6 | |
| Potassium (g/kg) | 9.1 | 3.6 | 3.6 | 4.1 | |
| Magnesium (g/kg) | 2.4 | 0.5 | 0.5 | 0.6 | |
| Sodium (g/kg) | 2.6 | 1.0 | 1.0 | 1.1 | |
| Chlorine (g/kg) | 4.4 | 1.6 | 1.6 | 1.8 | |
| Iron (g/kg) | 0.4 | 0.04 | 0.04 | 0.05 | |
| Zinc (g/kg) | 0.1 | 0.03 | 0.03 | 0.03 | |
| Copper (g/kg) | 0.01 | 0.006 | 0.006 | 0.007 | |
The analysis of DHN and its mass isotopomers by GC-MS
Sample preparation for DHN and its mass isotopomers via GC/MS assay was completed as follows. A 6 ml mixture of acetonitrile, methanol, and Milli-Q water (volume ratio of 2:2:2), containing 0.5 mmol of NaBD4 and 2 nmol 4-hydroxydecanenal as internal standard was added to 200 mg of liver tissue or 300 mg diet sample, and then homogenized for 2 min. The sample homogenate was kept at room temperature for 15 minutes to ensure a complete reduction by NaBD4. Sample homogenate was then centrifuged at 3000 × g for 30 min. The supernatant was transferred to a glass tube. Hexane (6 ml) was then added to the glass tube and vortexed for 5 minutes for extraction. This extraction process was repeated by three times. Extracts were combined together and purged under nitrogen to completely dry. The dried residues were reacted with 100 μl of TMS and incubated at 70°C for 1 hour. After derivatization, 2 μl of each sample was injected into the GC/MS for detection.
Analyses were carried out on an Agilent 5973 mass spectrometer, linked to a 6890 gas chromatograph system equipped with an autosampler. An Agilent VF-5MS capillary column (60 m×0.32 mm×0.25μm) was used for chromatographic separation. The carrier gas was helium (2 ml/min) with a pulse pressure of 20.1 p.s.i. The injection was in splitless mode. The temperature for both inlet and transfer line was set at 310°C. The ion source and quadrupole temperature were set at 230 and 150 °C. The GC temperature program was as follows: start at 90°C, hold for 25 min, and increase by 5°C/min to 190°C followed by 50°C/min to 300°C, finally it remains at 300°C for 5 min. DHN signals were monitored at its nominal m/z (M0) and its mass isotopomers with SIM mode. The m/z monitored for DHN: 231, HNE: 232, ONE: 233, and internal standard: 232. All the masses were measured in Electron Impact (EI) ionization mode. The retention times of DHN and internal standard are 43.8 and 45.9 minutes, respectively.
The analysis of GSH-HNE conjugate by LC-MS/MS
The other main disposal pathway of HNE is via GSH conjugation. GSH-HNE concentrations in different diet rat livers were quantified. LC-MS/MS analysis of GSH-HNE conjugate was modified from the work of Volkel et al. [38]. Powdered frozen rat livers (~250 mg) were spiked with 0.1 nmol of 4-hydroxydecanenal glutathione conjugate as internal standard, and was extracted for 2 min with 2 ml of 100 mM iodoacetic acid in 10 mM ammonium bicarbonate buffer (pH 9.8), 4 ml of acetonitrile, and 2 ml of chloroform using a Polytron homogenizer. The homogenate was centrifuged for 30 min at 4 °C at 800 ×g and the aqueous part was dried with nitrogen gas and stored at − 80 °C until LC-MS/MS analysis. The dried residue was dissolved in 100 μl of Milli-Q water and analyzed by LC-MS/MS.
After dissolving the dried sample in 100 μl of Milli-Q water, 20 μl were injected on a Thermo Scientific Hypersil GOLD C18 column (150 × 2.1 mm), protected by a guard column (Hypersil GOLD C18 5 μm, 10 × 2.1 mm), in an Agilent 1100 liquid chromatography. The chromatogram was developed at 0.2 ml/min (i) from 0 to 25 min with a 1–45% gradient of buffer B (95% acetonitrile, 5% water and 0.25% formic acid) in buffer A (95% water, 5% acetonitrile and 0.25% formic acid), (ii) from 25 to 26 min with a 45–90% gradient of buffer B in buffer A, (iii) from 26 to 31 min with 90% buffer B in buffer A, (iv) from 31 to 32 min with a 90-1% gradient of buffer B in buffer A, and (v) for 10 min of equilibration with 99% buffer A before the next injection.
The liquid chromatography was coupled to a 4000 QTrap mass spectrometer (Applied Biosystems, Foster City, CA) operated under positive ionization mode with the following source settings: turbo-ion-spray source at 600 °C under N2 nebulization at 65 p.s.i., N2 heater gas at 55 p.s.i., curtain gas at 30 p.s.i., collision-activated dissociation gas pressure held at high, turbo ion-spray voltage at 5,500 V, declustering potential at 90 V, entrance potential at 10 V, collision energy at 50 V, and collision cell exit potential at 10 V. The Analyst software (version 1.4.2, Applied Biosystems) was used for data collection and processing.
Data acquisition was performed in Multiple Reaction Monitoring (MRM) mode monitoring the transition of [M+H]+ m/z 464 in Q1 to [MH–156]+ m/z 308 (protonated GSH) in Q3 as quantifier. The internal standard precursor ion and daughter ion are at m/z 475 and 308, respectively.
The analysis of GSH and oxidized glutathione by LC-MS/MS
Oxidative stress is reflected by the decreased ratio of GSH versus oxidized glutathione [39]. The GSH and oxidized glutathione in the livers of rats fed the different diets were analyzed by LC-MS/MS to check the oxidative stress status. A 100 mg of liver tissue was used for this experiment. The detailed sample preparation and LC-MS/MS method can be seen in our previous reports [40]. The first step of the method was GSH derivatization by idoacetic acid. The oxidized glutathione in this method actually represents the sum of oxidized glutathione and all other glutathione conjugates (GSSR) because the second step of the method used dithiothreitol and hydrolyzed all oxidized glutathione and conjugated glutathione into GSH that was derivatized by idoacetonitrile. The measurement of idoacetic acid and idoacetonitrile derivatives of GSH was used to quantify GSH and GSSR. We assessed the oxidative stress in the liver using the ratio of GSH versus of GSSR.
The analysis of ascorbic acid by GC-MS
The ascorbic acid TMS derivative was assayed by GC-MS as described by Tiitinen et al. [41]. The internal standard is [3,3,4,5,5,5,-2H6]-4-hydroxypentanoic acid. The m/z used for quantifying ascorbic acid and internal standard TMS derivatives are 332 and 253, respectively.
The analysis of acyl-CoAs by LC-MS/MS
Based on our previous work [21], we hypothesized that the activity of the beta oxidation would influence the catabolic disposal of HNE. To investigate the fatty acid beta oxidation activity in the rat livers, some acyl-CoAs have been quantified in these samples (such as malonyl-CoA, BHB-CoA, AcAc-CoA and 4-hydroxynonenoyl-CoA). Malonyl-CoA is a regulator of fatty acid metabolism. Low levels of malonyl-CoA indicates more fatty acid oxidation and high malonyl-CoA levels decreases long chain fatty acid oxidation by inhibiting CPT1 [42]. High BHB-CoA, AcAc-CoA and a high ratio of BHB-CoA/AcAc-CoA indicate more active fatty acid oxidation [43]. 4-Hydroxynonenoyl-CoA is the HNE catabolism intermediate in the rat liver [21].
The analysis of total linoleic acid and arachidonic acid by GC-MS
ω-6 PUFAs are the precursors of HNE, ONE, and DHN under oxidative stress. To check whether the concentrations of ω-6 PUFAs are related to diet-altered HNE and ONE productions, the total linoleic acid and arachidonic acid concentrations in rat livers were measured by GC/MS according to the methods of Castro-Perez et al. [44]. Briefly, 100 mg of powdered liver tissue was mixed with 1 ml of 1M KOH in 75% ethanol and incubated for 3 hours at 85°C. A 200 μl sample of C17:0 fatty acid (1 mg/ml) was added as internal standard. A 500 μl sample was taken and acidified by 50 μl of 6 N HCl. Fatty acids were extracted by adding 300 μl of chloroform. After drying the chloroform extract, the residues were reacted with 70 μl TMS at 70 °C for 20 minutes and run through GC/MS (Agilent 5973 mass spectrometer, linked to a 6890 gas chromatograph system equipped with an autosampler). A Phenomenex GC capillary column (30 m×0.25 mm×0.25μm) was used for chromatographic separation. The carrier gas was helium (1.5 ml/min) with a pulse pressure of 14.7 p.s.i. The injection was in split mode with split ratio of 50:1. The temperature for inlet and transfer line was set at 240 and 280 °C, respectively. The ion source and quadrupole temperature were at 230 and 150 °C, respectively. The GC temperature program was as follows: start at 80°C, and increase by 10°C/min to 250°C followed by 50°C/min to 300°C, finally it remains at 300°C for 5 min. We monitored linoleic acid and arachidonic acid at its nominal m/z (M0) with SIM mode. The m/z monitored for linoleic acid, arachidonic acid, and heptadecanoic acid are 337, 361, and 327, respectively. Heptadecanoic acid, linoleic acid, and arachidonic acid in the present method eluted out at 15.5, 16.2 and 17.4 minutes, respectively. All the masses were measured in EI mode.
Statistical analysis
The results are presented as mean values ± standard deviation from five or six animals in each group. The statistical significance among the different diet groups was determined by ANOVA analysis that was verified by a Bartlett test. Tukey’s Post Hoc test was used to determine significant differences between each group after ANOVA analysis.
Results
Fragmentation of DHN-TMS derivative in GC-EI-MS
DHN-TMS derivative in EI has four major fragments and their m/z values are at 73, 147, 199 and 231 (Fig 2A). The fragments of 73 and 147 are from the TMS moiety. The fragments of 199 and 231 are DHN related. The detailed fragmentation pathways of the DHN-TMS derivative and deuterium locations after NaBD4 reduction are shown in Fig 2. The fragment of 199 is the loss of one TMS and carbon 1 of the DHN TMS derivative. The m/z of DHN, HNE, and ONE at this fragment are 199, 199 and 200 (Fig 2A, B and C). Therefore, DHN and HNE cannot be differentiated by the fragment at m/z 199. The second fragmentation cleaves between carbon 4 and 5 generating a second fragment at m/z 231. The m/z of DHN, HNE, and ONE treated with NaBD4 at the second fragment is 231, 232 and 233, respectively (Fig 2A, B and C). The fragment at m/z = 231 was chosen for the analysis of three compounds in the present work.
Figure 2.

EI mass spectra of M0, M1, and M2 DHN-TMS derivatives. A: M0 DHN-TMS derivative; B: M1 DHN-TMS derivative; C: M2 DHN-TMS derivative.
One concern with this strategy was whether 4-hydroxynonenoic acid, a common metabolite of HNE oxidation, could be reduced by NaBD4. We excluded this possibility by incubating NaBD4 with 4-hydroxynonenoic acid. The incubation of NaBD4 and 4-hydroxynonenoic acid didn’t form any DHN mass isotopomers.
Quantitation of DHN, HNE, and ONE by analyzing DHN mass isotopomers
The strategy for DHN, HNE, and ONE quantitation was to reduce HNE and ONE by sodium borodeuteride to the different mass isotopomers of DHN so that they could be differentiated by mass spectrometry. To verify the accuracy of this mass isotopomer analysis method, we made a calibration series that contained mixtures of DHN, HNE, and ONE standards with linearly increasing amounts of HNE and ONE (the concentration ratios of HNE to DHN and ONE to DHN increased from 0 to 2). The measured enrichment ratios of M1/M0 and M2/M0 from the calibration series by the mass isotopomer analysis were verified by the actual concentration ratios of HNE/DHN and ONE/DHN, respectively. Fig 3 shows the correlation of measured enrichment of M1/M0 and M2/M0 (Y axis) versus the actual concentration ratios of HNE/DHN and ONE/DHN (X axis).
Figure 3.
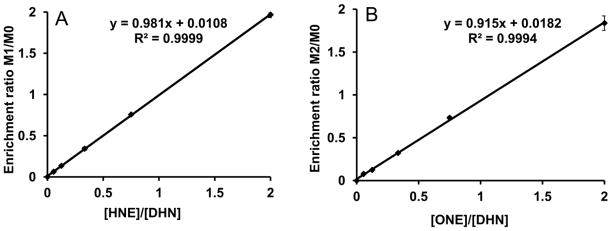
Calibration curve of mass isotopomer enrichment versus the concentration ratio of DHN, HNE and ONE. A: the enrichment ratio of M1 and M0 DHN versus the concentration ratio of HNE and DHN; B: the enrichment ratio of M2 and M0 DHN versus the concentration ratio of ONE and DHN.
The slopes of the M1/M0 DHN enrichment ratio versus HNE/DHN concentration ratio and M2/M0 DHN enrichment ratio versus ONE/DHN concentration ratio were 0.98 and 0.92, respectively. This confirms that mass isotopomer analysis of DHN corresponds very well to the actual concentrations of the three compounds and can be used to simultaneously quantify DHN, HNE, and ONE with high accuracy.
GC/MS method performance for DHN measurement
The sodium borodeuteride reduction was investigated under different pH conditions (no buffer, or pH 4.3, 7, 9 and 10). It was found that the pH had very little effect on the DHN production although sodium borodeuteride is not stable under acidic conditions. Therefore, the stock solution of sodium borodeuteride was prepared in 1 mM NaOH and only Milli-Q water was used for the reaction. The reaction of sodium borodeuteride was so fast (completed within 1 minute) that we could not obtain the exact time of the completion of reaction. The DHN extraction by hexane and other regular organic solvents (diethyl ether, ethyl acetate and petroleum ether) were also investigated. Ethyl acetate had the highest extraction yield of DHN. However, more interference was found if ethyl acetate was used in the liver sample extraction. Hexane had a relatively low extraction yield but with no co-eluent interferences. Moreover, the extraction yield of DHN using 3 times of hexane (hexane/sample volume ratio, 3:1) repeat extraction reached ~60%, and the addition of internal standard corrected the incomplete extraction.
The GC/MS method for the DHN assay was characterized regarding linearity, reproducibility, sensitivity, and accuracy. The present GC/MS method for DHN was linear from 0.01 to 1.6 nmol. The calibration curve slopes of intra- and inter-days were 14.7 and 13.1 with relative standard error at 8.7 and 4.0%, respectively. The limit of detection (LOD) and the limit of quantitation (LOQ) were 0.01 and 0.03 μM, respectively. The recoveries at low (0.05 nmol), middle (0.25 nmol) and high (0.8 nmol) spiked amounts of DHN were 99.2, 103.3 and 93.4% with standard deviations at 3.6, 3.4 and 7.4%, respectively. The results of method performance demonstrated that the present GC/MS method for DHN was sensitive, reproducible, and accurate.
DHN, HNE, and ONE concentration in livers from rats fed different diets
We fed the rats with four different diets: SD, LF, HFmix, and KG. The main calorie components and detailed ingredients of four diets were shown in Table 1. DHN, HNE, and ONE in rat livers were assayed by the present developed method (See Fig 4). DHN concentrations in rat livers from each diet were about 20 fold lower than HNE (Fig 4C). The livers from the HFmix diet group had the highest HNE and ONE concentrations compared to all other diet groups (Fig 4A and B). HNE and ONE in the livers from KG diet (HNE: 0.77 ± 0.14, ONE: 0.40 ± 0.07 nmol/g) were not significantly different compared to LF diet (1.0 ± 0.14 and 0.57 ± 0.09 nmol/g) and SD diets (HNE: 0.8 ± 0.1 nmol/g and ONE: 0.4 ± 0.07 nmol/g) (Fig 4A and B). The concentration ratios of ONE versus HNE in livers from all diets were similar (~0.54). HNE, ONE and DHN concentrations from the pellets of each diet were also checked. Both HNE and ONE were found in trace amounts in all diets, but with no difference between the diets, DHN was not found in any of the diets.
Figure 4.

The concentrations of DHN, HNE and ONE in the livers from rats fed the different diets. Panel A: HNE concentration in rat livers; Panel B: ONE concentration in rat livers. Panel C: DHN concentration in rat livers. The statistical significance among the different diet groups was determined by ANOVA analysis verified by a Bartlett test. And Tukey’s Post Hoc test was used to determine significant differences between each group after ANOVA analysis. (**p<0.01 and *P<0.05, n=6). The data was calculated based on the wet weight of liver tissues.
GSH-HNE conjugate in livers from rats fed different diets
GSH conjugation with HNE is one of the major disposal pathways of HNE. The glutathione conjugate with HNE is used as a stable biomarker of oxidative stress and lipid peroxidation. Therefore, the concentrations of glutathione conjugate with HNE in the rat livers fed different diets were also analyzed by LC-MS/MS. The results are shown in Fig 5. GSH-HNE was significantly higher in rat livers from the HFmix diet group compared to rat livers from all other diet groups. The GSH-HNE concentration in livers from rats fed an HFmix diet was 6 times higher than in livers from the rats fed a SD diet. GSH-HNE concentrations in rat livers with other diets are not significantly different to each other, as indicated by the ANOVA analysis and Tukey’s Post Hoc test (Fig 5).
Figure 5.

The concentration of GSH-HNE in the livers from rats fed the different diets. The statistical significance among the different diet groups was determined by ANOVA analysis verified by a Bartlett test. And Tukey’s Post Hoc test was used to determine significant differences between each group after ANOVA analysis. (**p<0.01 and *P<0.05, n=6). The data was calculated based on the wet weight of liver tissues.
GSH and GSSR in livers from rats fed different diets
The GSH is usually used to assess the oxidative stress, especially with the ratio of the GSH to the oxidized glutathione. The GSH and GSSR concentration in the livers are shown in Fig 6. Compared to SD diet rat livers, all other diet rat livers have significant lower GSH (Fig 6A). GSSR is significantly higher in the livers from the HFmix diet group when compared to livers from the SD and LF diet groups (Fig 6B). GSSR in livers from rats fed the KG diet was not significantly different compared to the livers from the SD diet, but it is higher than the liver from the LF diet (Fig 6B). The ratios of GSH/GSSR were significantly lower in livers from the KG and HFmix diet groups when compared to the livers from SD and LF diet groups (Fig 6C). In addition, livers from the LF diet group had both lower GSH and GSSR. However, the ratio of GSH/GSSR was not significantly changed in livers from rats fed the LF diet (Fig 6C).
Figure 6.

The concentration of glutathione (GSH) (A), the concentration of the oxidized glutathione and conjugated glutathione (GSSR) (B), the ratio of GSH/GSSR (C) and the concentration of ascorbic acid (D) in the livers from rats fed the different diets. The statistical significance among the different diet groups was determined by ANOVA analysis verified by a Bartlett test. And Tukey’s Post Hoc test was used to determine significant differences between each group after ANOVA analysis. (**p<0.01 and *P<0.05, n=6). The data was calculated based on the wet weight of liver tissues.
Ascorbic acid in livers from rats fed different diets
Effects of different diets on hepatic oxidative stress were also assessed through the analysis of ascorbic acid since ascorbic acid is an antioxidant. Ascorbic acid in the rat livers with different diets was shown in Fig 6D. Ascorbic acid was found to be lower in rat livers from both the KG diet (1.0 ± 0.05 μmol/g) and HFmix diet (1.0 ± 0.15 μmol/g) groups compared to rat livers from SD diet group (1.4 ± 0.16 μmol/g). Livers from rats fed the LF diet had no significant change in ascorbic acid concentration (1.2 ± 0.19μmol/g) when compared to livers from rats fed the SD diets.
Acyl-CoA profile in livers from rats fed different diets
To further demonstrate the effects of fatty acid oxidation on HNE catabolism, the main related acyl-CoAs were assayed. Malonyl-CoA was found lowest in the rat livers on a KG diet (Fig 7A). Malonyl-CoA is a regulator of fatty acid oxidation and synthesis [45,46]. Low levels of malonyl-CoA indicate more fatty acid oxidation rather than synthesis. High malonyl-CoA concentrations decrease fatty acid oxidation by inhibiting CPT1[42]. BHB-CoA is an intermediate of fatty acid oxidation. In livers from rats fed the KG diet, the concentrations of BHB-CoA was the highest (Fig 7C). High rates of beta oxidation with the KG diet were also indicated by the ratio of BHB-CoA/AcAc-CoA (Fig 7D). 4-Hydroxynonenoyl-CoA is an HNE oxidation intermediate and is undetectable in control rat livers [21]. In the present work, 4-hydroxynonenoyl-CoA was only detectable in rat livers from the KG diet group (Fig 7B).
Figure 7.

The concentrations of Acyl-CoAs in the livers from rats fed the different diets. A: Malonyl-CoA, B: 4-hydroxynonenoyl-CoA, C: BHB-CoA, and D: BHB-CoA/AcAc-CoA. The statistical significance among the different diet groups was determined by ANOVA analysis verified by a Bartlett test. And Tukey’s Post Hoc test was used to determine significant differences between each group after ANOVA analysis. (**p<0.01 and *P<0.05, n=6). The data was calculated based on the wet weight of liver tissues.
ω-6 PUFAs concentrations in livers from rats fed different diets
In rat livers, ω-6 PUFAs are the substrates of lipid peroxidation products. Thus, the total linoleic acid and arachidonic acid concentrations in the rat livers from different diet groups were assayed. The results are shown in Fig. 8. Linoleic acid was found significantly higher in livers from the LF, KG and HFmix diet groups when compared to livers from the SD diet group. However, only livers from the KG and HFmix diet groups had significantly higher arachidonic acid (Fig 8).
Figure 8.

The concentrations of linoleic acid (A) and arachidonic acid (B) found in the livers from rats fed the different diets by GC-MS. The statistical significance among the different diet groups was determined by ANOVA analysis verified by a Bartlett test. And Tukey’s Post Hoc test was used to determine significant differences between each group after ANOVA analysis. (**p<0.01 and *P<0.05, n=6). The data was calculated based on the wet weight of liver tissues.
Discussion
We developed a new GC-MS method combined with mass isotopomer analysis for assaying DHN, HNE, and ONE. With the developed method, DHN, HNE, and ONE concentrations in the livers from rats fed four different diets were measured. The production and disposal of HNE and its analogs in the rat livers were investigated to understand the potential mechanism of the diet-altered HNE and ONE levels.
Various analytical methods have been reported for HNE in different biological samples. The most commonly used HNE assay is pentafluorobenzyl oxime (PFB) derivatives by negative GC-MS [47,48]. DHN can not be derivatized by PFB. We developed the present method for DHN, HNE, and ONE by the reduction of HNE and ONE to M1 and M2 DHN. The advantages of this method are: (i) DHN TMS derivatives can be sensitively assayed by GC/MS with LOQ at 0.03 μM, (ii) it is easy to develop the experimental method since only one compound (DHN) is monitored, and (iii) systematic error is reduced because only one calibration curve is used for all three compounds of analysis.
The potential interference to HNE and HNE analogs assay in the present method is from the possible presence of 1-hydroxynon-2-en-4-one. 1-Hydroxynon-2-en-4-one is formed when ONE is reduced by NADPH dependent reductase [49]. 1-Hydroxynon-2-en-4-one reduced by sodium borodeuteride forms M1 DHN that is the same reduction product of HNE. However, it can still be differentiated by two fragments because M1 DHN from 1-hydroxynon-2-en-4-one produces two fragments at 232 and 200, and fragments of M1 DHN from HNE are at 232 and 199. One can quantify DHN, HNE, ONE and 1-hydroxynon-2-en-4-one based on both fragments if necessary. 1-Hydroxynon-2-en-4-one is also a product of aldehyde reductase and, therefore, the trace amount of DHN found in the rat liver led us to inferring that there is a negligible amount of 1-hydroxynon-2-en-4-one in rat liver tissues.
The influence of various diets on the HNE and HNE analog concentrations in rat livers was investigated. HNE and ONE were found in the highest levels in livers from rats fed an HFmix diet (Fig 4). The high HNE and ONE levels in the HFmix diet together with increased HNE conjugate with GSH (Fig 5) confirms that GSH conjugation is one of main disposal pathways of HNE in liver. The possibility of HNE and ONE coming from dietary sources (i.e. the diets themselves rather than as a result of dietary alterations) were excluded since little amounts of HNE and ONE were detected in all diets.
To investigate the possible mechanism of diet-altered HNE and HNE analog concentrations in rat livers, the production and disposal of HNE were measured. The production of HNE and ONE is from the peroxidation of ω-6 PUFAs (linoleic acid and arachidonic acid) and is induced by oxidative stress. Therefore, HNE has been used as biomarker of oxidative stress [50]. The disposal of HNE in the liver is mainly via the following pathways: (i) reduction to the less reactive DHN, (ii) conjugation with GSH, cysteine, and carnosine, and (iii) completely catabolism to acetyl-CoA and propionyl-CoA, which enters citric acid cycle [21,22].
The production of HNE and ONE is related to the ω-6 PUFA concentrations and to oxidative stress. In the present work, oxidative stress was assessed by measuring the concentrations of reduced and oxidized glutathione, particularly their ratios. The ratio of GSH/GSSR (Fig 6C) was found to be within the range of previously reported GSH/GSSG ratios in control livers (from 6 to 100) [51-54] even though our GSSR contains both GSSG and GSH conjugates. GSSG is still probably the main component of GSSR assayed in our method [40]. Therefore, GSH/GSSG ratio was reasonably used to estimate the oxidative stress in livers. The lower ratio of GSH versus GSSR (oxidized glutathione and other glutathione conjugate) in KG and HFmix diet groups (Fig 6C) indicates higher oxidative stress in the livers from rats fed both diets. Tissue levels of ascorbic acid are known to decrease under oxidative stress conditions [55]. In the present study, the decreased ascorbic acid content in KG and HFmix diet groups (Fig 6D) also confirmed the high oxidative stress in livers from rats fed both diets. Higher oxidative stress induces more lipid peroxidation, which could explain the higher HNE and ONE levels found in livers of rats fed the HFmix diet. However, HNE and ONE levels in livers from rats fed the KG diet (Fig 4) conflicted with the data of GSH/GSSR and ascorbic acid.
The concentration of ω-6 PUFA in the diets or rat livers is another factor that could influence HNE and ONE production. The highest level of ω-6 PUFAs were found in the KG diets followed by LF diet and then the HFmix diet. There was little amount of ω-6 PUFA in the SD diets (17.3 g/kg, Table 1). As expected that total ω-6 PUFAs concentrations in livers of rats fed the KG, LF and HFmix diets were higher than in livers from rats fed the SD diet. High oxidative stress and ω-6 PUFAs in the livers from rats fed the KG diet didn’t induce high level of HNE and ONE. One explanation is that the KG diet-induced high production of HNE and ONE is likely decreased by high rates of disposal. The HNE glutathione conjugate data (Fig 5) did not show significant differences in the livers from rats fed the KG diet. The highest level of HNE glutathione conjugate was found in the livers from rats fed the HFmix diet probably because of the increased HNE and ONE. Thus, HNE glutathione conjugation does not appear to be the factor accelerating its disposal in KG diet rat liver. HNE conjugation with other compounds, such as cysteine [56], lipoic acid [57] or carnosine [58] was not assayed since conjugation with GSH is most efficient via both spontaneous chemical and enzymatic reactions [59]. HNE or ONE reduction to DHN is reported to be another detoxification pathway [20]. However, DHN was in much lower amount compared to HNE or ONE (Fig 4C). Moreover, DHN was significantly lower in the livers from rats fed the KG diet compared to other diets.
The different disposal rates of HNE are most likely attributed to different catabolic rates of HNE in livers from rats fed different diets, although changes in production cannot be completely ruled out. HNE catabolism in rat liver is via two parallel pathways that share the major beta oxidation pathways of most fatty acids [21,22]. Genes involved in fatty acid oxidation are up-regulated so that rats can adapt to the KG diet (fatty acids are the main energy source) [25]. The activated fatty acid oxidation and low fat synthesis in livers from rats fed a KG diet can be demonstrated by (i) the extremely low malonyl-CoA concentration (10 fold lower compared to SD diet), (ii) high BHB-CoA levels, and (iii) high ratio of BHB-CoA/AcAc-CoA (Fig 7). The enhanced fatty acid oxidation can also be demonstrated by the dramatic increase in ketone bodies concentrations (3-hydroxybutyrate was 10 fold higher in livers from rats fed the KG diet compared to SD diet, data is not shown). We concluded that HNE catabolism in livers from rats fed the KG diet is accelerated by the activated fatty acid oxidation pathways. Therefore, free HNE levels are not elevated in livers from rats fed the KG diet even with high levels of oxidative stress and ω-6 PUFA. The unusual amount of 4-hydroxynonenoyl-CoA (the catabolic intermediate of HNE) was only found in the KG diet rat liver (Fig 7B), which also demonstrates the high catabolic rate of HNE in these livers.
The fatty acid metabolism in the HFmix diet group was the opposite of the KG diet group. Fatty acid synthesis was relatively higher in the livers from rats fed with the HFmix diet. The higher fatty acid synthesis rate in the HFmix diet was supported by a lipid synthesis rate that was 4 fold higher than the SD diet (unpublished data). The higher fatty acid synthesis indicates lower fatty acid oxidation and lower HNE catabolism. Lower fatty acid beta oxidation in rat livers with similar HFmix diets was observed by Vial et al. [23]. Xie et al. also found that fatty acid utilization through beta oxidation was inhibited and lipogenesis was enhanced in livers from rats fed the HFmix diet [24]. The decreased HNE catabolism, higher oxidative stress, and higher ω-6 PUFAs concentrations resulted in the HNE and HNE analogs accumulation in livers from the HFmix diet group. ONE is also a direct lipid peroxidation product of ω-6 PUFAs. ONE concentration in the livers from rats fed different diets is comparable to HNE. This probably is due to the similar metabolism of ONE and HNE in rat liver. ONE may be reduced to HNE first by dehydrogenase and then be metabolized via HNE catabolic pathway.
Although a high concentration of linoleic acid in the LF diet and livers from rats fed the LF diet, HNE and ONE in the livers from rats fed the LF diet are not significantly different compared to the SD diet (Fig 4).This probably is because the oxidative stress level is low in the livers from rats fed the LF diet, which is contrast to the previous report [60]. GSH-HNE and GSH/GSSR ratios in the livers from rats fed the LF diet are similar to the SD diet although GSH concentration was low in the livers from rats fed the LF diet. The reason why GSH was low in the livers from the LF diet is not clear. However, it may be related to GSH synthesis, since both GSH and GSSR are in low concentration in livers of rats fed the LF diet. In addition, the concentration of ascorbic acid, another oxidative marker, in livers from the LF diet was not significantly different compared to the SD diet.
Free HNE and ONE (i.e. the un-conjugated forms) are highly reactive small molecules. Reactive oxygen species only exert their effects in the cells where they are generated. In contrast, free HNE or ONE diffuse to neighboring cells where they react with thiol groups of proteins, GSH, amino groups of proteins (histidine or lysine) [61,62], lipids, and DNA [6,63,64]. Modified proteins or enzymes by HNE or ONE often impair their activities. Lipid peroxidation products have been implicated in many disease states including Alzheimer’s disease [65,66], atherosclerosis [67], obesity [68], diabetes [69] and cancer [70]. The four diets used in the present study resulted in different HNE/ONE levels in rat livers. The latter suggests a potential mechanism for diet-induced diseases, such as obesity or diabetes.
The proposed mechanism for the altered changes in HNE and ONE in livers from rats fed KG and HFmix diets is summarized in Fig 9. The findings of the present work have the following implications: (i) free HNE and ONE concentrations are not reliable biomarkers of oxidative stress since the disposal rate of HNE and ONE via catabolism can be accelerated (as seen with the KG diet), (ii) accumulation of HNE and ONE (as seen with the HFmix diet) could be one of the factors that causes metabolic syndrome linking its etiology to western diets, and (iii) diseases that lower fatty acid oxidation may lead to higher HNE and ONE levels, which in turn may worsen other diseases, such as type 2 diabetes [71–73].
Figure 9.
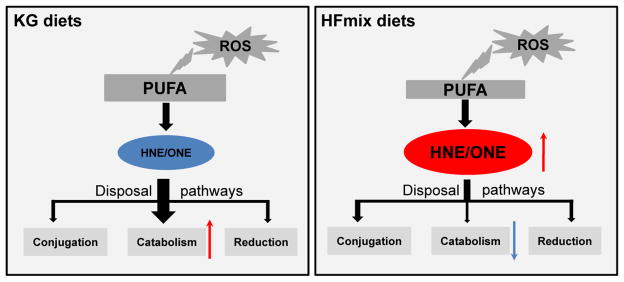
The relationship between HNE catabolism and the concentrations of HNE/ONE in the livers from rats fed the KG and HFmix diets.
Future work is required to investigate the consequences of an HFmix diet-induced chronic accumulation of HNE or ONE in the livers and other tissues. The catabolic flux of HNE and ONE in livers from rats fed KG and HFmix diets can be quantified by using mass isotope labeled substrates. The effect of different diets on the activity of enzymes involved in HNE catabolism should also be characterized.
Highlights.
Diet-altered 4-hydroxynonenal analogs in the rat livers were assayed by GC-MS.
Ketogenic diets accelerated the catabolic disposal of 4-hydroxynoenal analogs.
High fat mix diets decreased the catabolic disposal of 4-hydroxynoenal analogs.
4-Hydroxynonenal analogs accumulated in rat livers from high fat mix diet groups.
Acknowledgments
This work was supported, in whole or in part, by National Institutes of Health Roadmap Grant R33DK070291, Grant R01ES013925 and the Mouse Metabolic Phenotyping Center (MMPC, U24 DK76169) (to Henri Brunengraber, Dept of Nutrition, Case Western Reserve University). This work was also supported by a grant from the Cleveland Mt. Sinai Health Care Foundation.
Abbreviations
- HNE
4-hydroxynonenal
- ONE
4-oxononenal
- DHN
1,4-dihydroxynonene
- ω-6 PUFAs
ω-6 polyunsaturated fatty acids
- GSH
reduced glutathione
- BHB-CoA
3-hydroxybutyryl-CoA
- AcAc-CoA
acetoacetyl-CoA
- MID
mass isotope distributions
- TMS
trimethylsilyl
- GSH-HNE
HNE glutathione conjugate
- KG
ketogenic diet
- SD
standard diet
- LF
low fat diet
- HFmix
high fat mix diet
- EI
electron impact
- MRM
multiple reaction monitoring
- GSSR
glutathione conjugates
- PFB
pentafluorobenzyl oxime
Footnotes
Publisher's Disclaimer: This is a PDF file of an unedited manuscript that has been accepted for publication. As a service to our customers we are providing this early version of the manuscript. The manuscript will undergo copyediting, typesetting, and review of the resulting proof before it is published in its final citable form. Please note that during the production process errors may be discovered which could affect the content, and all legal disclaimers that apply to the journal pertain.
Reference List
- 1.Gueraud F, Atalay M, Bresgen N, Cipak A, Eckl PM, Huc L, Jouanin I, Siems W, Uchida K. Chemistry and biochemistry of lipid peroxidation products. Free Radic Res. 2010;44:1098–1124. doi: 10.3109/10715762.2010.498477. [DOI] [PubMed] [Google Scholar]
- 2.Esterbauer H, Schaur RJ, Zollner H. Chemistry and biochemistry of 4-hydroxynonenal, malonaldehyde and related aldehydes. Free Radic Biol Med. 1991;11:81–128. doi: 10.1016/0891-5849(91)90192-6. [DOI] [PubMed] [Google Scholar]
- 3.Parola M, Bellomo G, Robino G, Barrera G, Dianzani MU. 4-Hydroxynonenal as a biological signal: molecular basis and pathophysiological implications. Antioxid Redox Signal. 1999;1:255–284. doi: 10.1089/ars.1999.1.3-255. [DOI] [PubMed] [Google Scholar]
- 4.Schaur RJ. Basic aspects of the biochemical reactivity of 4-hydroxynonenal. Mol Aspects Med. 2003;24:149–159. doi: 10.1016/s0098-2997(03)00009-8. [DOI] [PubMed] [Google Scholar]
- 5.Sayre LM, Lin D, Yuan Q, Zhu X, Tang X. Protein adducts generated from products of lipid oxidation: focus on HNE and one. Drug Metab Rev. 2006;38:651–675. doi: 10.1080/03602530600959508. [DOI] [PubMed] [Google Scholar]
- 6.Huang H, Kozekov ID, Kozekova A, Wang H, Lloyd RS, Rizzo CJ, Stone MP. DNA cross-link induced by trans-4-hydroxynonenal. Environ Mol Mutagen. 2010;51:625–634. doi: 10.1002/em.20599. [DOI] [PMC free article] [PubMed] [Google Scholar]
- 7.Minko IG, Kozekov ID, Harris TM, Rizzo CJ, Lloyd RS, Stone MP. Chemistry and biology of DNA containing 1,N(2)-deoxyguanosine adducts of the alpha,beta-unsaturated aldehydes acrolein, crotonaldehyde, and 4-hydroxynonenal. Chem Res Toxicol. 2009;22:759–778. doi: 10.1021/tx9000489. [DOI] [PMC free article] [PubMed] [Google Scholar]
- 8.Bartsch H, Nair J. Oxidative stress and lipid peroxidation-derived DNA-lesions in inflammation driven carcinogenesis. Cancer Detect Prev. 2004;28:385–391. doi: 10.1016/j.cdp.2004.07.004. [DOI] [PubMed] [Google Scholar]
- 9.Aberle NS, Picklo MJ, Sr, Amarnath V, Ren J. Inhibition of cardiac myocyte contraction by 4-hydroxy-trans-2-nonenal. Cardiovasc Toxicol. 2004;4:21–28. doi: 10.1385/ct:4:1:21. [DOI] [PubMed] [Google Scholar]
- 10.Lee SH, Blair IA. Characterization of 4-oxo-2-nonenal as a novel product of lipid peroxidation. Chem Res Toxicol. 2000;13:698–702. doi: 10.1021/tx000101a. [DOI] [PubMed] [Google Scholar]
- 11.Spiteller P, Kern W, Reiner J, Spiteller G. Aldehydic lipid peroxidation products derived from linoleic acid. Biochim Biophys Acta. 2001;1531:188–208. doi: 10.1016/s1388-1981(01)00100-7. [DOI] [PubMed] [Google Scholar]
- 12.Marnett LJ, Burcham PC. Endogenous DNA adducts: potential and paradox. Chem Res Toxicol. 1993;6:771–785. doi: 10.1021/tx00036a005. [DOI] [PubMed] [Google Scholar]
- 13.Doorn JA, Petersen DR. Covalent modification of amino acid nucleophiles by the lipid peroxidation products 4-hydroxy-2-nonenal and 4-oxo-2-nonenal. Chem Res Toxicol. 2002;15:1445–1450. doi: 10.1021/tx025590o. [DOI] [PubMed] [Google Scholar]
- 14.Lin D, Lee HG, Liu Q, Perry G, Smith MA, Sayre LM. 4-Oxo-2-nonenal is both more neurotoxic and more protein reactive than 4-hydroxy-2-nonenal. Chem Res Toxicol. 2005;18:1219–1231. doi: 10.1021/tx050080q. [DOI] [PubMed] [Google Scholar]
- 15.Grune T, Siems WG, Petras T. Identification of metabolic pathways of the lipid peroxidation product 4-hydroxynonenal in in situ perfused rat kidney. J Lipid Res. 1997;38:1660–1665. [PubMed] [Google Scholar]
- 16.Zhong L, Liu Z, Yan R, Johnson S, Zhao Y, Fang X, Cao D. Aldo-keto reductase family 1 B10 protein detoxifies dietary and lipid-derived alpha, beta-unsaturated carbonyls at physiological levels. Biochem Biophys Res Commun. 2009;387:245–250. doi: 10.1016/j.bbrc.2009.06.123. [DOI] [PMC free article] [PubMed] [Google Scholar]
- 17.Orioli M, Aldini G, Benfatto MC, Facino RM, Carini M. HNE Michael adducts to histidine and histidine-containing peptides as biomarkers of lipid-derived carbonyl stress in urines: LC-MS/MS profiling in Zucker obese rats. Anal Chem. 2007;79:9174–9184. doi: 10.1021/ac7016184. [DOI] [PubMed] [Google Scholar]
- 18.Srivastava S, Chandra A, Wang LF, Seifert WE, Jr, DaGue BB, Ansari NH, Srivastava SK, Bhatnagar A. Metabolism of the lipid peroxidation product, 4-hydroxy-trans-2-nonenal, in isolated perfused rat heart. J Biol Chem. 1998;273:10893–10900. doi: 10.1074/jbc.273.18.10893. [DOI] [PMC free article] [PubMed] [Google Scholar]
- 19.Srivastava S, Conklin DJ, Liu SQ, Prakash N, Boor PJ, Srivastava SK, Bhatnagar A. Identification of biochemical pathways for the metabolism of oxidized low-density lipoprotein derived aldehyde-4-hydroxy trans-2-nonenal in vascular smooth muscle cells. Atherosclerosis. 2001;158:339–350. doi: 10.1016/s0021-9150(01)00454-3. [DOI] [PMC free article] [PubMed] [Google Scholar]
- 20.Hill BG, Awe SO, Vladykovskaya E, Ahmed Y, Liu SQ, Bhatnagar A, Srivastava S. Myocardial ischaemia inhibits mitochondrial metabolism of 4-hydroxy-trans-2-nonenal. Biochem J. 2009;417:513–524. doi: 10.1042/BJ20081615. [DOI] [PMC free article] [PubMed] [Google Scholar]
- 21.Zhang GF, Kombu RS, Kasumov T, Han Y, Sadhukhan S, Zhang J, Sayre LM, Ray D, Gibson KM, Anderson VA, Tochtrop GP, Brunengraber H. Catabolism of 4-hydroxyacids and 4-hydroxynonenal via 4-hydroxy-4-phosphoacyl-CoAs. J Biol Chem. 2009;284:33521–33534. doi: 10.1074/jbc.M109.055665. [DOI] [PMC free article] [PubMed] [Google Scholar]
- 22.Sadhukhan S, Han Y, Zhang GF, Brunengraber H, Tochtrop GP. Using isotopic tools to dissect and quantitate parallel metabolic pathways. J Am Chem Soc. 2010;132:6309–6311. doi: 10.1021/ja100399m. [DOI] [PMC free article] [PubMed] [Google Scholar]
- 23.Vial G, Dubouchaud H, Couturier K, Cottet-Rousselle C, Taleux N, Athias A, Galinier A, Casteilla L, Leverve XM. Effects of a high-fat diet on energy metabolism and ROS production in rat liver. J Hepatol. 2011;54:348–356. doi: 10.1016/j.jhep.2010.06.044. [DOI] [PubMed] [Google Scholar]
- 24.Xie Z, Li H, Wang K, Lin J, Wang Q, Zhao G, Jia W, Zhang Q. Analysis of transcriptome and metabolome profiles alterations in fatty liver induced by high-fat diet in rat. Metabolism. 2010;59:554–560. doi: 10.1016/j.metabol.2009.08.022. [DOI] [PubMed] [Google Scholar]
- 25.Kennedy AR, Pissios P, Otu H, Roberson R, Xue B, Asakura K, Furukawa N, Marino FE, Liu FF, Kahn BB, Libermann TA, Maratos-Flier E. A high-fat, ketogenic diet induces a unique metabolic state in mice. Am J Physiol Endocrinol Metab. 2007;292:E1724–E1739. doi: 10.1152/ajpendo.00717.2006. [DOI] [PubMed] [Google Scholar]
- 26.Schwartz RH, Eaton J, Bower BD, ynsley-Green A. Ketogenic diets in the treatment of epilepsy: short-term clinical effects. Dev Med Child Neurol. 1989;31:145–151. doi: 10.1111/j.1469-8749.1989.tb03972.x. [DOI] [PubMed] [Google Scholar]
- 27.Haas RH, Rice MA, Trauner DA, Merritt TA. Therapeutic effects of a ketogenic diet in Rett syndrome. Am J Med Genet Suppl. 1986;1:225–246. doi: 10.1002/ajmg.1320250525. [DOI] [PubMed] [Google Scholar]
- 28.Dhibi M, Brahmi F, Mnari A, Houas Z, Chargui I, Bchir L, Gazzah N, Alsaif MA, Hammami M. The intake of high fat diet with different trans fatty acid levels differentially induces oxidative stress and non alcoholic fatty liver disease (NAFLD) in rats. Nutr Metab (Lond) 2011;8:65. doi: 10.1186/1743-7075-8-65. [DOI] [PMC free article] [PubMed] [Google Scholar]
- 29.Garg N, Thakur S, Alex MC, Adamo ML. High fat diet induced insulin resistance and glucose intolerance are gender-specific in IGF-1R heterozygous mice. Biochem Biophys Res Commun. 2011;413:476–480. doi: 10.1016/j.bbrc.2011.08.123. [DOI] [PMC free article] [PubMed] [Google Scholar]
- 30.Ludwig DS. Diet and development of the insulin resistance syndrome. Asia Pac J Clin Nutr. 2003;12(Suppl):S4. [Google Scholar]
- 31.Honzatko A, Brichac J, Picklo MJ. Quantification of trans-4-hydroxy-2-nonenal enantiomers and metabolites by LC-ESI-MS/MS. J Chromatogr B Analyt Technol Biomed Life Sci. 2007;857:115–122. doi: 10.1016/j.jchromb.2007.07.004. [DOI] [PubMed] [Google Scholar]
- 32.Shibamoto T. Analytical methods for trace levels of reactive carbonyl compounds formed in lipid peroxidation systems. J Pharm Biomed Anal. 2006;41:12–25. doi: 10.1016/j.jpba.2006.01.047. [DOI] [PubMed] [Google Scholar]
- 33.Spies-Martin D, Sommerburg O, Langhans CD, Leichsenring M. Measurement of 4-hydroxynonenal in small volume blood plasma samples: modification of a gas chromatographic-mass spectrometric method for clinical settings. J Chromatogr B Analyt Technol Biomed Life Sci. 2002;774:231–239. doi: 10.1016/s1570-0232(02)00242-8. [DOI] [PubMed] [Google Scholar]
- 34.Williams TI, Lovell MA, Lynn BC. Analysis of derivatized biogenic aldehydes by LC tandem mass spectrometry. Anal Chem. 2005;77:3383–3389. doi: 10.1021/ac048265+. [DOI] [PubMed] [Google Scholar]
- 35.Des Rosiers C, Rivest MJ, Boily MJ, Jette M, Carrobe-Cohen A, Kumar A. Gas chromatographic-mass spectrometric assay of tissue malondialdehyde, 4-hydroxynonenal, and other aldehydes after their reduction to stable alcohols. Anal Biochem. 1993;208:161–170. doi: 10.1006/abio.1993.1023. [DOI] [PubMed] [Google Scholar]
- 36.Tomcik K, Ibarra RA, Sadhukhan S, Han Y, Tochtrop GP, Zhang GF. Isotopomer enrichment assay for very short chain fatty acids and its metabolic applications. Anal Biochem. 2011;410:110–117. doi: 10.1016/j.ab.2010.11.030. [DOI] [PMC free article] [PubMed] [Google Scholar]
- 37.Alary J, Fernandez Y, Debrauwer L, Perdu E, Gueraud F. Identification of intermediate pathways of 4-hydroxynonenal metabolism in the rat. Chem Res Toxicol. 2003;16:320–327. doi: 10.1021/tx025671k. [DOI] [PubMed] [Google Scholar]
- 38.Volkel W, varez-Sanchez R, Weick I, Mally A, Dekant W, Pahler A. Glutathione conjugates of 4-hydroxy-2(E)-nonenal as biomarkers of hepatic oxidative stress-induced lipid peroxidation in rats. Free Radic Biol Med. 2005;38:1526–1536. doi: 10.1016/j.freeradbiomed.2005.02.015. [DOI] [PubMed] [Google Scholar]
- 39.Rossi R, le-Donne I, Milzani A, Giustarini D. Oxidized forms of glutathione in peripheral blood as biomarkers of oxidative stress. Clin Chem. 2006;52:1406–1414. doi: 10.1373/clinchem.2006.067793. [DOI] [PubMed] [Google Scholar]
- 40.Kombu RS, Zhang GF, Abbas R, Mieyal JJ, Anderson VE, Kelleher JK, Sanabria JR, Brunengraber H. Dynamics of glutathione and ophthalmate traced with 2H-enriched body water in rats and humans. Am J Physiol Endocrinol Metab. 2009;297:E260–E269. doi: 10.1152/ajpendo.00080.2009. [DOI] [PMC free article] [PubMed] [Google Scholar]
- 41.Tiitinen KM, Yang B, Haraldsson GG, Jonsdottir S, Kallio HP. Fast analysis of sugars, fruit acids, and vitamin C in sea buckthorn (Hippophae rhamnoides L.) varieties. J Agric Food Chem. 2006;54:2508–2513. doi: 10.1021/jf053177r. [DOI] [PubMed] [Google Scholar]
- 42.Saggerson D, Ghadiminejad I, Awan M. Regulation of mitochondrial carnitine palmitoyl transferases from liver and extrahepatic tissues. Adv Enzyme Regul. 1992;32:285–306. doi: 10.1016/0065-2571(92)90023-s. [DOI] [PubMed] [Google Scholar]
- 43.Deng S, Zhang GF, Kasumov T, Roe CR, Brunengraber H. Interrelations between C4 ketogenesis, C5 ketogenesis, and anaplerosis in the perfused rat liver. J Biol Chem. 2009;284:27799–27807. doi: 10.1074/jbc.M109.048744. [DOI] [PMC free article] [PubMed] [Google Scholar]
- 44.Castro-Perez J, Previs SF, McLaren DG, Shah V, Herath K, Bhat G, Johns DG, Wang SP, Mitnaul L, Jensen K, Vreeken R, Hankemeier T, Roddy TP, Hubbard BK. In vivo D2O labeling to quantify static and dynamic changes in cholesterol and cholesterol esters by high resolution LC/MS. J Lipid Res. 2011;52:159–169. doi: 10.1194/jlr.D009787. [DOI] [PMC free article] [PubMed] [Google Scholar]
- 45.McGarry JD, Mannaerts GP, Foster DW. A possible role for malonyl-CoA in the regulation of hepatic fatty acid oxidation and ketogenesis. J Clin Invest. 1977;60:265–270. doi: 10.1172/JCI108764. [DOI] [PMC free article] [PubMed] [Google Scholar]
- 46.McGarry JD, Leatherman GF, Foster DW. Carnitine palmitoyltransferase I. The site of inhibition of hepatic fatty acid oxidation by malonyl-CoA. J Biol Chem. 1978;253:4128–4136. [PubMed] [Google Scholar]
- 47.Stopforth A, Burger BV, Crouch AM, Sandra P. Urinalysis of 4-hydroxynonenal, a marker of oxidative stress, using stir bar sorptive extraction-thermal desorption-gas chromatography/mass spectrometry. J Chromatogr B Analyt Technol Biomed Life Sci. 2006;834:134–140. doi: 10.1016/j.jchromb.2006.02.038. [DOI] [PubMed] [Google Scholar]
- 48.Selley ML. Determination of the lipid peroxidation product (E)-4-hydroxy-2-nonenal in clinical samples by gas chromatography--negative-ion chemical ionisation mass spectrometry of the O-pentafluorobenzyl oxime. J Chromatogr B Biomed Sci Appl. 1997;691:263–268. doi: 10.1016/s0378-4347(96)00446-x. [DOI] [PubMed] [Google Scholar]
- 49.Doorn JA, Srivastava SK, Petersen DR. Aldose reductase catalyzes reduction of the lipid peroxidation product 4-oxonon-2-enal. Chem Res Toxicol. 2003;16:1418–1423. doi: 10.1021/tx0300378. [DOI] [PubMed] [Google Scholar]
- 50.Poli G, Schaur RJ, Siems WG, Leonarduzzi G. 4-hydroxynonenal: a membrane lipid oxidation product of medicinal interest. Med Res Rev. 2008;28:569–631. doi: 10.1002/med.20117. [DOI] [PubMed] [Google Scholar]
- 51.Ballatori N, Truong AT, Ma AK, Boyer JL. Determinants of glutathione efflux and biliary GSH/GSSG ratio in perfused rat liver. Am J Physiol. 1989;256:G482–G490. doi: 10.1152/ajpgi.1989.256.3.G482. [DOI] [PubMed] [Google Scholar]
- 52.Leeuwenburgh C, Ji LL. Glutathone and glutathione ethyl ester supplementation of mice alter glutathione homeostasis during exercise. J Nutr. 1998;128:2420–2426. doi: 10.1093/jn/128.12.2420. [DOI] [PubMed] [Google Scholar]
- 53.Marnewick JL, Joubert E, Swart P, Van Der WF, Gelderblom WC. Modulation of hepatic drug metabolizing enzymes and oxidative status by rooibos (Aspalathus linearis) and Honeybush (Cyclopia intermedia), green and black (Camellia sinensis) teas in rats. J Agric Food Chem. 2003;51:8113–8119. doi: 10.1021/jf0344643. [DOI] [PubMed] [Google Scholar]
- 54.Reyes-Gordillo K, Segovia J, Shibayama M, Tsutsumi V, Vergara P, Moreno MG, Muriel P. Curcumin prevents and reverses cirrhosis induced by bile duct obstruction or CCl4 in rats: role of TGF-beta modulation and oxidative stress. Fundam Clin Pharmacol. 2008;22:417–427. doi: 10.1111/j.1472-8206.2008.00611.x. [DOI] [PubMed] [Google Scholar]
- 55.Lykkesfeldt J, Hagen TM, Vinarsky V, Ames BN. Age-associated decline in ascorbic acid concentration, recycling, and biosynthesis in rat hepatocytes--reversal with (R)-alpha-lipoic acid supplementation. FASEB J. 1998;12:1183–1189. doi: 10.1096/fasebj.12.12.1183. [DOI] [PubMed] [Google Scholar]
- 56.Wakita C, Maeshima T, Yamazaki A, Shibata T, Ito S, Akagawa M, Ojika M, Yodoi J, Uchida K. Stereochemical configuration of 4-hydroxy-2-nonenal-cysteine adducts and their stereoselective formation in a redox-regulated protein. J Biol Chem. 2009;284:28810–28822. doi: 10.1074/jbc.M109.019927. [DOI] [PMC free article] [PubMed] [Google Scholar]
- 57.Korotchkina LG, Yang H, Tirosh O, Packer L, Patel MS. Protection by thiols of the mitochondrial complexes from 4-hydroxy-2-nonenal. Free Radic Biol Med. 2001;30:992–999. doi: 10.1016/s0891-5849(01)00491-9. [DOI] [PubMed] [Google Scholar]
- 58.Aldini G, Carini M, Beretta G, Bradamante S, Facino RM. Carnosine is a quencher of 4-hydroxy-nonenal: through what mechanism of reaction? Biochem Biophys Res Commun. 2002;298:699–706. doi: 10.1016/s0006-291x(02)02545-7. [DOI] [PubMed] [Google Scholar]
- 59.Alary J, Gueraud F, Cravedi JP. Fate of 4-hydroxynonenal in vivo: disposition and metabolic pathways. Mol Aspects Med. 2003;24:177–187. doi: 10.1016/s0098-2997(03)00012-8. [DOI] [PubMed] [Google Scholar]
- 60.Du D, Shi YH, Le GW. Oxidative stress induced by high-glucose diet in liver of C57BL/6J mice and its underlying mechanism. Mol Biol Rep. 2010;37:3833–3839. doi: 10.1007/s11033-010-0039-9. [DOI] [PubMed] [Google Scholar]
- 61.Asselin C, Shi Y, Clement R, Tardif JC, Des Rosiers C. Higher circulating 4-hydroxynonenal-protein thioether adducts correlate with more severe diastolic dysfunction in spontaneously hypertensive rats. Redox Rep. 2007;12:68–72. doi: 10.1179/135100007X162202. [DOI] [PubMed] [Google Scholar]
- 62.Asselin C, Bouchard B, Tardif JC, Des Rosiers C. Circulating 4-hydroxynonenal-protein thioether adducts assessed by gas chromatography-mass spectrometry are increased with disease progression and aging in spontaneously hypertensive rats. Free Radic Biol Med. 2006;41:97–105. doi: 10.1016/j.freeradbiomed.2006.03.011. [DOI] [PubMed] [Google Scholar]
- 63.Voulgaridou GP, Anestopoulos I, Franco R, Panayiotidis MI, Pappa A. DNA damage induced by endogenous aldehydes: current state of knowledge. Mutat Res. 2011;711:13–27. doi: 10.1016/j.mrfmmm.2011.03.006. [DOI] [PubMed] [Google Scholar]
- 64.Pettazzoni P, Pizzimenti S, Toaldo C, Sotomayor P, Tagliavacca L, Liu S, Wang D, Minelli R, Ellis L, Atadja P, Ciamporcero E, Dianzani MU, Barrera G, Pili R. Induction of cell cycle arrest and DNA damage by the HDAC inhibitor panobinostat (LBH589) and the lipid peroxidation end product 4-hydroxynonenal in prostate cancer cells. Free Radic Biol Med. 2011;50:313–322. doi: 10.1016/j.freeradbiomed.2010.11.011. [DOI] [PubMed] [Google Scholar]
- 65.Liu Q, Raina AK, Smith MA, Sayre LM, Perry G. Hydroxynonenal, toxic carbonyls, and Alzheimer disease. Mol Aspects Med. 2003;24:305–313. doi: 10.1016/s0098-2997(03)00025-6. [DOI] [PubMed] [Google Scholar]
- 66.Markesbery WR. Oxidative stress hypothesis in Alzheimer’s disease. Free Radic Biol Med. 1997;23:134–147. doi: 10.1016/s0891-5849(96)00629-6. [DOI] [PubMed] [Google Scholar]
- 67.Leonarduzzi G, Chiarpotto E, Biasi F, Poli G. 4-Hydroxynonenal and cholesterol oxidation products in atherosclerosis. Mol Nutr Food Res. 2005;49:1044–1049. doi: 10.1002/mnfr.200500090. [DOI] [PubMed] [Google Scholar]
- 68.Grimsrud PA, Picklo MJ, Sr, Griffin TJ, Bernlohr DA. Carbonylation of adipose proteins in obesity and insulin resistance: identification of adipocyte fatty acid-binding protein as a cellular target of 4-hydroxynonenal. Mol Cell Proteomics. 2007;6:624–637. doi: 10.1074/mcp.M600120-MCP200. [DOI] [PubMed] [Google Scholar]
- 69.Suzuki D, Miyata T. Carbonyl stress in the pathogenesis of diabetic nephropathy. Intern Med. 1999;38:309–314. doi: 10.2169/internalmedicine.38.309. [DOI] [PubMed] [Google Scholar]
- 70.Cerbone A, Toaldo C, Laurora S, Briatore F, Pizzimenti S, Dianzani MU, Ferretti C, Barrera G. 4-Hydroxynonenal and PPARgamma ligands affect proliferation, differentiation, and apoptosis in colon cancer cells. Free Radic Biol Med. 2007;42:1661–1670. doi: 10.1016/j.freeradbiomed.2007.02.009. [DOI] [PubMed] [Google Scholar]
- 71.Zhang D, Christianson J, Liu ZX, Tian L, Choi CS, Neschen S, Dong J, Wood PA, Shulman GI. Resistance to high-fat diet-induced obesity and insulin resistance in mice with very long-chain acyl-CoA dehydrogenase deficiency. Cell Metab. 2010;11:402–411. doi: 10.1016/j.cmet.2010.03.012. [DOI] [PMC free article] [PubMed] [Google Scholar]
- 72.Schrauwen-Hinderling VB, Kooi ME, Hesselink MK, Jeneson JA, Backes WH, van Echteld CJ, van Engelshoven JM, Mensink M, Schrauwen P. Impaired in vivo mitochondrial function but similar intramyocellular lipid content in patients with type 2 diabetes mellitus and BMI-matched control subjects. Diabetologia. 2007;50:113–120. doi: 10.1007/s00125-006-0475-1. [DOI] [PubMed] [Google Scholar]
- 73.Simoneau JA, Veerkamp JH, Turcotte LP, Kelley DE. Markers of capacity to utilize fatty acids in human skeletal muscle: relation to insulin resistance and obesity and effects of weight loss. FASEB J. 1999;13:2051–2060. doi: 10.1096/fasebj.13.14.2051. [DOI] [PubMed] [Google Scholar]