Abstract
The in vitro deuteroacetylation of histones obtained from biological sources has been used previously in bottom-up mass spectrometry analyses to quantitate the percent of endogenous acetylation of specific lysine sites and/or peptides. In this report, derivatization of unmodified lysine residues on histones is used in combination with high performance mass spectrometry, including combined HPLC MS/MS, to distinguish and quantitate endogenously acetylated isoforms occurring within the same tryptic peptide sequence and to extend this derivatization strategy to other post-translational modifications, specifically methylation, dimethylation and trimethylation. The in vitro deuteroacetylation of monomethylated lysine residues is observed, though dimethylated or trimethylated residues are not derivatised. Comparison of the relative intensities ascribed to the deuteroacetylated and monomethylated species with the deuteroacetylated but unmethylated analog, provides an opportunity to estimate the percent of methylation at that site. In addition to the observed fragmentation patterns, the very high mass accuracy available on the Orbitrap mass spectrometer can be used to confirm the structural isoforms, and in particular to distinguish between trimethylated and acetylated species.
Introduction
In the nucleus, DNA is packaged as nucleosomes consisting of 146-basepairs of double-stranded DNA wrapped around the core histones H2A, H2B, H3 and H4 [1]. Each histone has two general domains -an inner core region and an exposed N-terminal “tail”, which can be post-translationally modified with acetylation, methylation, phosphorylation or other modifications [2]. Specific post-translational modifications (PTMs) and combinations of PTMs are proposed to function as a histone code that directs gene silencing, transcription, replication, cellular memory and gene recombination [3–5]. Elucidating histone post-translational modifications has thus become essential to understanding epigenetics.
One approach to characterizing histone PTMs is to use “bottom-up” mass spectrometric analysis [6], which begins with proteolytic digestion of the histone into peptide fragments. The molecular weight and mass spectral fragmentation pattern of each of these peptides are then used to determine its amino acid sequence and any modifications. The most commonly used protease is trypsin, which cleaves the amide peptide bond on the carboxyl side of the basic amino acid residues lysine and arginine except before proline [7]. Proteolysis by trypsin typically yields peptides ranging from 200–4000 Da, which are readily detected by mass spectrometry. However, histones have an abundance of lysine and arginine residues, so that tryptic digestion yields many small peptides that are not easily observed and comprise too few and repetitive sequences that make it difficult to establish the location of the modification. Moreover, the principal sites for modification by acetylation, methylation, ubiquitylation, etc., are the lysine residues. When modified these sites generally become “missed cleavages” [8], producing different peptide segments for the modified and unmodified forms that are then difficult to compare quantitatively. Smaller fragments are also less likely to encompass multiple modification sites, and therefore do not provide quantification for combinatorial isoforms.
The “top-down” or “middle-down” strategies used by Kelleher et al. [9], along with derivatization of lysine residues described by Garcia et al. [8,10], address some of these problems by using intact or longer sequences, and by direct fragmentation of these via electron capture dissociation (ECD) on a Fourier transform mass spectrometer (FTMS) [11–13]. It is assumed that the number and/or position of basic residues for the intact proteins will have minimal effect, compared with smaller structures, on their chemistry and therefore on the opportunities for relative quantitation of the different isoforms [14–15]. Furthermore, all possible structural/positional combinations will be intact and Kelleher et al., using hydrophilic interaction liquid chromatography (HILIC) in combination with FTMS have been able to identify and distinguish more than 150 differentially modified forms of histone H3.2 in HeLa cells using a top-down approach [9].
Alternatively, several groups have developed lysine-specific derivatization techniques that modify histone samples prior to digestion and mass spectrometric analysis [16–19]. Smith et al. used a mixture of deuterated (d4) acetic acid and deuterated (d6) acetic anhydride as the derivatization reagent, converting all endogenously unmodified lysines present in the sample to deuteroacetylated species, with a mass shift of +45 Da [16,17]. These label-modified lysines are then chemically and chromatographically equivalent to their in vivo acetylated counterparts, but distinguishable by a three Dalton mass difference (+45 Da vs. +42 Da, respectively). All lysine residues are then equivalently “blocked” from cleavage by trypsin, cleavage occurs at arginine residues only, and the fragments generated are now larger in size, providing ins some cases the ability to observe multiple modifications. From the mass spectra, three Dalton mass shifts are used to determine and quantitate endogenously acetylated (d0) and in vitro deuteroacetylated (d3) peptides. For peptides containing multiple lysines, this approach can quantitate the numbers of lysines acetylated, distinguishing and quantitating their positional isomeric forms. When additional modifications, such as methylation, are also present in the same peptide, this approach can be used to compare quantitatively those isoforms differing in acetylation but having a common methylation, or other modification, site. For these isoforms, the deuteroacetyl label eliminates several “biases” common in quantitation methods, since enzymatic digestion, chromatographic separation, and ionization efficiency (in the mass spectrometer) are effectively normalized. In our laboratory we have used deuteroacetylation with MALDI tandem time-of-flight mass spectrometry previously to determined the percent acetylation at K56 on histone H354–63 [FQK56STELLIR] in yeast deficient in sirtuins Hst3 and Hst4p [20] and identified the major isoforms spanning residues K5, K8, K12, and K16 in yeast histone H4 [21].
An alternative approach uses propionic anhydride to form propionyl analogs that differ in mass from the acetylated peptides by 14 Daltons and obviate the need for isotopic corrections to the relative abundances [22]. This approach has been used as well in a two step derivatization process, carried out before and after tryptic digestion, in which the second derivatization carries a stable isotope d5 analog to enable quantitative comparisons between two samples [23]. In our study, which focuses on the degree of acetylation at specific sites in a single sample, the use of a stable isotope analog was thought to provide the most similar chromatographic behavior, ionization efficiency and quantitative accuracy.
While the top down approach would appear to be the most direct, intact histone isoforms are relatively resistant to reverse-phase chromatographic separation [9], and the targeting of individual isoforms for data-dependant MS/MS analysis becomes exceedingly difficult as multiple precursor ion species with similar retention times can result in missing the lower abundance forms. Methods to improve the top down approach include the use of hydrophilic interaction chromatography (HILIC) to better separate histone mixtures [24] and “middle-down” mass spectrometric analysis using endoproteinase Glu-C digestion to enable focusing on the so-called “tail regions” where the bulk of the modifications are found [25,26].
In this context, we have continued to develop a bottom up approach that exploits and extends the advantages of prior lysine deuteroacetylation using high performance mass spectrometry and the application of the approach to other modifications. Specifically, both MALDI tandem time-of-flight (TOF) and high resolution nanospray/Orbitrap mass spectrometry are used here to characterize the positional microheterogeneity of the histone H4 tail region acetylation isoforms in HeLa cells and to observe the specific changes to the H4 tail region for cells treated with trichostatin A (TSA) and nicotinamide (NIA), two broad spectrum inhibitors of histone deacetylases (HDACs). In addition, deuteroacetylation enables the observation of methylated (lysine and arginine) species in the context of larger peptides that may also be acetylated. In several examples reported here it is shown that monomethylated lysines are derivatized by deuteroacetyation, while dimethylated and trimethylated lysines are not. While the ability to distinguish isobars with the same nominal mass is accomplished relatively quantitatively for methylated as well as acetylated species using this approach, the additional advantages of high mass resolution and accuracy to distinguish acetyl and trimethyl modifications are also shown.
Materials and Methods
Preparation of yeast histones
Yeast cells containing the appropriate plasmids were grown as reported previously [20]. Briefly, a 25 mL culture of yeast cells were inoculated in YPD medium and grown for 9–10 hours at 30 °C with shaking. This was transferred to 1 L YPD and grown overnight to an OD600 of 1. Cells were centrifuged at 500 ×g for 5 minutes and the resultant pellets washed in 100–200 mL of sterile water and pooled. The pooled pellet was re-spun, collected and resuspended in 20 mL of DTT/Tris buffer pH 9.4 followed by incubation with shaking for 15 minutes at 30 °C and centrifugation. The cell pellet was resuspended in 20 mL sorbitol/HEPES buffer pH 7.4 and lysed by adding 0.5 mg zymolase and incubating at 30 °C with gentle shaking (160 rpm) until cell wall digestion was complete. Spheroplasts were lysed in a buffer containing 0.5% NP-40. Histones were extracted with 0.25 N hydrochloric acid, precipitated at −20 °C with 8 volumes of cold acetone and centrifuged at 30K ×g, 4 °C for 30 minutes. The resultant histone-enriched pellet was resuspended in Tris-HCl buffer pH 8.0 and resolved in a 15% SDS polyacrylamide gel.
HeLa cell culture and histone purification
HeLa cells were cultured in Dulbecco’s modified eagle’s medium (DMEM) containing 10% fetal bovine sera (GIBCO; Invitrogen, Carlsbad, CA). Cells were plated and grown to 90% confluence. One sample was treated with deacetylase inhibitors: 1 µM Trichostatin A (TSA, Sigma-Aldrich, St. Louis, MO) and 10 mM nicotinamide (NIA, Sigma-Aldrich, St. Louis, MO) for three hours while the other sample was supplemented with an equal volume of solvent alone. TSA and NIA were dissolved in DMSO and deionized water, respectively. Cells were then harvested, pelleted and fractionated to isolate nuclei. Histones were acid extracted as described in the method by Wang et al. [23] that provides relatively purified histones, and resolved by SDS-PAGE (4–12% NuPAGE™ gels; Invitrogen, Carlsbad, CA) with purified chicken core histones (Millipore; Billerica, MA) run as markers, and the gel was stained with Coomassie Brilliant Blue (CBB).
Deutero (d3)-acetylation, chemical derivatization and digestion
Using reagents provided in the Trypsin Profiler IGD Kit for in-gel digestions (Sigma-Aldrich, St. Louis, MO), CBB-stained HeLa H4 gel bands were excised, cut into 1 mm pieces and destained for one hour with a 200 mM ammonium bicarbonate solution containing 40% acetonitrile. The destained protein bands were resuspended in a solution containing 50 µL deuterated (d4) acetic acid and 10 µL deuterated (d6) acetic anhydride (deuterated reagents; Sigma-Aldrich, St. Louis, MO). To ensure the derivatization reaction went to completion, gel bands were incubated in the deuterated reagents for five hours at room temperature. The treated gel slices were then rinsed with distilled water, titrated with 200 mM ammonium bicarbonate (Sigma-Aldrich, St. Louis, MO) to pH 8, rinsed with water again to remove remaining buffer salts, and dehydrated/dried in a Speed Vac. Proteins were digested in-gel with 0.4 µg trypsin (1 mg/ml in 1 mM HCl) in 40 mM ammonium bicarbonate containing 9% acetonitrile, incubated overnight at 37°C [27]. Resultant peptides were extracted from the gel and lyophilized to dryness before mass spectrometric analysis. All samples were reconstituted as stock solutions in 5 µL water with 0.1% trifluoroacetic acid (TFA; Pierce, Rockford, IL).
MALDI-TOF mass spectrometry
Matrix solution was prepared as 10 mg/mL α-cyano-4-hydroxycinnamic acid (Sigma Aldrich, St. Louis, MO) dissolved in a 1:1 solution of acetonitrile:deionized water containing 0.1% TFA. Undissolved matrix particles were removed via centrifugation. Using the dried droplet application technique, resultant matrix solution (1 µL) and the resuspended histone H3 and H4 peptide mixtures (1 µL) were spotted on the stainless steel MALDI target [28]. To ensure co-crystallization, target plates were spotted at room temperature using the sandwich method: deposit 1µL of matrix, 1µL of digest and 1µL of matrix, then redissolve in 50% AcN containing 0.1% TFA.
Deuteroacetylated HeLa histone H4 peptides were analyzed using a Shimadzu AXIMA-TOF2 tandem time-of-flight mass spectrometer (Manchester, UK) equipped with a 337 nm pulsed nitrogen laser, high energy collision chamber and curved-field reflectron [29,30]. The acceleration voltage was set at 20 kV. A four point, external calibration was applied per sample spot using a peptide mixture containing bradykinin (m/z 757.40), angiotensin II (m/z 1046.54), P14R (m/z 1533.86), ACTH fragment 18–39 (m/z 2465.20), and insulin B chain (m/z 3495.65). All peptides used in the calibration mixture were from Sigma Aldrich (St. Louis, MO). Each mass spectrum acquired consisted of an average of 500 profiles of 10 shots accumulated per profile.
Sample preparation for HPLC-ESI-MS/MS Analysis
4 µL of stock deuteroacetylated peptide mixture were diluted 2.5 fold (to a final volume of 10 µL) and placed in an Agilent 1200 autosampler (Agilent, Santa Clara, CA). 5 µL of each 10 µL sample were loaded by the autosampler through a trapping column onto a fused silica PicoFrit (New Objective, Woburn, MA) capillary column, 75 µm inner diameter (i.d.) ×120 mm long column packed in-house with 5 µm, 300 Å BioBasic C18 (Thermo Electron, Bremen, Germany) stationary phase, at a flow rate of 300 µl/min. Peptides were separated on-line via reversed phase nano high-performance liquid chromatography using the Eksigent Nano 2D high-performance liquid chromatography (HPLC) pumping system (Eksigent, Dublin, CA). The Eksigent Nano 2D HPLC system was controlled by XCalibur software, Version 2.0 (Thermo Electron, San Jose, CA). Separations were performed at mobile phase flow rate of 300 nL/min on the binary pump system using 0.1 % formic acid in deionized water (mobile phase A) and 90% (vol/vol) acetonitrile with 0.1% (vol/vol) formic acid (mobile phase B) using a linear gradient of 20–50% A over 60 minutes. The outlet flow of the nano-HPLC interfaced directly with the inlet of an LTQ-Orbitrap-XL (Thermo Electron, San Jose, CA) allowing for introduction of the analyte into the mass spectrometer.
Tandem Mass Spectrometric Analysis (LTQ-Orbitrap XL)
The LTQ-OrbitrapXL mass spectrometer was operated in data dependent mode. MS precursor scan spectra (m/z 300–2000) were acquired in the Orbitrap with mass resolution of 60,000; the six most intense ions from each MS scan were automatically targeted for fragmentation (MS/MS) in the ion trap. Using nitrogen as the collision gas, collision induced dissociation (CID) mediated peptide fragmentation in the linear ion trap. The LTQ-OrbitrapXL was controlled by XCalibur software. For each experiment, the source voltage was set at 2.4 V, the capillary voltage at 48 V, and the capillary temperature at 200°C. Sheath and auxiliary gases were not necessary because nanoflow parameters were being used. The tube lens voltage was kept at 105 V, and the ion gauge pressure was 1.5 × 10⁻⁵ Torr. The automatic gain control (AGC) was used at the manufacturers default settings for MS collection in the orbitrap (200,000) and MS/MS collection in the ion trap (10,000). Normalized collision energy was established at 35% for MS/MS. The default charge state was set at two. The isolation window for precursor ion selection was fixed at two Daltons. After an initial MS/MS fragmentation event, ions were excluded from additional fragmentation rounds for 30 seconds using dynamic exclusion. The ion selection threshold, the minimum signal required to trigger tandem mass spectrometry, was set to 500. The activation Q was set at 0.25.
Quantitation of peptide isoforms
Determining the relative ratio between acetyl (d0) and deuteroacetyl (d3) ion pairs gives the relative abundance of the in vivo acetylated and unmodified peptide forms. The relative acetylation of each peptide was determined by an in-house processing method that compares the peak height of acetylated peptides to the total for all observed forms of the peptide as measured from the charge-state reduced chromatogram of the peptides’ elution peak (generated using Xtract software package within XCalibur). Charge state reduction was employed such that the peak intensities from all charge states of each species were summed over the elution profile. Determining the relative ratio between acetyl (d0) and deuteroacetyl (d3) ion pairs gives the relative abundance between in vivo acetylated and unmodified peptide forms. To determine the relative abundance of positional isomers, where all isomeric forms fragment from the same precursor mass in the same MS/MS scan, we compared the peak intensities from selected b and y ion pairs distinguishing these isoforms [31]. Peak intensities from b and y ion pairs were summed together and this value was then divided by the total produced between both species.
Results and Discussion
Acetyl Quantitation
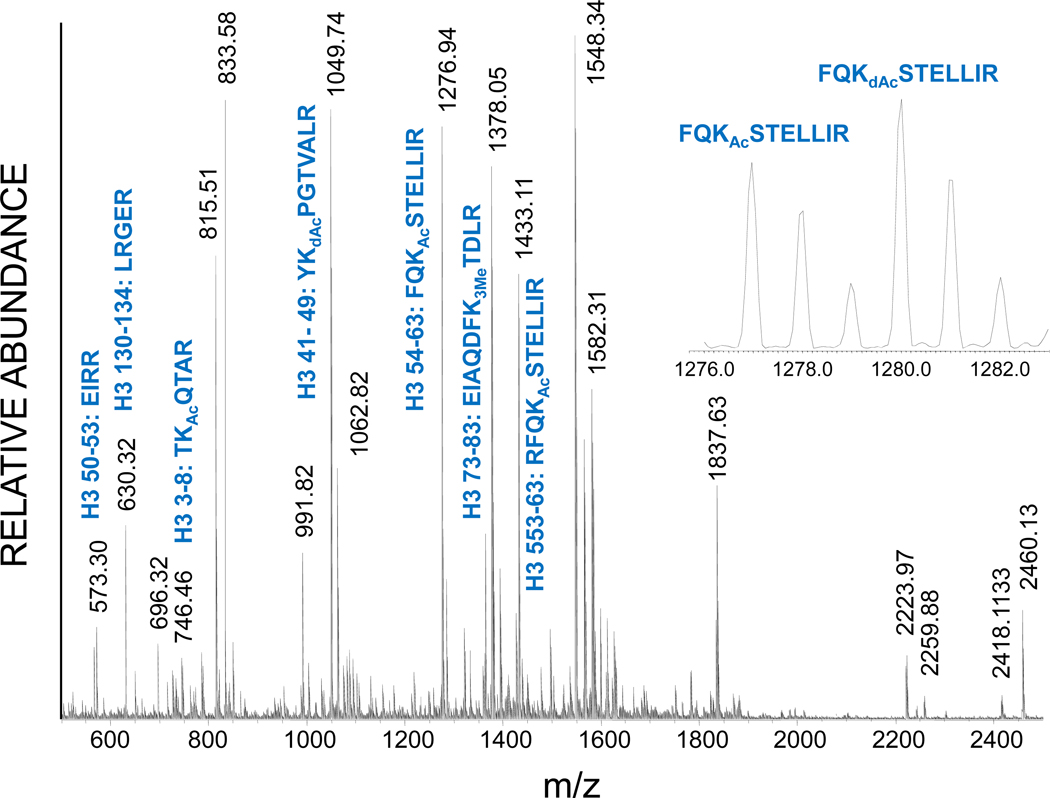
Figure 1 shows the MALDI time-of-flight mass spectrum of the tryptic digest of deuteroacetylated histone H3 from the hst3–H184A yeast mutant, a deletion mutant of the Sirtuin (HDAC) Hst3. Several of the tryptic peptides expected or identified previously are shown [20]. The peptide FQKSTELLIR encompasses the K56 residue, an acetylation site just inside the histone core region. In the expanded mass spectrum (Figure 1, inset) the acetylated FQKAcSTELLIR form is observed at m/z 1276.94 along with its molecular ion distribution resulting from naturally occurring isotopes. Without derivatization, the unacetylated analog could not be observed, as K56 would be a tryptic cleavage site. With derivatization, the unacetylated analog is also observed as the deuteroacetylated peptide FQKdAcSTELLIR three mass units higher at m/z 1279.95. Quantitative assessment of the degree of acetylation at this site is then based upon the fact that both species are chemically equivalent and that the ionization efficiencies are also equivalent. In this case 43% acetylation is determined after correction for the contribution of the 3rd isotope peak in the isotopic distribution of the naturally acetylated species to the peak intensity of the monoisotopic peak of the deuteroacetylated species. To determine the distribution in acetylation, the isotopic distributions of the endogenous and deuteroacetylated H4 peptides were simulated based on calculations using MS-isotope (Protein Prospector Software), available online at http://prospector.ucsf.edu/. For this mass and elemental composition the 3rd isotopic peak in the naturally acetylated peptide will have an area of 8.60% of that of its monoisotopic mass. [See Supplemental Figure S1].
Figure 1.
MALDI time-of-flight mass spectrum of the tryptic digest of purified and deuteroacetylated histone H3 from yeast cells. Masses corresponding to the peptides expected from several of the known post-translational modifications are annotated. Inset: expansion of the H3 54–63 peptide showing the distribution of naturally acetylated and deuteroacetylated species.
It should be noted that without derivatization the absence of a particular acetylated peptide would not preclude its presence in the sample, as this could be the result of poor ionization efficiency or other factors which generally limit full sequence coverage. However, the absence of acetylated peptides in the presence of their deuteroacetylated analogs can be definitive. Conversely, we were able to show previously that the yeast hst3hst4 double deletion mutant did indeed result in nearly 100% acetylation at this site [20], as little or no deuteroacetylated analogs were observed in this mutant, while they were observed in the single hst3 or hst4 mutants.
Acetylated H4 tail peptide GK5GGK8GLGK12GGAK16R
Figure 2 is the MALDI TOF mass spectrum of the tryptic digest of deuteroacetylated histone H4 from HeLa cells, again showing the most prominent expected peptides. Of particular interest is the histone H4 tail peptide GKGGKGLGKGGAKR encompassing residues 4–17. It includes four lysine residues, and in their 2003 report Smith et al. [16] had previously shown how conversion of all the unmodified lysine residues to their d3 deuteroacetylated derivatives could be used to quantitatively assess the distribution of tail peptides containing between 0 to 4 acetylated lysines.
Figure 2.
MALDI time-of-flight mass spectrum of the tryptic digest of purified and deuteroacetylated histone H4 from HeLa cells. Masses corresponding to the peptides expected from several of the known post-translational modifications are annotated.
In our laboratory, this same approach was used with both MALDI TOF and ESI Orbitrap mass spectrometry to monitor effects of the HDAC inhibitors trichostatin A and nicotinamide on the extent of acetylation and on the specific distribution of the positional isomeric forms. The MALDI mass spectrum in Figure 3(a) was used to determine the number of acetylated lysine residues for the peptide GKGGKGLGKGGAKR obtained from HeLa cells treated with TSA/NIA. Following derivatization all lysine residues are either acetylated (+42 Da) or deuteroacetylated (+45 Da), so that the lowest mass d0 at m/z 1439.03 in this isotopic distribution corresponds to GKGGKGLGKGGAKR that is fully acetylated. A single acetylation corresponds to the d9 peak, containing one acetylated lysine and three deuteroacetylated lysines. The unacetylated peptide is the d12 peak at m/z 1451.09. All of the peptides are chemically equivalent and the distribution is obtained from the peak heights of the d0, d3, d6, d9 and d12 species.
Figure 3.
Expansion of the MALDI mass spectral region for the deuteroacetylated H4 4–17 peptide GKGGKGLGKGGAKR showing the distribution of the non-acetylated (d12) to tetra-acetylated (d0) species for (a) histone derived from TSA-treated HeLa cells and (b) histone from untreated HeLa cells.
Then, when calculating the actual abundance of each differently modified peptide, the contribution of the 3rd isotope peak of the lighter isoforms to the intensity of the monoisotopic peak of the isoform heavier by 3 Da must be subtracted. For example, the corrected intensity of the d3 GK5GGK8GLGK12GGAK16R peptide species is calculated by subtracting 10.75% of the d0 monoisotopic peak from the measured d3 peak intensity. [See Supplemental Figure S2]. Corrected distributions for the unacetylated to tetra-acetylated species obtained in the MALDI TOF mass spectra are shown in Table 1 for both the endogenous and deacetylase inhibited HeLa cell samples.
Table 1.
Relative abundances of each differentially modified peptide population for the model GKGGKGLGKGGAKR peptide. Comparison of isotopically corrected data derived from both the LC-ESI MS and MALDI-TOF.
| No deacetylase inhibitor | With deacetylase inhibitors Trichostatin and Nicotinamide |
|||
|---|---|---|---|---|
| MALDI TOF | ESI Orbitrap | MALDI TOF | ESI Orbitrap | |
| No acetylation | 57% | 63% | 10% | 8% |
| 1 acetylation | 31% | 29% | 19% | 14% |
| 2 acetylations | 9% | 7% | 21% | 20% |
| 3 acetylations | 3% | 1% | 22% | 26% |
| 4 acetylations | 0% | 0.3% | 28% | 32% |
Figure 3(b) shows the analogous distribution for the histone tail peptide from untreated HeLa cells. Peptides with four acetylated lysines are not observed, and in fact three acetylated lysines are of very low abundance. Most of the peptides are unacetylated or mono-acetylated. Comparison with Figure 3(a) shows the effect of the HDAC inhibitors in promoting a high degree of acetylation. From Table 1, approximately 57% of isomers present in the endogenous HeLa H4 tail peptide had no acetylated lysine, i.e. the most abundant isoform of this peptide was unmodified. 31% of the peptide had one acetylated lysine, and 9% had two acetylated lysine residues. Less than four percent of the GK5GGK8GLGK12GGAK16R isoforms contained three or four acetylated lysines.
There are sixteen potential positional isomeric forms of the acetylated/deuteroacetylated peptide GK5GGK8GLGK12GGAK16R, including four mono-, six di- and four tri-acetylated species. Quantitation of positional isomers having the same precursor mass could not be determined using MALDI tandem analysis. Time-of-flight instruments generally have somewhat limited mass selection capability, so one cannot select isotopically pure precursors. Nonetheless, our preliminary work with this instrument indicated that the major monoacetylated species was acetylated at K16, while the major diacetylated species was acetylated on K8 and K16 [21]. This of course motivated our use of the LTQ/Orbitrap mass spectrometer to provide detailed analysis of the positional isomers.
Quantitation of H4 tail peptide isoforms using ESI Orbitrap MS/MS analysis
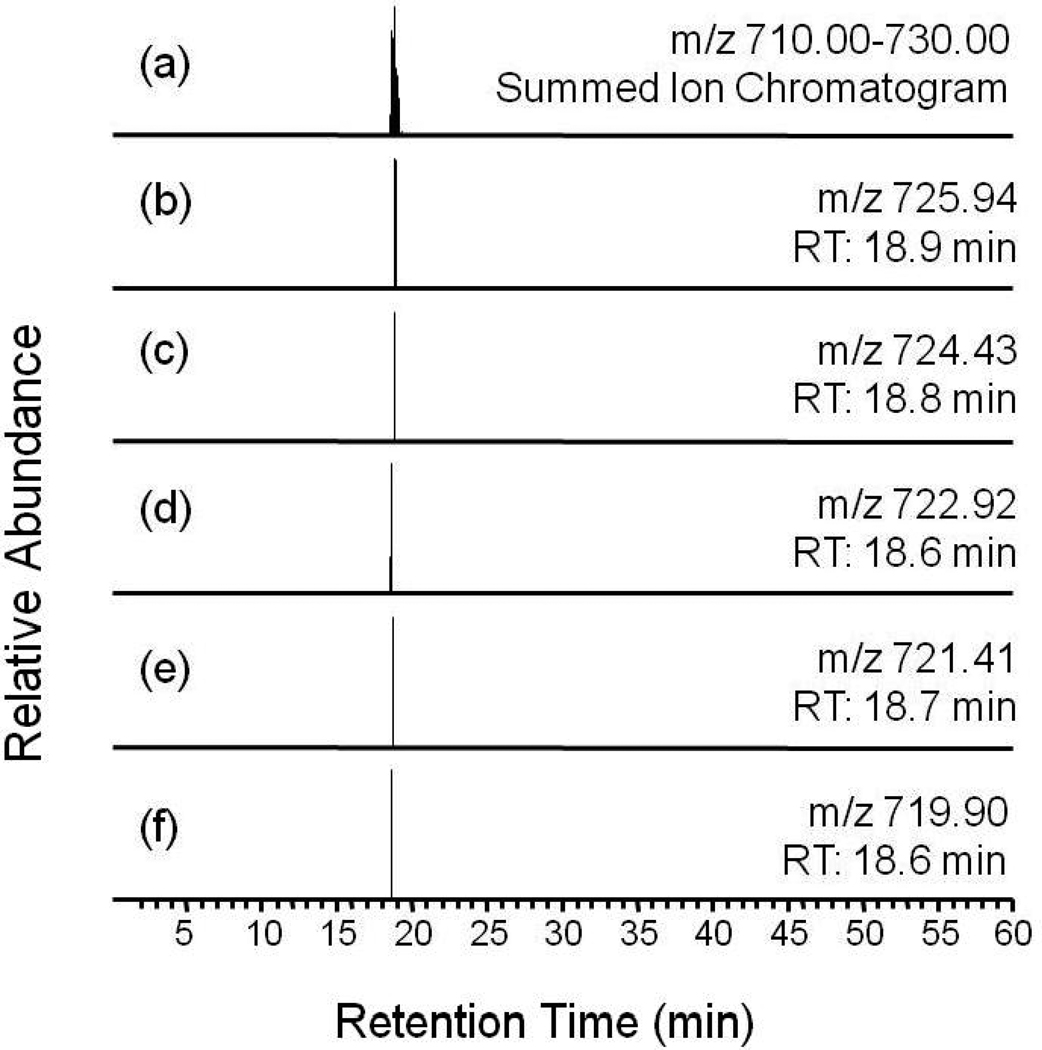
Tryptic digests of the deuteroacylated histones were analysed using on-line HPLC MS/MS. Quantitation based upon a comparison of relative peak heights is easily accomplished when the comparison is made between chemically and chromatographically equivalent species, specifically species differing only in isotopic composition. Thus, all 16 of the acetylated/deuteroacetylated isoforms of the tail peptide GK5GGK8GLGK12GGAK16R eluted from the column at the same time (Figure 4). While some small chromatographic differences were detected for peptides with different numbers of in vivo acetylations, by contrast positional isoforms, with the same number of naturally-occurring acetylations (and same molecular weights), had identical narrow retention times. Figure 5 is the ESI Orbitrap mass spectrum of the doubly-charged molecular ions of the tail peptides from the (a) untreated and (b) TSA/NIA treated HeLa samples. The extracted (isotopically corrected) relative abundances of the unacetylated to tetra-acetylated species are shown in Table 1, and are similar to those obtained by MALDI.
Figure 4.
Chromatographic traces for the acetylated/deuteroacetylated isoforms of the H4 4–17 peptide GKGGKGLGKGGAKR obtained by monitoring the doubly-charged molecular ions on an LTQ/Orbitrap mass spectrometer. Separation is by C18 column interfaced directly to a nanospray ionization source.
Figure 5.
Nanospray LTQ/Orbitrap mass spectra of the doubly-charged molecular ion regions for the acetylated/deuteroacetylated isoforms of peptide GKGGKGLGKGGAKR integrated across the chromatographic retention times shown in Figure 4. (a) untreated HeLa cells and (b) TSA-treated HeLa cells.
Doubly-charged molecular ions of the unacetylated to tetra-acetylated tail peptides GK5GGK8GLGK12GGAK16R were then each targeted for MS/MS fragmentation to quantitate the distributions of their positional isomers. Tandem mass spectra collected from each precursor mass were summed using the processing feature of Qual Browser (Xcaliber, Thermo Electron, San Jose, CA) and the average of the peak intensities from the fragment ions was used to determine the percentage of each fragment ion in the spectra. Calculated fragment ion masses for each were generated using Protein Prospector MS-Product. The standard deviation for the calculated percentage was determined by comparing the ratios of b-series and y-series ion intensities corresponding to cleavage at the same bond (e.g. y5 and b9, or y7 and b5) on the endogenous and deacetylase treated peptides, and was determined to be less than 5%.
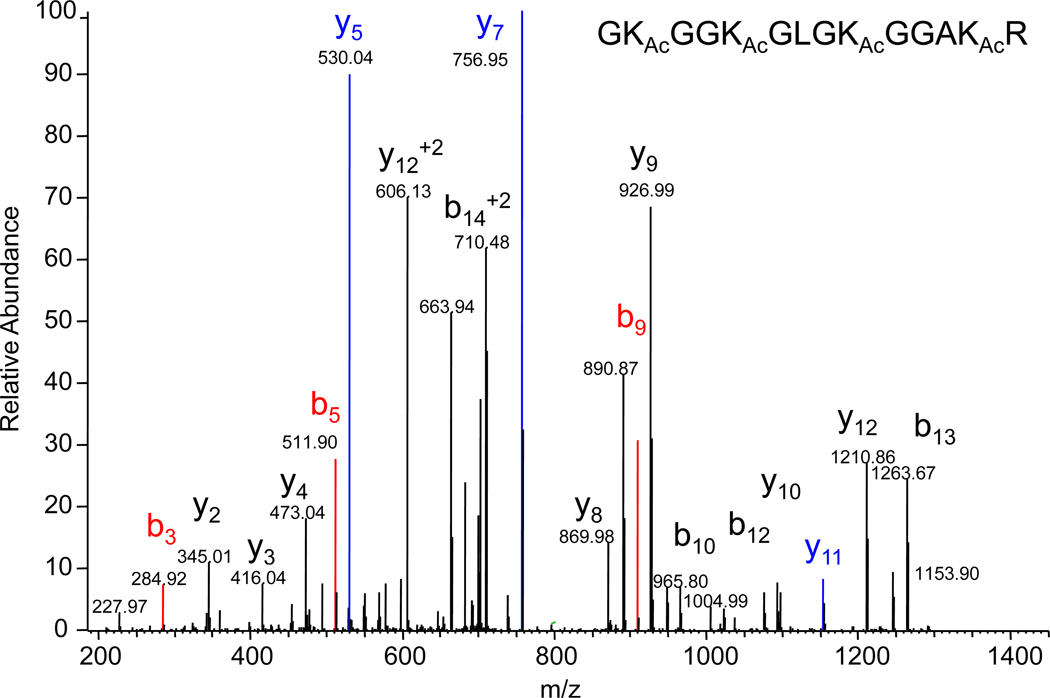
Figure 6 shows the MS/MS spectrum of the doubly-charged molecular ion m/z 719.90, which corresponds to the d0 (fully-acetylated) species from the TSA/NIA-treated sample. There is only one positional isomer with this molecular weight giving rise to a single set of b-series and y-series ions. From these we selected three b and y fragment ion “pairs” that describe the fragmentation between the four lysine residues: 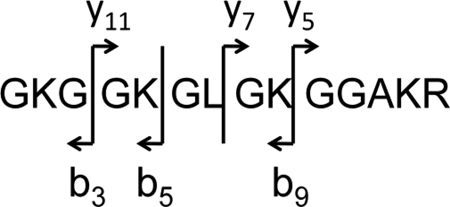 In choosing these ions we selected those that appear with reasonable intensity in all of the subsequent spectra of mixed isoforms.
Figure 6.
Full scan nanospray LTQ/Orbitrap MS/MS spectrum for the doubly-charged molecular ion of the fully acetylated (d0) isoform of the peptide GKGGKGLGKGGAKR highlighting the b-series (b3, b5 and b9) and y-series (y5, y7 and y11) ions used to quantitate the positional isomers.
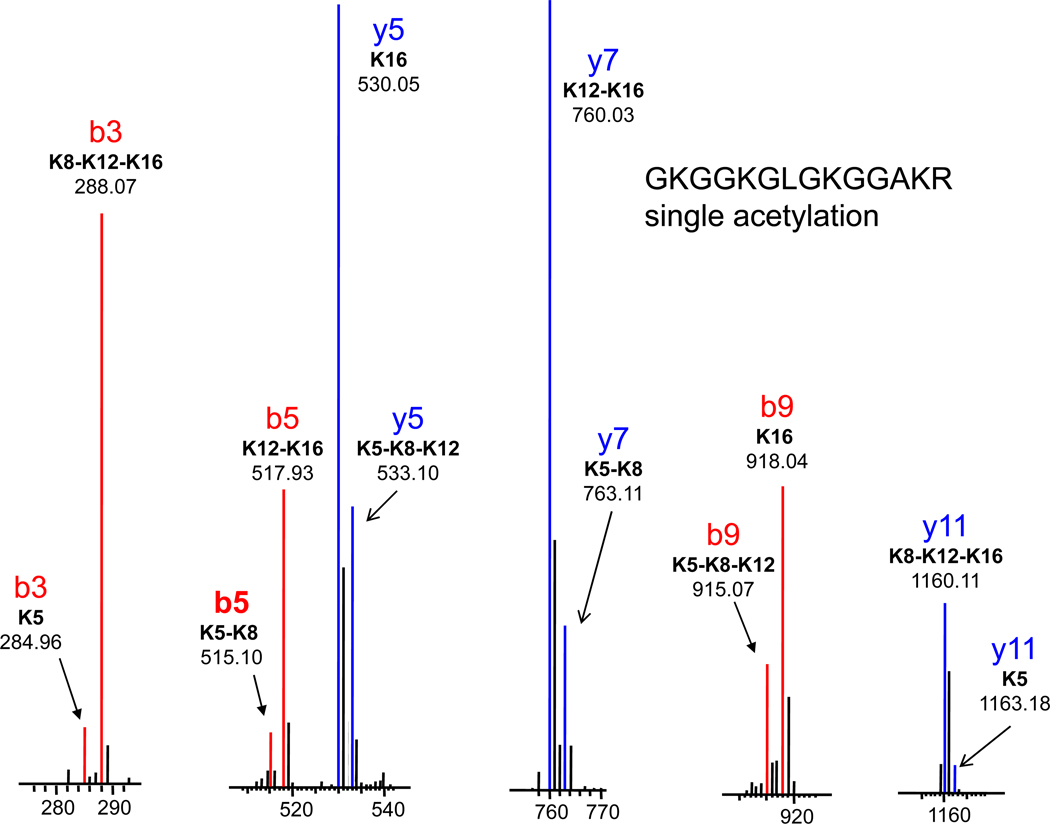
Figure 7 then shows expansions of the mass regions about these six fragment ion masses for the mono-acetylated isomers, of which there are four. Each of these b and y ions appears at two masses and can be used to describe the relative abundances of the isomeric forms. For example: b3 shows the ratio between ions acetylated at K5 and those acetylated at any of the other three lysines. The y11 fragment does the same, though the order of mass is reversed. These two ratios were averaged to produce the entry on Table 2 of 7.3% acetylation at K5 and 93% acetylation on all other lysines. The b5 and y7 ratios then determine the relative abundances of acetylation at K5 or K8 versus K12 or K16. And the b9 and y5 ratios determine the percentage acetylated at K16. Combining this data (Table 2), it is possible to determine that the composition for the mono-acetylated isomers from untreated cells is 7% K5, 5% K8, 13% K12 and 74% K16.
Figure 7.
Expanded mass spectral regions of the b-series (b3, b5 and b9) and y-series (y5, y7 and y11) ions used to quantitate the positional isomers of the monoacetylated (d9) GKGGKGLGKGGAKR peptide.
Table 2.
Fragment ions of monoacetylated GKGGKGLGKGGAKR peptide from histone H4 from HeLa cells: fractional abundance of y and b ion pairs.
| Fragment ions | acK5 | acK8 | acK12 | acK16 |
|---|---|---|---|---|
| y5 and b9 | 0.256 | 0.744 | ||
| y7 and b5 | 0.127 | 0.873 | ||
| y11 and b3 | 0.073 | 0.927 | ||
| Untreated HeLa cells | 7% | 5% | 13% | 74% |
| y5 and b9 | 0.303 | 0.697 | ||
| y7 and b5 | 0.146 | 0.854 | ||
| y11 and b3 | 0.063 | 0.937 | ||
| TSA-treated HeLa cells | 6% | 8% | 16% | 70% |
This computational assessment agrees with earlier MALDI TOF results showing K16Ac is the major mono-acetylated isoform [21]. Our findings are also consistent with previous biological studies. Histone H4 K16 acetylation is a reversible modification implicated in the widespread process of chromatin condensation by recruiting HATs to acetylate K12, K8, and K5. In mammals, K16 acetylation also correlates with K20 trimethylation [32]. Using an antibody approach to study site specific lysine acetylation in yeast histone H4, Suka et al. [33] found that lysine acetylation in the H4 N-terminal peptide4–17 occurs sequentially from the C-terminus to the N-terminus: K16 acetylation precedes K12Ac, which precedes K8Ac, leading finally to K5Ac. We found similar results for H4 tail peptides from TSA/NIA treated HeLa cells: 6% of the monoacetylated peptide was acetylated at the K5 residue, 8% at the K8 residue, 16% at K12, and 70% at K16 (Table 2).
There are six potential isomeric forms of the diacetylated H4 tail peptide4–17. It is not possible to distinguish all the diacetylated isomeric species from unique fragment masses. However, we determined that about 6% of untreated diacetylated peptide4–17 was acetylated at the K5 and K8 residues, whereas 20% were mixtures of acK5acK12 and acK5acK16, 34% comprised mixtures of acK8acK12 and acK8acK16, and 40% were acK12acK16 (Table 3). When the deacetylase inhibitor-treated histone H4 sample was evaluated, the most dominant diacetylated isomer was the acK12acK16 peptide, which constituted 59% of all diacetylated species. Three percent of the treated, diacetylated peptide4–17 was acK5acK8, 14% was the combination of acK5acK12 and acK5acK16, and 24% was the combination of acK8acK12 and acK8acK16. Results for the tri-acetylated peptide species are summarized in Table 4. In untreated samples, 23% of the triacetylated peptide4–17 was acK5acK8acK12, 10% was acK5acK8acK16, 28% was acK5acK12acK16, and acK8acK12acK16 comprised 39%. For the TSA/NIA samples, 6% of all triacetylated peptide4–17 species were acK5acK8 acK12, 11% of the total was acK5acK8acK16, 20% was acK5acK12acK16 and 62% was acK8acK12acK16.
Table 3.
Fractional abundances of fragment ions of di-acetylated GKGGKGLGKGGAKR peptide from histone H4 from HeLa cells.
| Fragment ions | acK5 acK8 |
acK5 acK12 |
acK5 acK16 |
acK8 acK12 |
acK8 acK16 |
acK12 acK16 |
|---|---|---|---|---|---|---|
| y7 and b5 | 0.056 | 0.541 | 0.402 | |||
| y11 and b3 | 0.255 | 0.745 | ||||
| Untreated HeLa cells | 6% | 20% | 34% | 40% | ||
| y7 and b5 | 0.032 | 0.373 | 0.595 | |||
| y11 and b3 | 0.168 | 0.832 | ||||
| TSA-treated HeLa cells | 3% | 14% | 24% | 59% | ||
Table 4.
Fractional abundances of fragment ions of tri-acetylated GKGGKGLGKGGAKR peptide from histone H4 from HeLa cells.
| Fragment ions | acK5 acK8 acK12 |
acK5 acK8 acK16 |
acK5 acK12 acK16 |
acK8 acK12 acK16 |
|---|---|---|---|---|
| b9 and y5 | 0.231 | 0.768 | ||
| y7 and b5 | 0.327 | 0.673 | ||
| y11 and b3 | 0.607 | 0.392 | ||
| Untreated HeLa cells | 23% | 10% | 28% | 39% |
| b9 and y5 | 0.064 | 0.936 | ||
| y7 and b5 | 0.174 | 0.826 | ||
| y11 and b3 | 0.379 | 0.621 | ||
| TSA-treated HeLa cells | 6% | 11% | 20% | 62% |
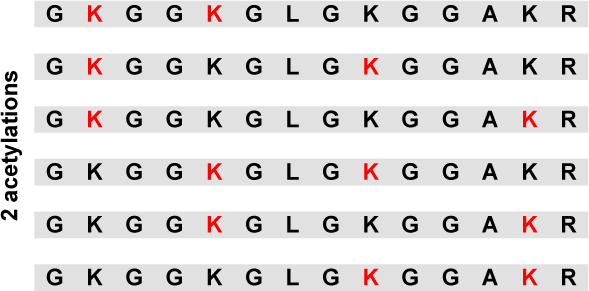
Combining these distributions with those in Table 1, we can determine the relative abundance for all positional isomers. Thus Table 5 displays the relative abundance of all 16 acetylated isoforms for the tail peptide. Without deacetylase inhibition, the most abundant peptide isoform is unacetylated (63%). The second most abundant isoform had a single acetylation at residue K16 (22%). In the presence of deacetylase inhibitors, as would be predicted, the most abundant peptide is fully acetylated (32%). Compared to untreated controls, no single modification profile predominates; however, isoforms that include modifications at K16 are generally more abundant.
Table 5.
Relative abundance of all 16 positional differentially modified peptides with the GKGGKGLGKGGAKR sequence for Histone H4 sample from both untreated HeLa cells and HeLa cells treated with deacetylase inhibitors TSA and NIA. (Lysine residues in red are acetylated).
| Isoforms | No deacetylase inhibitors |
With deacetylase inhibitors |
|---|---|---|
| 63% | 8% | |
 |
2 % | 1 % |
| 1 % | 1 % | |
| 4 % | 2 % | |
| 22 % | 10 % | |
 |
0.4 % | 0.6 % |
| 1 % | 3 % | |
| 2 % | 5 % | |
| 3 % | 12 % | |
 |
0.2 % | 2 % |
| 0.1 % | 3 % | |
| 0.3 % | 5 % | |
| 0.4 % | 16 % | |
| 0.3 % | 32 % |
Methylation of the K79 site in histone H3
It is more difficult to design an analogous strategy that uses isotopically labeled methylation to elucidate methylation sites for two reasons:because lysines may be mono-, di- and tri-methylated and because methylation can also occur on arginine residues. However, our deuteroacetylation strategy has also proven to be an effective strategy for resolving methylated structures as lysine derivatization restricts tryptic digestion to arginine residues, producing analagous longer peptide fragments that contain either/both acetylation and methylation modifications.
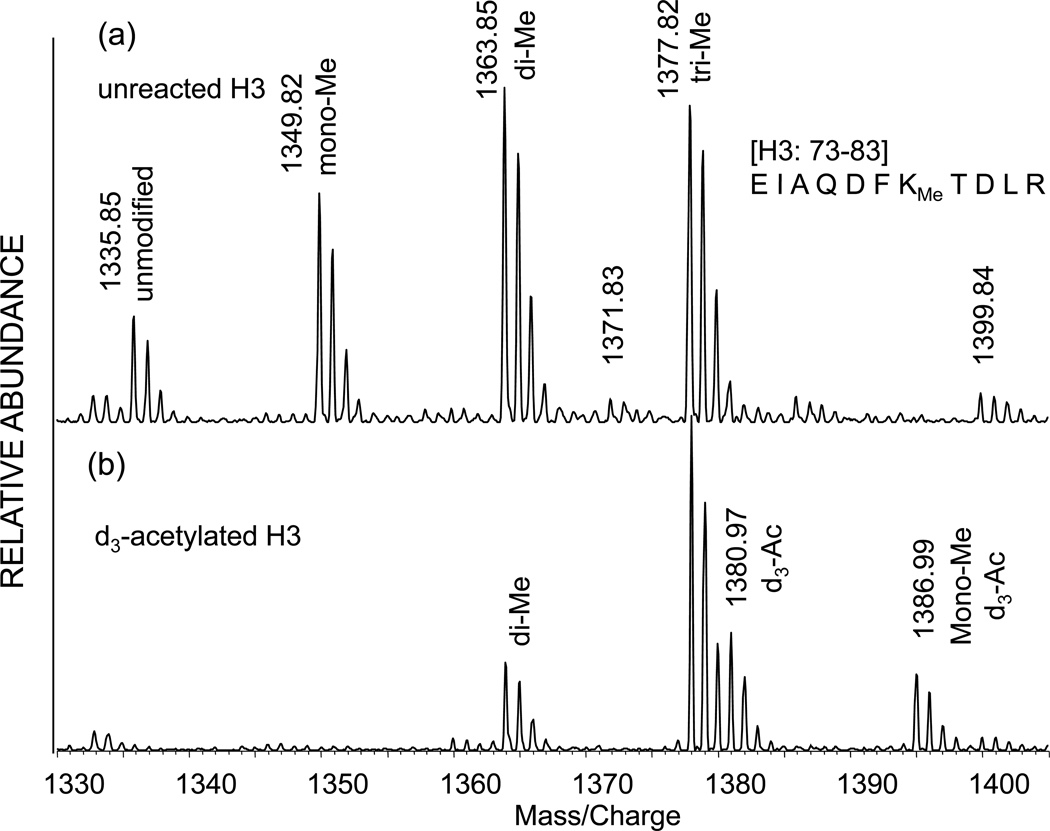
Figure 8(a) is the MALDI TOF mass spectrum of the yeast histone H3 fragment EIAQDFKTDLR corresponding to residues 73–83. This peptide fragment was obtained from incomplete tryptic digestion of underivatized wild-type histone H3 and reveals peaks corresponding to peptides unmodified, methylated, dimethylated and trimethylated at K79, though at this resolution the latter would not be distinguishable from acetylation. [The presence of trimethylation is shown below in our results using the Orbitrap]. Tryptic digestion of the deuteroacetylated histone H3 fragment in Figure 8(b) is interesting, because both the unmethylated and mono-methylated species have been derivatized, while the dimethylated and trimethylated (or acetylated) species are not derivatized. Specifically the unmodified peptide seen at m/z 1335.85 in Figure 8(a) now appears at m/z 1380.97 as the deuteroacetylated species three mass units above the trimethylated (or acetylated) species at m/z 1377.82. Derivatization of the mono-methyl species is observed in Figure 8(b) at m/z 1386.99. The equivalent derivatization of the monomethyl, but not the dimethyl and trimethyl, forms by proprionylation has also been observed [23].
Figure 8.
MALDI time-of-flight mass spectrum of the yeast histone H3 73–83 peptide EIAQDFKTDLR showing (a) unmethylated peptides and peptides methylated, dimethylated and trimethylated at lysine 79. (b) Deuteroacetylated peptide showing derivatization of both unmethylated and monomethylated species.
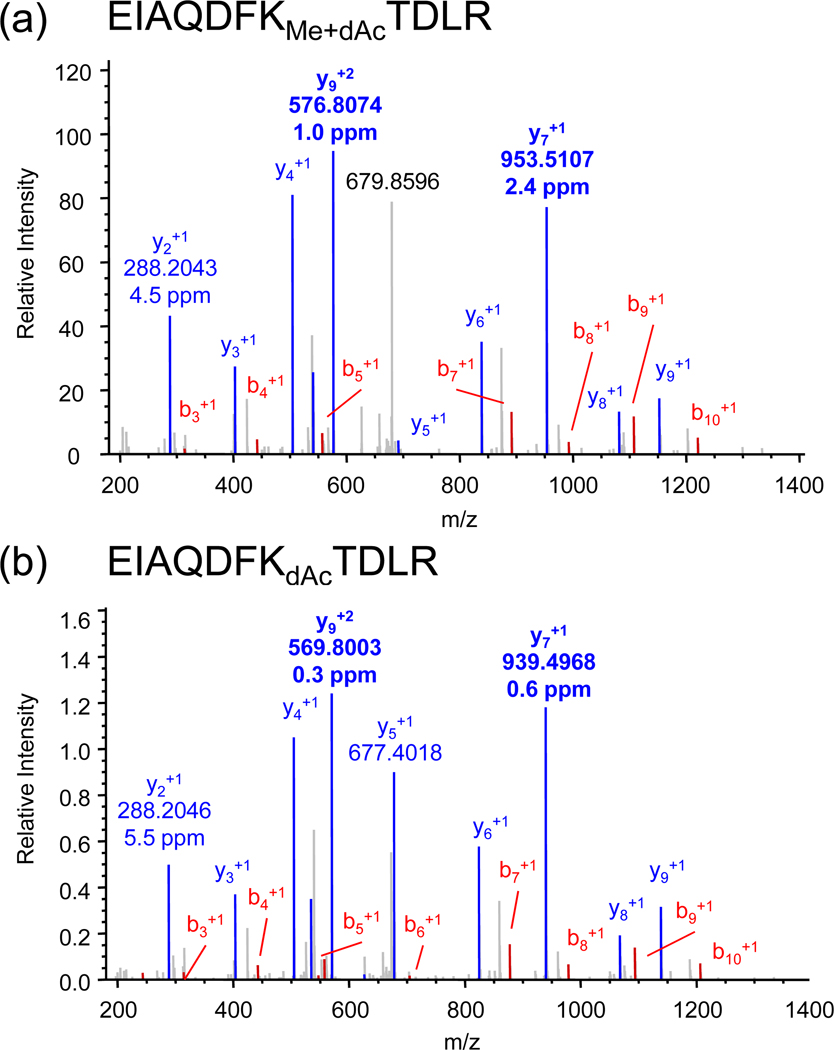
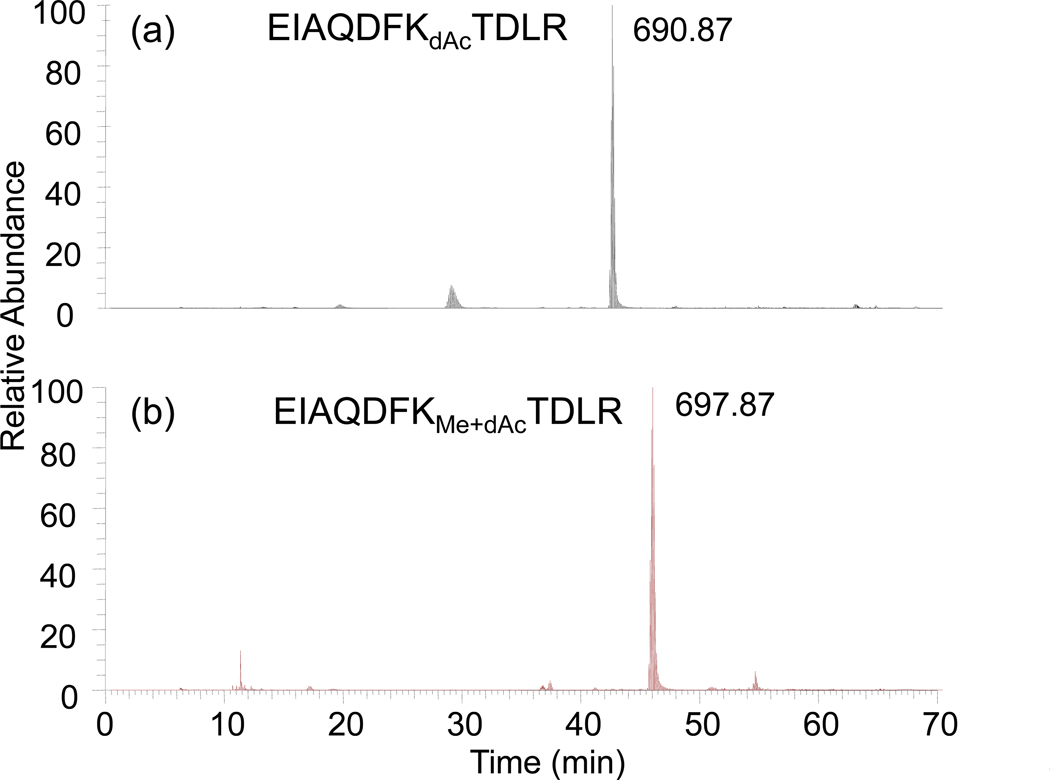
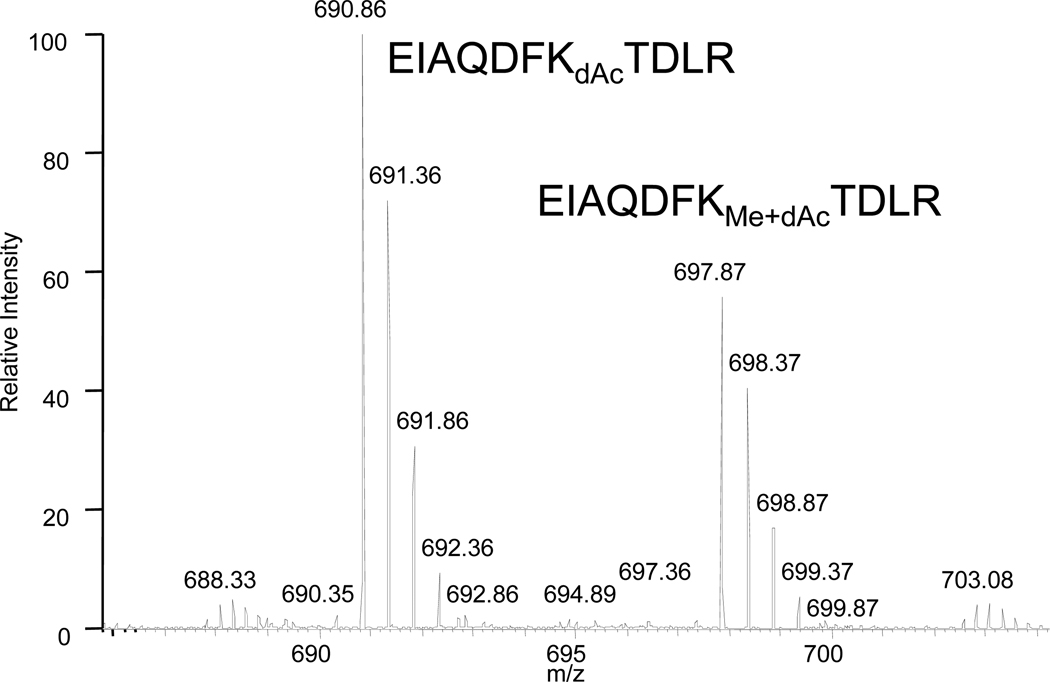
Electrospray mass spectra were also obtained for a yeast histone H3 sample containing unmodified and methylated K79. When deuteroacetylated, tryptic digestion produced the methylated/deuteroacetylated and deuteroacetylated species whose MS/MS spectra are shown in Figure 9, where the high mass accuracy obtainable from the Orbitrap mass spectrometer is noted for several of the major fragment ions. Interestingly, modification of the basic lysine residue in both cases produces fragmentation patterns that are quite equivalent, suggesting that their comparable ionization and fragmentation behavior may provide an opportunity to make some assessment of the degree of methylation. On the chromatographic time frame (Figure 10), the retention times are similar, though not identical. Integration of the mass spectra across this range of retention time produces the composite spectrum shown in Figure 11.
Figure 9.
Nanospray LTQ/Orbitrap MS/MS spectra of the doubly-charged molecular ions of the derivatized peptide EIAQDFKTDLR (a) methylated at lysine 79 and (b) unmethylated. The different masses of the y7 and y9 ions distinguish the two species, both of which are deuteroacetylated at lysine 79. Mass accuracy is shown for the major fragment peaks.
Figure 10.
C18 HPLC single ion chromatograms of derivatized (a) unmethylated and (b) methylated EIAQDFKTDLR obtained by monitoring the doubly charged molecular ions. Retention times of these two species, while not the same, are similar.
Figure 11.
Quantitation of the methylated and unmethylated EIAQDFKTDLR based upon integration of spectra obtained across the retention times of the two species.
Methylation of histone H3 peptide KSAPSTGGVKKPHR
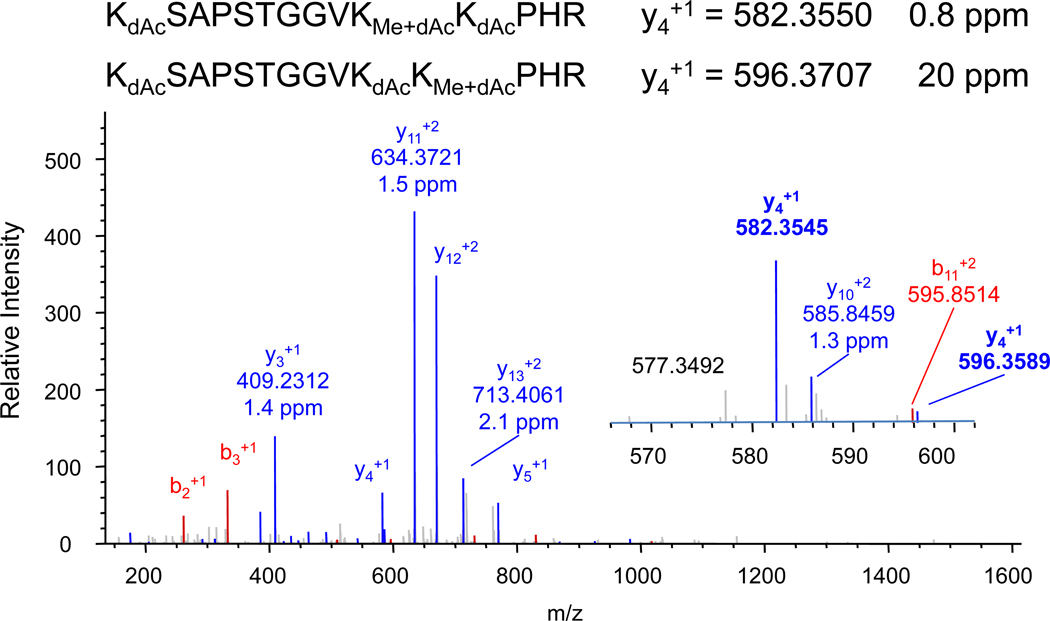
A tryptic fragment at m/z 533.6494 corresponds to the expected mass of the triply-charged peptide ion from the yeast H327–40 peptide KSAPSTGGVKKPHR carrying a methyl group and three deuteroacetylated lysines. The arginine residue and all three lysines are potential methylation sites. The collision induced dissociation (CID) MS/MS spectrum of the triply-charged molecular ion is shown in Figure 12. All of the observed b-series and y-series ions support methylation at either the K36 or K37 residues. The fragment ion that should distinguish these two possible structures is the singly-charged y4 ion, where the major peak at m/z 582.3545 (Figure 12 inset) corresponds to methylation of the K36 lysine. The mass accuracy of 0.8 ppm obtainable on the LTQ/Orbitrap mass spectrometer is excellent and consistent with the mass accuracy in that range for other observed fragment ions. A smaller peak at m/z 596.3589 may also correspond to the y4 ion of a structure in which the K37 site is methylated. The mass accuracy in this case is 20 ppm, which suggests that this does not correspond to methylation at the K37 site, or that the low signal/noise for this peak precludes obtaining a centroid with sufficient mass accuracy. In either case, methylation in this structure occurs primarily at K36.
Figure 12.
Nanospray LTQ/Orbitrap mass spectrum of the molecular ion of the singly methylated and fully deuteroacetylated H3 peptide KSAPSTGGVKKPHR. Both the fragmentation pattern and mass accuracy are used to determine the location of the methylated lysine. The major y4 fragment ion at 582.3545 differs 0.8 ppm from the calculated mass 582.3550 of isoform having methylation at the second lysine. A smaller peak at 596.3589 is close to the expected mass for the y4 ion of the isoform having methylation at the third lysine, but has an error of 20 ppm.
Like the previous example, methylated lysines are derivatized by the deuteroacetylation method, which in this case assists in the analysis by preserving these closely spaced lysine residues from cleavage by trypsin.
Trimethylation of histone H3 peptide KSAPSTGGVKKPHR
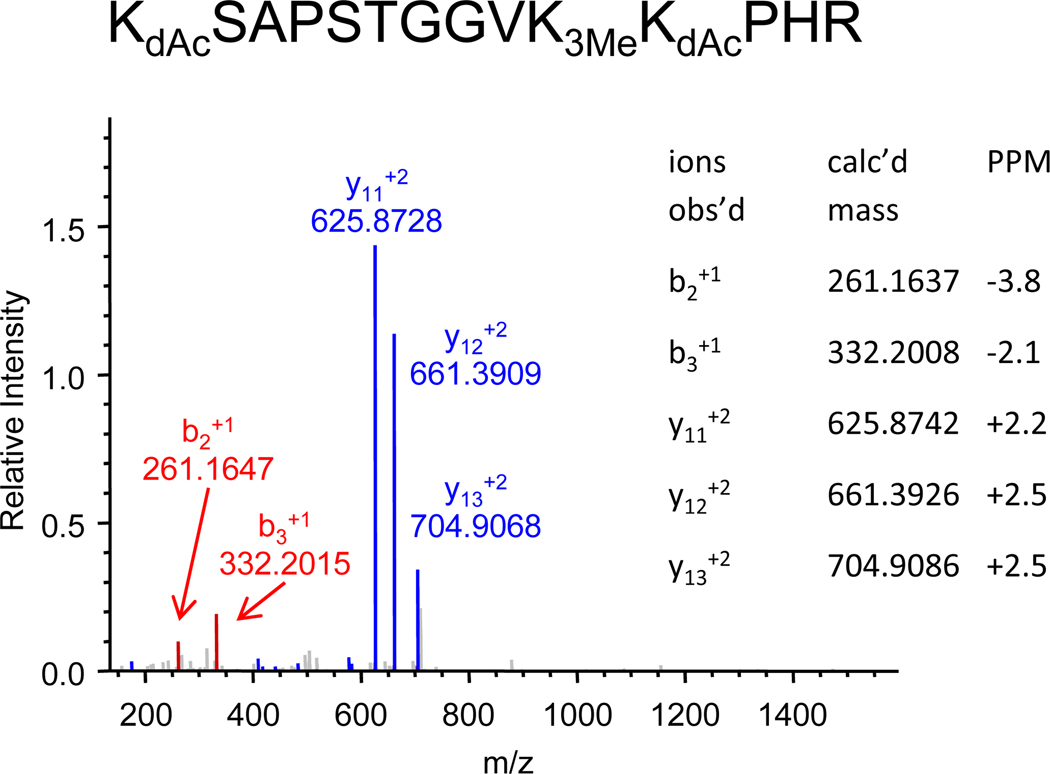
The deuteroacetylated histone H327–40 peptide from HeLa cells also reveals a trimethylation site. The MS/MS spectrum of the triply-charged molecular ion observed at m/z 527.9819 is shown in Figure 13, and shows the same characteristic ions corresponding to b2+1, b3+1 and y11 to y13. These fragment masses are consistent with a structure having two deuteroacetyled lysine residues and a trimethylated lysine residue, and are accurate within 2–3 ppm. In contrast, errors in the mass accuracies when compared with a structure having two deuteroacetylated and one acetylated lysine are of the order of 20–30 ppm, the approximate mass difference between an acetyl and a trimethyl modification. The masses of the b2+1 and b3+1 ions preclude trimethylation on the K27 residue, but no fragment ion was observed that would distinguish between trimethylation at the K36 and K37 sites. Based upon the observation of methylation at K36 in the prior example then, the likely structure is KSAPSTGGVK3MeKPHR (observed as KdAcSAPSTGGVK3MeKdAcPHR).
Figure 13.
Nanospray LTQ/Orbitrap MS/MS spectrum of the deuteroacetylated peptide KSAPSTGGVKKPHR + 4Me, distinguished from an acetylated species by the accurate mass measurement.
Note that the use of deuteroacetylation can be used to distinguish between this structure and one in which the methylation is distributed, eg. KMeSAPSTGGVKMeKMePH. In this case all three of the lysines would have been deuteroacetylated and would result in a much higher mass. Thus, even in the absence of high mass accuracy measurements, deuteroacetylation can in some case be used to distinguish between isomeric forms.
Conclusions
There is considerable interest in developing “global” mass spectrometry approaches to assess lysine acetylation, particularly as this type of modification now appears to play significant roles in many cellular processes and species. Other groups such as Zhao et al [34] have used alternative methods to quantitate lysine acetylation. Their approach utilizes anti-acetyllysine antibodies to enrich for endogenously acetylated proteins and stable isotope labeling with amino acids in cell culture (SILAC) for quantitation by mass spectrometry. The sirtuin proteins have been shown to have deacetylase activity in mitochondria [35]. Another group, Kelleher et al. [36], report a method for global histone profiling in response to inhibition or knockdown of human deacetylases using a linear ion trap Fourier transform mass spectrometer. In this approach, histone mixtures are subjected to methionine oxidation prior to RPLC separation to enable resolution of each histone type (H1, H2.B, H2A-1, etc.). The high mass resolution and accuracy of the FTMS then enable one to determine the numbers of acetyl and methyl groups, and the method generally regards these to be the most abundant isoforms, e.g. H4+2Me occurs on H4K20, H4+2Me +2Ac occurs as H4K202MeK12AcK16Ac, etc. This approach has the advantage of assessing all of the possible modification types, provides some quantitation of the overall modifications, but does not use MS/MS to provide details of positional isomeric forms. Alternatively, top-down methods using electron capture dissociation on the FTMS [13] provide structural verification of the major isoforms, but are not necessarily as quantitative as isotope based methods.
Our interest in the bottom up approach and chemical derivatization is based upon the possibility for exquisite and facile quantification of acetylation at specific residues, which was established in an earlier study by us of the acetylation of the K56 site in histone H3 for a series of hst3 and hst4 mutants [20]. In that study, MALDI mass spectra of protein digests (as shown in Figure 1) were obtained for histones derived from wild type, deletion mutants and H184A, N152A and D154A mutants. Using this quantitative method for cells synchronized in G1 phase, we were then able to monitor changes in K56 acetylation to observe the inactivation of Hst3/Hst4p during passage through S Phase in response to NIA [20; supplementary material]. Regulation of histone H3 K56 has been shown to be critical in the cell cycle of fungi [37] and is regulated by the fungal histone acetyltransferase Rtt109 [38], a homolog of p300/CBP specific for K56. In addition to the peptide containing K56, expansion of the isotopic displays from the MALDI mass spectra enabled quantitation of the acetylation of lysine residues in K9STGGK14APR and K18QLASK23AAR in histone H3 [20; supplementary material].
In addition to obtaining quantitative information on acetylation at the positional isoform level, the intent is to begin to utilize this bottom-up derivatization method to provide qualitative and semiquantitative analyses for other modifications, particularly methylation, dimethylation and trimethylation. Methylation of the K79 site on histone H3 is of particular importance in cell cycle and replication, and Kelleher et al. [39] have recently used a stable isotope strategy (SILAC) and mass spectrometry to compare the methylation and dimethylation of pre-existing (old) and newly-synthesized histones. While it is clear that the deuteroacetylated structures: EIAQDFKMe+dAcTDLR and EIAQDFKdAcTDLR encompassing the K79 site are not chemically and chromatographical identical, as in the case of stable isotope analogs, their similar responses to ionization and mass spectral sensitivity suggest that with the proper peptide analog experiment, analyses intended to observe changes in methylation at this site could be easily calibrated for accurate quantitation.
We conclude by noting that a bottom-up approach using global chemical derivatization of endogenously unmodified lysines is an effective alternative to top-down approaches that is advantageous when quantitative measurements are focused on specific modification sites, and that this approach can be extended to modifications other than acetylation.
Supplementary Material
Acknowledgements
The authors gratefully acknowledge collaborators Jef Boeke, Ivana Celic, Pamela Meluh and Junbiao Dai (Johns Hopkins) and Alain Verreault (University of Montreal) for providing and preparing mutant yeast histones, and Rocío Montes de Oca and Katherine L. Wilson (Johns Hopkins) for HeLa cell histones.
This project was supported by grant U54 RR020839 from the National Institutes of Health, contract NHLBI N01HV28180 from the National Heart Lung and Blood Institute, and by NIH grant R01GM48646 to K.L.W. The LTQ-Orbitrap mass spectrometer used in this study was purchased through grant S10 RR023025 from the NIH High End Instrumentation Program to R.J.C. Analyses were carried out at the Middle Atlantic Mass Spectrometry Laboratory.
Footnotes
Publisher's Disclaimer: This is a PDF file of an unedited manuscript that has been accepted for publication. As a service to our customers we are providing this early version of the manuscript. The manuscript will undergo copyediting, typesetting, and review of the resulting proof before it is published in its final citable form. Please note that during the production process errors may be discovered which could affect the content, and all legal disclaimers that apply to the journal pertain.
References
- 1.Luger K, Mäder AW, Richmond RK, Sargent DF, Richmond TJ. 1.Crystal structure of the nucleosome core particle at 2.8 Å resolution. Nature. 1997;389:251–260. doi: 10.1038/38444. [DOI] [PubMed] [Google Scholar]
- 2.Cheung P, Allis CD, Sassone-Corsi P. Signaling to chromatin through histone modifications. Cell. 2000;103(2):263–271. doi: 10.1016/s0092-8674(00)00118-5. [DOI] [PubMed] [Google Scholar]
- 3.Barlési F, Giaccone G, Gallegos-Ruiz MI, Loundou A, Span SW, Lefesvre P, Kruyt FA, Rodriguez JA. Global Histone Modifications Predict Prognosis of Resected Non–Small-Cell Lung Cancer. J. Clin. Oncol. 2007;25:4358–4364. doi: 10.1200/JCO.2007.11.2599. [DOI] [PubMed] [Google Scholar]
- 4.Bönisch C, Nieratschker SM, Orfanos NK, Hake SB. Chromatin proteomics and epigenetic regulatory circuits. Expert Rev. Proteomics. 2008;5:105–119. doi: 10.1586/14789450.5.1.105. [DOI] [PubMed] [Google Scholar]
- 5.Su X, Ren C, Freitas MA. Mass spectrometry-based strategies for characterization of histones and their post-translational modifications. Expert Rev. Proteomics. 2007;4:211–225. doi: 10.1586/14789450.4.2.211. [DOI] [PMC free article] [PubMed] [Google Scholar]
- 6.Burlingame AL, Zhang X, Chalkley RJ. Mass spectrometric analysis of histone posttranslational modifications. Methods. 2005;36:383–394. doi: 10.1016/j.ymeth.2005.03.009. [DOI] [PubMed] [Google Scholar]
- 7.Olsen JV, Ong SE, Mann M. Trypsin Cleaves Exclusively C-terminal to Arginine and Lysine Residues. Mol. Cell. Proteomics. 2004;3:608–614. doi: 10.1074/mcp.T400003-MCP200. [DOI] [PubMed] [Google Scholar]
- 8.Garcia BA, Mollah S, Ueberheide BM, Busby SA, Muratore TL, Shabanowitz J, Hunt DF. Chemical derivatization of histones for facilitated analysis by mass spectrometry. Nat. Protoc. 2007;2(4):933–938. doi: 10.1038/nprot.2007.106. [DOI] [PMC free article] [PubMed] [Google Scholar]
- 9.Siuti N, Kelleher NL. Decoding protein modifications using top-down mass spectrometry. Nat. Methods. 2007;4:817–821. doi: 10.1038/nmeth1097. [DOI] [PMC free article] [PubMed] [Google Scholar]
- 10.Garcia BA, Shabanowitz J, Hunt DF. Characterization of histones and their post-translational modifications by mass spectrometry. Curr. Opin. Chem. Biol. 2007;11:66–73. doi: 10.1016/j.cbpa.2006.11.022. [DOI] [PubMed] [Google Scholar]
- 11.Jiang L, Smith JN, Anderson SL, Ma P, Mizzen CA, Kelleher NL. Global Assessment of Combinatorial Post-translational Modification of Core Histones in Yeast Using Contemporary Mass Spectrometry: Lys4 Trimethylation Correlates with Degree of Acetylation on the Same H3 Tail. J. Biol. Chem. 2007;282:27923–27934. doi: 10.1074/jbc.M704194200. [DOI] [PubMed] [Google Scholar]
- 12.Boyne MT, 2nd, Pesavento JJ, Mizzen CA, Kelleher NL. Precise Characterization of Human Histones in the H2A Gene Family by Top Down Mass Spectrometry. J. Proteome Res. 2006;5:248–253. doi: 10.1021/pr050269n. [DOI] [PubMed] [Google Scholar]
- 13.Siuti N, Roth MJ, Mizzen CA, Kelleher NL, Pesavento JJ. Gene-Specific Characterization of Human Histone H2B by Electron Capture Dissociation. J. Proteome Res. 2006;5:233–239. doi: 10.1021/pr050268v. [DOI] [PubMed] [Google Scholar]
- 14.Young N, DiMaggio P, Plazas-Mayorca M, Baliban R, Floudas C, Garcia B. High Throughput Characterization of Combinatorial Histone Codes. Mol. Cell. Proteomics. 2009;8(10):2266–2284. doi: 10.1074/mcp.M900238-MCP200. [DOI] [PMC free article] [PubMed] [Google Scholar]
- 15.Pesavento J, Kim Y, Taylor G, Kelleher N. Shotgun Annotation of Histone Modifications: A New Approach for Streamlined Characterization of Proteins by Top Down Mass Spectrometry. J. Am. Chem. Soc. 2004;126(11):3386–3387. doi: 10.1021/ja039748i. [DOI] [PMC free article] [PubMed] [Google Scholar]
- 16.Smith CM, Gafken PR, Zhang Z, Gottschling DE, Smith JB, Smith DL. Mass spectrometric quantification of acetylation at specific lysines within the amino-terminal tail of histone H4. Anal. Biochem. 2003;316:23–33. doi: 10.1016/s0003-2697(03)00032-0. [DOI] [PubMed] [Google Scholar]
- 17.Smith CM. Quantification of acetylation at proximal lysine residues using isotopic labeling and tandem mass spectrometry. Methods. 2005;36:395–403. doi: 10.1016/j.ymeth.2005.03.007. [DOI] [PubMed] [Google Scholar]
- 18.Lee AY, Paweletz CP, Pollock RM, Settlage RE, Cruz JC, Secrist JP, Miller TA, Stanton MG, Kral AM, Ozerova ND, Meng F, Yates NA, Richon V, Hendrickson RC. Quantitative Analysis of Histone Deacetylase-1 Selective Histone Modifications by Differential Mass Spectrometry. J. Proteome Res. 2008;7(12):5177–5186. doi: 10.1021/pr800510p. [DOI] [PubMed] [Google Scholar]
- 19.Beck HC, Nielsen EC, Matthiesen R, Jensen LH, Sehested M, Finn P, Grauslund M, Hansen AM, Jensen ON. Quantitative Proteomic Analysis of Post-translational Modifications of Human Histones. Mol. Cell. Proteomics. 2006;5(7):1314–1325. doi: 10.1074/mcp.M600007-MCP200. [DOI] [PubMed] [Google Scholar]
- 20.Celic I, Masumoto H, Griffith WP, Meluh P, Cotter RJ, Boeke JD, Verreault A. The Sirtuins Hst3 and Hst4p Preserve Genome Integrity by Controlling Histone H3 Lysine 56 Deacetylation. Curr. Biol. 2006;16:1280–1289. doi: 10.1016/j.cub.2006.06.023. and Supplementary Material. [DOI] [PubMed] [Google Scholar]
- 21.Cotter RJ, Griffith W, Jelinek C. Tandem time-of-flight (TOF/TOF) mass spectrometry and the curved-field reflectron. J. Chromatog. B. 2007;855:2–13. doi: 10.1016/j.jchromb.2007.01.009. [DOI] [PubMed] [Google Scholar]
- 22.Garcia BA, Mollah S, Ueberheide BM, Busby SA, Muratore TL, Shabanowitz J, Hunt DF. Chemical derivatization of histones for facilitated analysis by mass spectrometry. Nat. Protoc. 2007;2:933–938. doi: 10.1038/nprot.2007.106. [DOI] [PMC free article] [PubMed] [Google Scholar]
- 23.Plazas-Mayorca MD, Zee BM, Young NL, Fingerman IM, LeRoy G, Briggs SD, Garcia BA. One-pot shotgun quantitative mass spectrometry characterization of histones. J. Proteome Res. 2009;8:5367–5374. doi: 10.1021/pr900777e. [DOI] [PMC free article] [PubMed] [Google Scholar]
- 24.Garcia BA, Pesavento JJ, Mizzen CA, Kelleher NL. Pervasive combinatorial modification of histone H3 in human cells. Nat. Methods. 2007;4:487–489. doi: 10.1038/nmeth1052. [DOI] [PubMed] [Google Scholar]
- 25.Wang AH, Bertos NR, Vezmar M, Pelletier N, Crosato M, Heng HH, Th'ng J, Han J, Yang X. HDAC4, a human histone deacetylase related to yeast HDA1, is a transcriptional corepressor. Mol Cell Biol. 1999;19:7816–7827. doi: 10.1128/mcb.19.11.7816. [DOI] [PMC free article] [PubMed] [Google Scholar]
- 26.Young NL, DiMaggio PA, Plazas-Mayorca MD, Baliban RC, Floudas CA, Garcia BA. High throughput characterization of combinatorial histone codes. Mol. Cell. Proteomics. 2009;8:2266–2284. doi: 10.1074/mcp.M900238-MCP200. [DOI] [PMC free article] [PubMed] [Google Scholar]
- 27.Jiménez CR, Huang L, Qiu Y, Burlingame AL. In-Gel Digestion of Proteins for MALDI-MS Fingerprint Mapping. Curr. Protocols in Prot. Sci. 1998:16.4. doi: 10.1002/0471140864.ps1604s14. [DOI] [PubMed] [Google Scholar]
- 28.Cohen SL, Chait BT. Influence of Matrix Solution Conditions on the MALDI-MS Analysis of Peptides and Proteins. Anal. Chem. 1996;68:31–37. doi: 10.1021/ac9507956. [DOI] [PubMed] [Google Scholar]
- 29.Cornish TJ, Cotter RJ. A curved-field reflectron for improved energy focusing of product ions in time-of-flight mass spectrometry. Rapid Commun. Mass Spectrom. 1993;7:1037–1040. doi: 10.1002/rcm.1290071114. [DOI] [PubMed] [Google Scholar]
- 30.Cotter RJ, Gardner B, Iltchenko S, English RD. Tandem Time-of-Flight Mass Spectrometry with a Curved Field Reflectron. Anal. Chem. 2004;76:1976–1981. doi: 10.1021/ac0349431. [DOI] [PubMed] [Google Scholar]
- 31.Garcia BA, Barber CM, Hake SB, Ptak C, Turner FB, Busby SA, Shabanowitz J, Moran RG, Allis CD, Hunt DF. Modifications of human histone H3 variants during mitosis. Biochemistry. 2005;44:3202–3213. doi: 10.1021/bi050906n. [DOI] [PubMed] [Google Scholar]
- 32.Sarg B, Helliger W, Talasz H, Koutzamani E, Lindner H. Histone H4 Hyperacetylation Precludes Histone H4 Lysine 20 Trimethylation. J. Biol. Chem. 2004;279:53458–53464. doi: 10.1074/jbc.M409099200. [DOI] [PubMed] [Google Scholar]
- 33.Suka N, Suka Y, Carmen A, Wu J, Grunstein M. Highly Specific Antibodies Determine Histone Acetylation Site Usage in Yeast Heterochromatin and Euchromatin. Mol. Cell. 2004;8(2):473–479. doi: 10.1016/s1097-2765(01)00301-x. [DOI] [PubMed] [Google Scholar]
- 34.Zhang J, Sprung R, Pei J, Tan X, Kim S, Zhu H, Liu CF, Grishin NV, Zhao Y. Lysine acetylation is a highly abundant and evolutionarily conserved modification in Escherichia coli. Mol. Cell. Proteomics. 2009;8(2):215–225. doi: 10.1074/mcp.M800187-MCP200. [DOI] [PMC free article] [PubMed] [Google Scholar]
- 35.Schwer B, Bunkenborg J, Verdin RO, Andersen JS, Verdin E. Reversible lysine acetylation controls the activity of the mitochondrial enzyme acetyl-CoA synthetase 2. Proc Natl Acad Sci U S A. 2006;103(27):10224–10229. doi: 10.1073/pnas.0603968103. [DOI] [PMC free article] [PubMed] [Google Scholar]
- 36.Li M, Jiang L, Kelleher NL. Global histone profiling by LC-FTMS after inhibition and knockdown of deacetylases in human cells. J. Chromatog. B. 2009;877:3885–3892. doi: 10.1016/j.jchromb.2009.09.042. [DOI] [PMC free article] [PubMed] [Google Scholar]
- 37.Xhemalce B, Miller KM, Driscoll R, Masumoto H, Jackson SP, Kouzarides T, Verreault A, Arcangioli B. Regulation of histone H3 lysine 56 acetylation in Schizosaccharomyces pombe. J. Biol. Chem. 2007;282:15040–15047. doi: 10.1074/jbc.M701197200. [DOI] [PubMed] [Google Scholar]
- 38.Tang Y, Holbert MA, Wurtele H, Meeth K, Rocha W, Gharib M, Jiang E, Thibault P, Verreault A, Cole PA, Marmorstein R. Fungal Rtt109 histone acetyltransferase is an unexpected structural homolog of p300/CBP. Nat. Struct. Mol. Biol. 2008;15:738–745. doi: 10.1038/nsmb.1448. [DOI] [PMC free article] [PubMed] [Google Scholar]
- 39.Sweet SM, Li M, Thomas PM, Durbin KR, Kelleher NL. Kinetics of re-establishing H3K79 methylation marks in global human chromatin. J. Biol. Chem. 2010;285(43):32778–23786. doi: 10.1074/jbc.M110.145094. [DOI] [PMC free article] [PubMed] [Google Scholar]
Associated Data
This section collects any data citations, data availability statements, or supplementary materials included in this article.


