

Abstract
The authors examined the stability of schizotypal (STPD), borderline (BPD), avoidant (AVPD) and obsessive– compulsive (OCPD) personality disorders (PDs) over 2 years of prospective multiwave follow-up. Six hundred thirty-three participants recruited at 4 collaborating sites who met criteria for 1 or more of the 4 PDs or for major depressive disorder (MDD) without PD were assessed with semistructured interviews at baseline, 6, 12, and 24 months. Lifetable survival analyses revealed that the PD groups had slower time to remission than the MDD group. Categorically, PD remission rates range from 50% (AVPD) to 61% (STPD) for dropping below diagnostic threshold on a blind 24-month reassessment but range from 23% (STPD) to 38% (OCPD) for a more stringent definition of improvement. Dimensionally, these findings suggest that PDs may be characterized by maladaptive trait constellations that are stable in their structure (individual differences) but can change in severity or expression over time.
Personality disorders (PDs) are defined in the Diagnostic and Statistical Manual of Mental Disorders (4th ed.; DSM–IV; American Psychiatric Association, 1994) as enduring patterns of maladaptive traits and behaviors that are stable over time. Although temporal stability is central to these diagnostic constructs, reviews of the available empirical data suggest that, overall, PDs demonstrate only moderate stability and they can improve over time (Grilo & McGlashan, 1999; Grilo, McGlashan, & Oldham, 1998; McDavid & Pilkonis, 1996). The literature, however, is characterized by marked variability. One review (McDavid & Pilkonis, 1996), for example, found that 25%–78% of the participants in 11 identified studies retained their PD diagnosis at follow-up. Methodological limitations (including the absence of standardized diagnostic interviews, unreliability and error inherent in assessments, limited sample sizes, absence of comparison Axis I or PD groups, high attrition rates, reliance on only two assessment points, and varied follow-up periods) characterize many of the existing studies and make it difficult to draw clear conclusions (Grilo & McGlashan, 1999; Grilo et al., 1998).
In addition to the methodological limitations, it is also important to acknowledge certain conceptual limitations inherent in categorical models of PDs (Grilo et al., 1998; Oldham & Skodol, 2000). Particularly noteworthy is the application of relatively arbitrary thresholds for diagnosis, which would imply that PDs are either present or not. The central issue of temporal stability might perhaps better be considered within a more general framework that posits that, even if a PD were stable, it would be expected to show some variability over time in its expression due to differential circumstances, triggers, or opportunities for demonstrating symptoms. For example, whether a person is in a relationship, has experienced a loss, is involved in a collaborative work project, or has ready access to substances represents selected scenarios that might provide differential opportunities to heighten or express patterns and symptoms of PDs. These issues dictate the need for prospective studies with repeated assessments over time.
The Collaborative Longitudinal Personality Disorders Study (CLPS) is a prospective, repeated-measures study (Gunderson et al., 2000; McGlashan et al., 2000) designed to examine the course and outcome of patients meeting DSM–IV criteria for one of four PDs: schizotypal (STPD), borderline (BPD), avoidant (AVPD), and obsessive– compulsive (OCPD). CLPS includes a comparison group of patients with major depressive disorder (MDD) without any PD, selected because its episodic course is thought to distinguish Axis I from Axis II disorders, and because its course has been carefully studied (Solomon et al., 1997). One of the primary goals of the CLPS is to examine the validity of the definition of PDs as enduring and stable. In our initial analysis of short-term stability (Shea et al., 2002), using data from the 1st year of prospective follow-up (assessed at baseline, 6-, and 12-month time points), we reported: (a) the majority of participants with PDs did not consistently remain at or above DSM–IV diagnostic thresholds, although significantly more participants in the four PD groups remained at diagnostic thresholds compared with those in the MDD comparison group, (b) the mean number of criteria met decreased significantly for each of the PD groups, and (c) the number of criteria met was significantly and highly correlated across the three assessment points. Although these findings raise questions regarding the validity of categorical definitions (Oldham & Skodol, 2000), they suggest that individual differences in PD features are highly stable over time even though the number of criteria present decreases. They extend findings previously reported for a nonclinical study group of 250 college students (Lenzenweger, 1999) also assessed in a multiwave design with diagnostic interviews.
The present study prospectively examined the stability and outcome of the four PDs over a 24-month follow-up period with four assessments (baseline, 6, 12, and 24 months). The present study, which considers both categorical and dimensional approaches to PD stability, extends our initial 12-month report (Shea et al., 2002) to 24 months and considers several additional questions as outlined in the subsequent paragraphs. These questions follow directly from the view that it is important to (a) move beyond current relatively arbitrary thresholds for diagnosis in our classification system, (b) consider both dimensional and categorical approaches, (c) consider possible fluctuations over time, and (d) rigorously consider the potential impact of unreliability in assessment methods on presumed changes in PD psychopathology.
We report here, to our knowledge for the first time, the 24-month stability of the PD diagnoses on the basis of a separate, independent (blinded) assessment. Our previous report (Shea et al., 2002) used nonblinded assessments of PD stability. In this analysis, we examined PD stability at the threshold required for diagnosis.
We extend our initial report (Shea et al., 2002) by (a) considering different concepts or working definitions of remission and (b) applying lifetable survival methods (Kalbfleisch & Prentice, 1980) to analyze time to remission during the 24-month time frame. Previously (Shea et al., 2002), we compared proportions of study groups (four PD groups and the MDD group) who stayed above DSM–IV diagnostic thresholds—arbitrarily chosen levels that may or may not have clinical significance. In those analyses, a participant with one criterion less than what is required for DSM–IV diagnosis was classified as not remaining above threshold for diagnosis. This approach did not address whether the courses of the PDs differ in clinically meaningful ways. Longitudinal research with depression, for example, has revealed that subthresh-old depression is significant clinically because of its chronic course and high levels of associated impairment (Judd et al., 1998; Judd, Akiskal, et al., 2000; Judd, Paulus, et al., 2000). In the present study, we applied lifetable survival methods to optimize the strengths of our repeated prospective assessments (i.e., use length of episode data) and compared the four PD groups and the MDD group following the conventions for remission established by the National Institute of Health–Collaborative Depression Study (NIMH-CDS) (Katz, Secunda, Hirschfeld, & Koslow, 1979; Keller, Shapiro, Lavori, & Wolfe, 1982; Solomon et al., 1997). We compared the NIMH-CDS (Keller et al., 1982) definitions of remission (8 consecutive weeks with no more than minimal symptoms) with an alternative and more stringent definition of 12 consecutive months. This alternative, although also arbitrary, was selected to address the issue of whether persons with apparent remissions actually sustain the symptomatic improvement for some reasonable length of time (i.e., the symptoms do not simply return 1 or 2 months later).
In addition, in the present study, the stability of four PD groups was examined in terms of individual differences and mean levels for PD criteria. Our analyses focused on the mean proportion of criteria met, were restricted only to those participants with PDs, and included an additional 12 months of prospective follow-up beyond the earlier report.
Method
Participants
The overall aims, design, methods, and sample characteristics of the present study are detailed elsewhere (Gunderson et al., 2000; McGlashan et al., 2000). Recruitment was intended to obtain a diverse and clinically representative sample, and the majority of participants were patients recruited from diverse in- and outpatient clinical programs at each of the four CLPS recruitment sites. In addition, advertising was used to recruit participants with current or past psychiatric treatment. Of the 1,605 potential participants screened (described later), 668 (42%) were eligible and enrolled in the study. Of the 668 participants, 573 met criteria for a PD study group, and 95 met criteria for the MDD group, following the assessment procedures described later. The current report was based on 633 of the 668 participants (95%) for whom at least 6 months of follow-up data were available. Of the 633 participants, 544 met criteria for one of the four PD groups, and 89 met criteria for the MDD group. For selected analyses (detailed later) of PDs, this report was based on data from 499 participants with PDs (87.1% of participants with PDs at baseline) for whom complete data through the 24-month follow-up were available. Participants in this study for whom follow-up data were available did not differ from those who were not followed in age, gender, ethnicity, or study-group assignment.
Of the 633 participants in the present study, 403 (63.7%) were women and 230 (36.3%) were men. The majority of participants were Caucasian (n = 485, 76.6%); 77 (12.1%) were African American, 53 (8.4%) were Hispanic American, and 18 (2.7%) were of other ethnicity. The mean age of participants was 32.8 (SD = 8.1) years. The mean Global Assessment of Functioning (American Psychiatric Association, 1994) at baseline for the past month was 58.2 (SD = 11.2). As detailed elsewhere (McGlashan et al., 2000), co-occurring Axis I and Axis II diagnoses were common. The mean number of Axis I disorders for participants was 3.5 (SD = 1.7, range: 0 –9). The number of Axis I disorders considered included the major diagnostic categories assessed on the Structured Clinical Interview for DSM–IV Axis I Disorders—Patient Version (SCID–I/P; First, Spitzer, Gibbon, & Williams, 1996), with the exception of psychotic disorders. Except for collapsing multiple substance-use disorders (if present) into one category, we followed the rules for assigning and counting diagnoses. Among the participants with PDs, the mean number of PD diagnoses was 2.4 (SD = 1.6) of the possible total of 12 (10 formal diagnoses and 2 research diagnoses) listed in the DSM–IV.
Procedures
All participants signed written informed consents following a full description of study procedures. The study protocol was approved at each collaborating site’s institutional review board. Participants were inter-viewed in person by experienced research interviewers from mental health disciplines. Interviewers underwent extensive standardized training to achieve reliability in the use of the diagnostic measures for Axis I and Axis II disorders (Zanarini et al., 2000). Interviewers were monitored and received regular ongoing supervision by the investigators at each site, as well as regular supervision across sites to maintain reliability and prevent drift over time.
Baseline Assessments
Potential participants were screened for possible PDs with the Personality Screening Questionnaire (PSQ), a self-report instrument consisting of all items for the four study PDs taken from the Personality Diagnostic Questionnaire (Hyler, Skodol, Kellman, Oldham, & Rosnick, 1990). Participants positive on the PSQ for one or more of the PDs received further assessment. Participants were also screened for the possible presence of current MDD with a self-report instrument (Depression Screening Questionnaire) that consisted of items based on DSM–IV diagnostic criteria. Participants who screened positive on the Depression Screening Questionnaire and who had no PD on the PSQ received further assessment for the MDD study group.
Interviewers administered the SCID–I/P (First et al., 1996) to assess Axis I psychiatric disorders and the Diagnostic Interview for DSM–IV Personality Disorders (DIPD–IV; Zanarini, Frankenburg, Sickel, & Yong, 1996) to assess all Axis II PDs. Convergent support for the DIPD–IV diagnosis by either the Schedule for Nonadaptive and Adaptive Personality (Clark, 1993) or from an independent clinician-rated Personality Assessment Form (Shea, Glass, Pilkonis, Watkins, & Docherty, 1987) was required. If more than one study PD was present, a primary PD study group was assigned following an a priori algorithm (Gunderson et al., 2000).
Follow-Up Assessments
Participants were interviewed at 6, 12, and 24 months following the baseline assessment. The 24-month assessment included a separate, independent administration of the DIPD–IV to assess all PDs. This DIPD–IV was administered by an interviewer who was blinded to baseline and interim assessments. This independent and blinded assessment allowed for calculating the 24-month temporal stability for the PDs at the threshold for diagnosis.
The courses of the four study PDs were also assessed using a modified version of the DIPD–IV: the DIPD Follow-Along Version (DIPD–FAV). The Longitudinal Follow-Up Evaluation (LIFE; Keller et al., 1987) was used to assess the course of Axis I disorders, psychosocial functioning, and treatment use. These interviews were not blinded and were conducted by the same (baseline) interviewer whenever possible.
Measures
SCID–I/P
The SCID–I/P (First et al., 1996) is a widely used diagnostic interview to assess current and lifetime Axis I psychiatric disorders. In this study, kappa coefficients (Cohen, 1960) for interrater reliability (based on 84 pairs of raters independently rating 27 videotaped assessments) for Axis I diagnoses ranged from .57 to 1.0 (Zanarini et al., 2000); kappa for MDD was .80.
DIPD–IV
The DIPD–IV (Zanarini et al., 1996) is a semistructured interview for assessment of all DSM–IV Axis II PDs. Each of the criteria for all diagnoses is assessed with one or more questions, which are then rated on a 3-point scale (0 = not present, 1 = present but of uncertain clinical significance, 2 = present and clinically significant). The time frame covered is the prior 2 years, but traits or behaviors must be characteristic of the person for most of his or her adult life to be counted toward a diagnosis.
Interrater reliability (based on 84 pairs of raters independently rating 27 videotaped assessments) kappa (Cohen, 1960) coefficients for the four study PDs ranged from .68 (BPD) to .73 (AVPD). Test–retest kappas (based on two direct interviews of 52 participants performed 7–10 days apart with the second rater blinded to the first interview) ranged from .69 (BPD) to .74 (OCPD). Median reliability (intraclass) correlations for criteria scores ranged from .79 to .91 (interrater) and from .65 to .84 (test–retest) for the four PDs (Zanarini et al., 2000).
A longitudinal reliability study was also performed to determine whether interviewers in later parts of this ongoing longitudinal study were conducting interviews in a manner consistent with those research interviewers who conducted interviews during the first 2 years of the study. Percentage agreement for the four study PDs for raters after December 1997 ranged from 83% (AVPD) to 97% (STPD), which was comparable with the findings for the initial cohort of interviewers. An important finding was that percentage of agreement between the later cohort and the earlier cohort of interviewers (based on current interviewers’ ratings of initial interviewers’ videotapes) ranged from 76% (OCPD) to 88% (BPD and AVPD). These results suggest that rater drift did not occur.
DIPD–FAV
To assess the longitudinal course of the study PDs, we modified the DIPD–IV to record the presence of traits or behaviors indicative of each criterion for the four PDs for each month of the follow-up interval. Interviewers asked standard DIPD–IV probes for the presence of each criterion; if present at all during the interval, participants were then asked about any change over the interval to determine whether or when the criterion was absent. Ratings were then made for each month of the interval for each criterion with the 3-point scale.
An additional reliability study was conducted to estimate the reliability of retrospective reporting by month on the DIPD–FAV. At 12 months, interviewers assessed and rated Month 6 in addition to Months 7–12. Hence, Month 6 was rated twice, first at the 6-month interview and then again 6 months later at the 12-month interview. On the basis of 453 cases with overlap data, kappa (Cohen, 1960) coefficients for diagnoses at the two times were as follows: .78 (STPD), .70 (BPD), .73 (AVPD), and .68 (OCPD).
LIFE
The LIFE (Keller et al., 1987) is a semistructured interview rating system with demonstrated reliability and validity (Warshaw, Keller, & Stout, 1994) for assessing the longitudinal course of psychiatric disorders, psychosocial functioning, and all forms of treatment received. In the LIFE, the severity of psychopathology is quantified by weekly psychiatric status ratings (PSRs), which are made for each Axis I disorder present. For MDD, PSRs are based on a 6-point scale ranging from 1 (no symptoms) to 6 (full disorder criteria plus extreme impairment). These PSR conventions follow those used in studies of Axis I disorders, including the NIMH-CDS (Keller et al., 1982; Solomon et al., 1997).
The LIFE assesses mental health treatment use by obtaining detailed ratings of pharmacological and psychosocial treatments for all mental health contacts, frequency of sessions, length of treatment, and number of days of inpatient and partial hospitalization. Medication usage and dosing were recorded on a weekly basis. A global measure of treatment intensity was developed, with weights assigned to levels of care (inpatient, day hospital, or outpatient); these weights were multiplied by the amount of treatment received at each level during the follow-up.
Data Analyses
PD stability at diagnostic threshold based on 24-month blinded assessment
We examined agreement between the baseline DIPD–IV and the independent (blinded) DIPD–IV administered at 24 months. Percentage of participants who retained their PD diagnoses at the 24-month readministration as well as kappa (Cohen, 1960) coefficients were computed.
Remission status based on 24-month prospective follow-along assessments
We examined remission rates for the four PDs compared with the MDD group. We hypothesized that the PD groups would have lower (longer time to) remission than the MDD group. We compared remission from MDD (based on the widely used definition; Frank et al., 1991; Keller et al., 1982; Solomon et al., 1997) of 8 consecutive weeks with PSR ratings on the LIFE no higher than two (reflecting minimal or no symptoms) with those for the PD groups (based on a parallel definition of 2 consecutive months with two or fewer criteria as assessed on the DIPD–FAV).
We then compared two different definitions of PD remission (i.e., either 2 consecutive months or 12 consecutive months with two or fewer criteria as assessed on the DIPD–FAV). We chose also to consider a stringent 12-month definition because a brief duration of remission might not persist and therefore might not represent a clinically significant change in personality psychopathology. Thus, the 12-month definition allows for testing a much more stringent working definition of remission.
Lifetable survival methods (Kalbfleisch & Prentice, 1980) were used to analyze time to remission (with both 2- and 12-month definitions) during the 24-month follow-up period. These methods have been found to be well suited for analyzing longitudinal data for medical illnesses (Berkson & Gage, 1950) and have been applied to psychiatric problems (Keller et al., 1982; Warshaw et al., 1994). It is worth noting, however, that unlike some nonreversible medical outcomes such as death, falling below a definition for remission for a PD does not preclude it reappearing at a later point in time. In the present study, this represents our rationale for considering a more stringent 12-month definition of remission as noted earlier. These analyses considered data from all 633 participants for whom some follow-up data were available following established methods (Kaplan & Meier, 1958) to estimate cumulative remission rates.
Dimensional Stability
A dimensional approach to PD stability was used to complement and extend the categorical approaches mentioned earlier (Lenzenweger, 1999; Oldham & Skodol, 2000). These analyses considered data from 499 participants with PDs (87.1% of participants with PDs at baseline) for whom complete data through 24-months of follow-up were obtained. Changes in mean number of PD criteria from baseline to Months 6, 12, and 24 were examined for each PD group. Because the PDs require varying number of criteria for diagnosis, we considered this in terms of mean proportion of criteria. The proportion of criteria at baseline was based on the DIPD–IV; for the 6-, 12-, and 24-month assessments, the proportion of criteria was based on ratings for the immediately preceding month on the DIPD–FAV. The mean proportion of criteria is an indicator of the extent to which the participants with PDs on average retain the same level of PD pathology.
Pearson correlation coefficients were used to examine the proportion of criteria met at each of the four time points for each of the four PDs across all participants. The correlations provide a measure of relative stability (i.e., the extent to which individuals retain their relative position within the group in the type and level of personality features).
Repeated measures analysis of variance (ANOVA) with the General Linear Model procedure was used to examine the stability of the mean level of proportion of criteria met. The model included four levels of time (baseline, 6, 12, and 24 months). Terms for the interaction of time with study site, as well as five variables that showed significant differences among the PD groups in our earlier 12-month analyses (Shea et al., 2002), were also included in the model. The five variables were gender, race, number of Axis I diagnoses, number of Axis II PD diagnoses, and treatment use intensity (see the following subsection) over the 24 months of follow-up.
Treatment Effects
Consideration and adjustment for treatment effects in naturalistic studies is complex and limits any inferences that can be drawn. For example, it is known that those patients with the most severe problems tend to receive the most treatment (Cochran, 1983). Indeed, we found this to be the case for CLPS at baseline (Bender et al., 2001). Nonetheless, we explored whether the PD stability findings could have been confounded by differences in amount of treatment received. The global measure of treatment intensity score calculated at each follow-up (from the LIFE) was included as an interaction term in the repeated measures ANOVA, as described earlier, to test for possible influences of amount of treatment received on stability.
A subsequent repeated measures ANOVA was conducted to test for differences among PD groups in criteria over follow-up. Proportion of criteria met was used as the dependent variable in this analysis. The model included the same set of interaction terms as the within-groups analyses described earlier.
Results
PD Stability at Diagnostic Threshold Based on 24-Month Blinded Assessment
The 24-month (independent and blinded) administration of the DIPD–IV was compared with the findings from the baseline DIPD–IV administration. Kappa coefficients (Cohen, 1960) were performed for all 499 participants with PDs for the four PD diagnoses. The overall stability findings were as follows for the four PDs: κ = .47 for STPD, κ = .40 for BPD, κ = .37 for AVPD, and κ = .35 for OCPD (all ps < .0001). To consider the potential impact of rater unreliability on these stability findings at diagnostic threshold, we adjusted the kappa coefficients using interreliability kappas. The adjusted kappas were as follows for the four PDs: κ = .56 for STPD, κ = .50 for BPD, κ = .53 for AVPD, and κ = .51 for OCPD (all ps < .0001).
We also examined the number and percentage of participants who retained their baseline PD diagnosis at 24-month follow-up. Those results were as follows: STPD, 30 of 78 (39%); BPD, 67 of 154 (44%); AVPD, 65 of 131 (50%); and OCPD, 54 of 136 (40%). Thus, almost one half of participants retained their PD diagnosis at 24 months on the basis of the DIPD–IV test–retest. Put differently, rates for falling below DSM–IV diagnostic thresholds, which provide a context for the remission rates (survival analyses) based on the prospective DIPD–FAV data, ranged from 50% (AVPD) to 61% (STPD).
PD Versus MDD Remission Rates (Prospective Follow-Along Assessments)
Figure 1 shows the survival curves (time to remission) for the four PD groups and for the MDD comparison group. These remission rates were calculated on the basis of parallel definitions of 2 consecutive months with minimal symptoms (PSRs < 2 on the LIFE for MDD and DIPD–FAV findings of two or fewer PD criteria for the specific PDs). The MDD group had significantly higher (shorter time to) remission rate than the PD groups (collapsed together), log-rank χ2(1, N = 633) = 105.43, p = .001.
Figure 1.
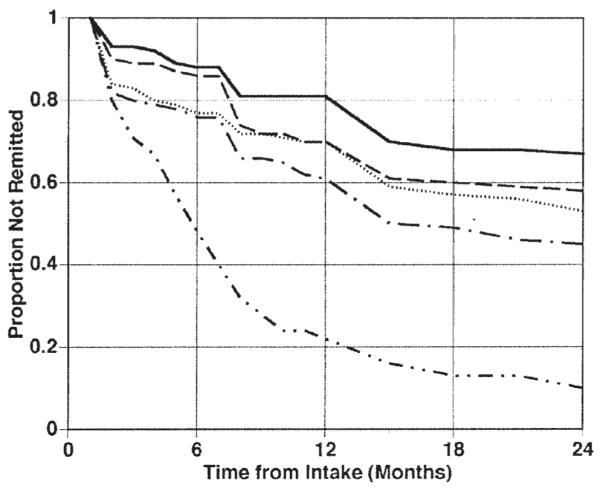
Time to remission with a 2-month criterion. Solid line = schizotypal personality disorder; dashed line = borderline personality disorder; dotted line = avoidant personality disorder; dashed line with one-dot intervals = obsessive– compulsive personality disorder; dashed line with two-dot intervals = major depressive disorder.
PD Remission Rates (Prospective Follow-Along Assessments)
Figures 1 and 2 show the survival curves (time to remission) over the 24-month follow-up period for the four PD groups with the 2- and 12-month definitions (duration at two or fewer criteria), respectively.
Figure 2.

Time to remission with a 12-month criterion. Solid line = schizotypal personality disorder; dashed line = borderline personality disorder; dotted line = avoidant personality disorder; dashed line with one-dot intervals = obsessive– compulsive personality disorder.
As shown in Figure 1, if a 2-month definition is used, remission rates for the PD groups were as follows: 33% (STPD), 42% (BPD), 47% (AVPD), and 55% (OCPD). Omnibus chi-square analysis revealed overall that the four PD groups differed significantly with the 2-month definition, log-rank χ2(3, N = 633) = 12.21, p = .0067. We performed six post hoc comparisons to determine which PD groups differed. Given the multiple comparisons, we (Bonferroni) adjusted the significance level to p < .008. STPD had a significantly lower remission rate than the OCPD group, log-rank χ2(1, N = 232) = 10.71, p = .001. We also noted two other trends that only approached significance given the adjustment for multiple comparisons. STPD had lower remission than AVPD, log-rank χ2(1, N = 236) = 4.29, p = .038, and BPD had lower remission than OCPD, log-rank χ2(1, N = 308) = 5.55, p = .019.
As shown in Figure 2, if a 12-month definition is used, remission rates for the PD groups were as follows: 23% (STPD), 28% (BPD), 31% (AVPD), and 38% (OCPD). Omnibus chi-square analysis revealed overall that the four PD groups did not differ significantly with the 12-month definition, log-rank χ2(3, N = 544) = 6.64, p = .084.
Impact of Diagnostic Reliability on Diagnostic Remission Rates
To assess the potential impact of unreliability on the observed diagnostic remission rates, we used our test–retest data on criterion counts published in Zanarini et al. (2000). These reliability data can be used to estimate the number of criteria that would be observed in a subsequent interview given the number of criteria observed at baseline. The test–retest reliability coefficients for the PD criterion counts (on the DIPD–IV) were used as a beta coefficient in a standardized regression to provide a predicted (i.e., reliability-adjusted) criterion score count for the follow-up assessments. These reliability-adjusted criterion counts were retransformed into raw criterion counts to allow prediction of the presence or absence of diagnosis. The predicted number of criteria at retest were as follows: 3.53 (STPD), 4.40 (BPD), 4.00 (AVPD), and 3.65 (OCPD). Thus, these analyses revealed that the mean expected number of criteria is lower but in general not low enough to bring participants below the stringent definition of two or fewer criteria needed for remission. Indeed, the predicted proportions of remissions based on these reliability-corrected criteria counts were as follows: .006 (STPD), .003 (BPD), .035 (AVPD), and .020 (OCPD).
Dimensional Stability: Proportion of PD Criteria
Table 1 shows the mean proportion of criteria met by PD group for each of the four assessment points over the 24-month followup. Repeated measures ANOVAs revealed a significant effect for time across the four PD groups, F(3, 478) = 13.53, p = .0001, reflecting significant decreases over time for all PD groups in the mean proportion of criteria met. Decreases in proportion of criteria met across time did not differ among the PD cells, F(9, 478) = 1.29, p = .24.
Table 1.
Proportion of Criteria Met by Personality Disorder Group and Time
| STPDa (n = 78) |
BPDb (n = 154) |
AVPDc (n = 131) |
OCPDd (n = 136) |
|||||
|---|---|---|---|---|---|---|---|---|
| Time | M | SD | M | SD | M | SD | M | SD |
| T1 | .64 | .11 | .76 | .15 | .77 | .16 | .65 | .14 |
| T2 | .53 | .21 | .54 | .25 | .61 | .30 | .50 | .25 |
| T3 | .46 | .22 | .46 | .26 | .58 | .32 | .43 | .22 |
| T4 | .39 | .23 | .43 | .28 | .48 | .32 | .36 | .24 |
Note. F, df, and p values are for main effects of time from repeated measures analysis of variance. STPD = schizotypal personality disorder; BPD = borderline personality disorder; AVPD = avoidant personality disorder; OCPD = obsessive– compulsive personality disorder; T1 = baseline assessment; T2 = 6-month assessment; T3 = 12-month assessment; T4 = 24-month assessment.
F(3, 231) = 6.01, p < .0006.
F(3, 459) = 7.83, p < .0001.
F(3, 390) = 12.00, p < .0001.
F(3, 405) = 16.78, p < .0001.
Repeated measures multivariate analyses of variance revealed no significant main effects for gender, ethnicity, or treatment intensity; number of Axis I and Axis II disorders were significant predictors (as the number of diagnoses increased, the proportion of PD criteria for the four PD groups retained over time also increased). Tests for within-subjects effects revealed only a Time × Number of Axis II PD Diagnoses interaction, F(3, 478) = 11.43, p = .0001. Decreases in the proportion of criteria met during the first 12 months were greatest for those participants with more PD diagnoses, but the differences were no longer significant after 12 months. Analysis of covariance did not reveal any significant effects for the following covariate interactions: Time × PD Group, Time × Recruitment Site, Time × Gender, Time × Ethnicity, Time × Number of Axis I Diagnoses, or Time × Treatment Intensity.
Dimensional Stability: Individual Differences in Rank Over Time
Table 2 shows the correlation coefficients for proportion of criteria met over the four assessment points for all participants. The correlations were uniformly large and significant ( p < .0001) across all four time points and for each of the PD criteria sets. The correlation coefficients were highest for the baseline to 6-month assessments, ranging from .70 (OCPD) to .82 (STPD). The correlation coefficients dropped somewhat but remained significant ( p < .0001) for the longest time period (baseline to 24 months), ranging from .53 (OCPD) to .67 (STPD).
Table 2.
Stability Correlations for Proportion of Criteria Met by All Patients (N = 499)
| Assessment points | ||||||
|---|---|---|---|---|---|---|
| Group | T1–T2 | T1–T3 | T1–T4 | T2–T3 | T2–T4 | T3–T4 |
| STPD | .82 | .74 | .67 | .84 | .75 | .78 |
| BPD | .72 | .62 | .57 | .77 | .64 | .67 |
| AVPD | .69 | .66 | .58 | .80 | .66 | .70 |
| OCPD | .70 | .67 | .53 | .79 | .58 | .63 |
Note. The stability correlations used were Pearson correlation coefficients. Correlations were based on all patients (N = 499). All correlations are significant at p < .0001. T1 = baseline assessment; T2 = 6-month assessment; T3 = 12-month assessment; T4 = 24-month assessment; STPD = schizotypal personality disorder; BPD = borderline personality disorder; AVPD = avoidant personality disorder; OCPD = obsessive–compulsive personality disorder.
Discussion
The present study examined different concepts of categorical and dimensional stability of four PDs over 24 months with prospective data obtained in a multiwave design. The blinded repeated DIPD–IV assessment conducted 24 months after baseline revealed remission rates (based on DSM–IV diagnostic thresholds—a less stringent definition than used in the survival analyses discussed later) ranging from 50% (AVPD) to 61% (STPD). Lifetable survival analyses with prospective data revealed that the PD groups had significantly lower remission rates than the MDD comparison group. Although characterized by greater categorical stability than MDD, a substantial proportion of participants with PDs had remissions during the 24 months of follow-up. If a 2-month definition (2 months with two or fewer criteria) is used, remission rates range from 33% (STPD) to 55% (OCPD). Applying a much more stringent definition of 12 consecutive months with two or fewer criteria reveals lower remission rates, ranging from 23% (STPD) to 38% (OCPD). Collectively, these findings suggest that for these four PDs, substantial improvements in symptomatology are not uncommon (i.e., 23%–38% of patients) even when a stringent definition is used.
In terms of clinical entities, comparison of our temporal stability findings against previous studies of the longitudinal diagnostic stability of PD is difficult because of the inherent limitations of much of the literature (Grilo & McGlashan, 1999; Grilo et al., 1998; McDavid & Pilkonis, 1996) and the lack of comparable studies with sufficient numbers of different PD diagnoses prospectively assessed with standardized instrumentation at repeated time points. A global comparison of our temporal stability findings (at threshold for diagnosis) is possible for BPD (several studies reviewed by McDavid & Pilkonis, 1996; Zanarini, Frankenburg, Hennen, & Silk, 2003) and for one study of AVPD (Ferro, Klein, Schwartz, Kasch, & Leader, 1998). For AVPD, our kappa of .37 for the 2-year follow-up is higher than that reported in a 30-month follow-up study (κ = .24; Ferro et al., 1998) of 108 depressed outpatients (of which n = 13 met AVPD criteria). For BPD, a general comparison revealed similar rates of stability despite the varied follow-up intervals. One review (McDavid & Pilkonis, 1996) reported the mean percentage of diagnostic stability for BPD across 10 studies as 57%, and Zanarini et al. (2003) recently reported 64.5% stability for BPD at 24 months. We found that 44% (67 of 154 cases) of the BPD group was reassigned the BPD diagnosis at the 24-month blinded readministration of the DIPD– IV. This approach to stability (comparing two retrospective assessments at two different time points 24 months apart) compares the proportion of cases above and below DSM–IV threshold for diagnosis. Our lifetable survival analyses with prospective data revealed that 58% remained BPD according to the 2-month definition of remission, and 72% remained BPD according to the 12-month definition of remission. These later two definitions represent more stringent thresholds and may reflect a more meaningful change in clinical status.
When stability was considered dimensionally, we observed a significant decrease in the mean proportion of criteria met in each of the PD groups suggesting decreases in severity over time. In contrast, when the relative stability of individual differences was examined, we found a high level of consistency. Collectively, these findings suggest that although individuals are quite consistent in terms of their rank order of PD criteria (individual differences in PD features are stable), they may fluctuate in the severity or amount of PD features over time. These findings are consistent with those reported by Lenzenweger (1999), which were also based on a multiwave methodology for a nonclinical sample of college students.
Relatively few differences were observed among the four study PDs in terms of their stability. Again, here the nature of the differences seemed to vary by how stability was considered. Life-table analyses with the 2-month definition of remission, but not the 12-month definition, revealed some variability between the PD groups. With the 2-month definition, STPD had a significantly lower remission rate than OCPD. Trends existed for STPD to have lower remission than AVPD and for BPD to have lower remission than OCPD. It is possible that these few observed differences for STPD might result, in part, from the methods of carrying forward the admixture of observational and symptomatic criteria in the lifetable analyses. When considered dimensionally in terms of the proportion of criteria met over time, the four PD groups differed overall, with the AVPD and BPD groups retaining significantly higher proportions of criteria met than the STPD and OCPD groups. However, inspection of the correlations (which showed that individual differences in PD features are stable) revealed little variability between PDs.
These findings suggest that PDs may be characterized by maladaptive trait constellations that are stable in their structure but that can change in severity or expression over time. Indeed, our correlational coefficients for proportion of criteria met (reflecting rank order stability) are similar to the range (.61–.70) for total number of PD criteria reported by Lenzenweger (1999) for college students and are comparable with those generally reported for normal personality trait dimensions (McCrae & Costa, 1990).
Significant decreases in mean counts observed over time are frequently observed in longitudinal studies. This is a complex issue and might reflect, in part, numerous clinical and methodological issues. One possible interpretation is that some of these changes simply reflect regression to the mean (Nesselroade, Stigler, & Baltes, 1980). Two findings are relevant to this issue. First, our analyses with reliability-adjusted criterion counts revealed that the mean expected number of criteria for follow-up assessments, although lower, was not low enough to bring participants below the threshold of two criteria needed to achieve remission. Indeed, a very small proportion of the remissions defined as two or fewer criteria present could be accounted for on the basis of unreliability alone. Second, although the greatest drop in mean scores was observed from the baseline to the 6-month time point, inspection of the mean changes in criterion counts across the repeated time points in this multiwave design (Nesselroade et al., 1980), that is, from the 6- to 12-month and the 12- to 24-month assessments, revealed further drops. Of course, in such longitudinal studies with repeated assessments it is certainly possible that reduced responsiveness to interviews over time can result in reduced reports of symptoms.
Another issue that concerns naturalistic studies of patients is the potential for confounding by treatment. Differences in treatment histories previously reported (Bender et al., 2001) for the PD groups (BPD and STPD groups had greater treatment use than did the AVPD and OCPD groups) are not associated with the categorical stability observed here. Moreover, in the present study, our analyses revealed no significant effects of treatment intensity on the (dimensional) stability of PD criteria. This is consistent with analyses suggesting that in naturalistic studies the amount of treatment received is driven by problem severity (Cochran, 1983).
We note several issues pertaining to generalizability. Our study focused on clinical entities or diagnoses and thus recruited patients and treatment-seeking participants. Although there exist inherent complexities in studying treatment-seeking patients (e.g., Berkson’s bias; Berkson, 1946), this represents to our knowledge the first prospective multiwave study of several PDs. A previous prospective multiwave study (Lenzenweger, 1999) could not evaluate categorical stability of PDs because of their low frequencies in the nonclinical sample. Our sampling across diverse clinical settings affiliated with universities in four northeastern urban settings produced a heterogeneous adult study group that approximated U.S. norms for ethnicity. Our recruitment targeted adults age 18 – 45 years. Findings may differ for younger (Grilo, Becker, Edell, & McGlashan, 2001) or older (Seivewright, Tyrer, & Johnson, 2002) patient groups, who may show different patterns of change over time.
This report provides support for the stability of general maladaptive personality trait constellations while highlighting that potentially meaningful clinical changes are possible and not uncommon in patients with PD. In this ongoing CLPS study, future analyses will attempt to examine important unresolved questions about the nature of PDs. Some of the complex patterns observed in this report may reflect, in part, the heterogeneity of the criteria sets both within and across PDs. For example, some criteria are clearly more trait-like, in contrast to others that are more behaviorally anchored (Sanislow & McGlashan, 1998). Hence, the meaning of stability may be different for the different types of criteria, highlighting the need for a clearer understanding and identification of the important symptom dimensions and personality traits that may underlie PDs (Shea, 1992). Moreover, it is important to recognize the possibility that even if it appears that a similar number of criteria are met at different time points, it is possible that these might be different criteria. Future studies will consider such issues by examining (a) the nature of stability and change of specific criteria, (b) their predictive validity (their diagnostic efficiency and associations with psychiatric disorders and with broader aspects of psychosocial functioning), and (c) different or alternative groupings of criteria. Studies will evaluate the prospective stability of various degrees of PD persistence and will also attempt to delineate factors that may predict stability or change, such as stressful life events and changes in Axis I psychopathology or social functioning (Grilo, McGlashan, & Skodol, 2000). Although this report considered several approaches to testing stability, we do not claim that the analyses presented here are exhaustive. Future waves of this ongoing prospective study will allow for consideration of different conceptual and statistical approaches to stability and change. Collectively, these empirical studies may inform the development and operationalization of optimal definitions for remission, recovery, and relapse for PDs that have facilitated research and clinical judgments in other areas (Frank et al., 1991).
Acknowledgments
This research was supported by National Institute of Mental Health Grants MH 50837, 50838, 50839, 50840, 50850, and K05 MH 01645.
References
- American Psychiatric Association . Diagnostic and statistical manual of mental disorders. 4th ed Author; Washington, DC: 1994. [Google Scholar]
- Bender DS, Dolan RT, Skodol AE, Sanislow AE, Dyck IR, McGlashan TH, et al. Treatment utilization by patients with personality disorders. American Journal of Psychiatry. 2001;158:295–302. doi: 10.1176/appi.ajp.158.2.295. [DOI] [PubMed] [Google Scholar]
- Berkson J. Limitations of the application of fourfold table analysis to hospital data. Biometrics. 1946;2:47–53. [PubMed] [Google Scholar]
- Berkson J, Gage RP. Calculation of survival curves for cancer. Mayo Clinic Proceedings. 1950;25:270–286. [PubMed] [Google Scholar]
- Clark LA. Schedule for Nonadaptive and Adaptive Personality (SNAP) University of Minnesota Press; Minneapolis: 1993. [Google Scholar]
- Cochran W. Planning and analysis of observational studies. Wiley; New York: 1983. [Google Scholar]
- Cohen J. A coefficient of agreement for nominal scales. Educational and Psychological Measurement. 1960;20:37–46. [Google Scholar]
- Ferro T, Klein DN, Schwartz JE, Kasch KL, Leader JB. 30-month stability of personality disorder diagnoses in depressed outpatients. American Journal of Psychiatry. 1998;155:653–659. doi: 10.1176/ajp.155.5.653. [DOI] [PubMed] [Google Scholar]
- First MB, Spitzer RL, Gibbon M, Williams JBW. Structured Clinical Interview for DSM–IV Axis I Disorders (SCID–I/P) Biometrics Research Department, New York State Psychiatric Institute; New York: 1996. [Google Scholar]
- Frank E, Prien RF, Jarrett RB, Keller MB, Kupfer DJ, Lavori PW, et al. Conceptualization and rationale for consensus definitions of terms in major depressive disorder. Archives of General Psychiatry. 1991;48:851–855. doi: 10.1001/archpsyc.1991.01810330075011. [DOI] [PubMed] [Google Scholar]
- Grilo CM, Becker DF, Edell WS, McGlashan TH. Stability and change of DSM–III–R personality disorder dimensions in adolescents followed up 2 years after psychiatric hospitalization. Comprehensive Psychiatry. 2001;42:364–368. doi: 10.1053/comp.2001.26274. [DOI] [PubMed] [Google Scholar]
- Grilo CM, McGlashan TH. Stability and course of personality disorders. Current Opinion in Psychiatry. 1999;12:157–162. [Google Scholar]
- Grilo CM, McGlashan TH, Oldham JM. Course and stability of personality disorders. Journal of Practical Psychiatry and Behavioral Health. 1998;4:61–75. [Google Scholar]
- Grilo CM, McGlashan TH, Skodol AE. Stability and course of personality disorders: The need to consider comorbidities and continuities between Axis I psychiatric disorders and Axis II personality disorders. Psychiatric Quarterly. 2000;71:291–307. doi: 10.1023/a:1004680122613. [DOI] [PubMed] [Google Scholar]
- Gunderson JG, Shea MT, Skodol AE, McGlashan TH, Morey LC, Stout RL, et al. The Collaborative Longitudinal Personality Disorders Study: Development, aims, design, and sample characteristics. Journal of Personality Disorders. 2000;14:300–315. doi: 10.1521/pedi.2000.14.4.300. [DOI] [PubMed] [Google Scholar]
- Hyler SE, Skodol AE, Kellman HD, Oldham JM, Rosnick L. Validity of the Personality Diagnostic Questionnaire—Revised: Comparison with two structured interviews. American Journal of Psychiatry. 1990;147:1043–1048. doi: 10.1176/ajp.147.8.1043. [DOI] [PubMed] [Google Scholar]
- Judd LL, Akiskal HS, Maser JD, Zeller PJ, Endicott J, Coryell W, et al. A prospective 12-year study of subsyndromal and syndromal depressive symptoms in unipolar major depressive disorders. Archives of General Psychiatry. 1998;55:694–700. doi: 10.1001/archpsyc.55.8.694. [DOI] [PubMed] [Google Scholar]
- Judd LL, Akiskal HS, Zeller PJ, Paulus M, Leon AC, Maser JD, et al. Psychosocial disability during the long-term course of unipolar major depressive disorder. Archives of General Psychiatry. 2000;57:375–380. doi: 10.1001/archpsyc.57.4.375. [DOI] [PubMed] [Google Scholar]
- Judd LL, Paulus MP, Schettler PJ, Akiskal HS, Endicott J, Leon AC, et al. Does incomplete recovery from first lifetime major depressive episode herald a chronic course of illness? American Journal of Psychiatry. 2000;157:1501–1504. doi: 10.1176/appi.ajp.157.9.1501. [DOI] [PubMed] [Google Scholar]
- Kalbfleisch JD, Prentice RL. The statistical analysis of failure time data. Wiley; New York: 1980. [Google Scholar]
- Kaplan EL, Meier P. Nonparametric estimation from incomplete observations. Journal of the American Statistical Association. 1958;53:457–481. [Google Scholar]
- Katz MM, Secunda SK, Hirschfeld RMA, Koslow SH. NIMH Clinical Research Branch collaborative program on the psychobiology of depression. Archives of General Psychiatry. 1979;36:765–771. doi: 10.1001/archpsyc.1979.01780070043004. [DOI] [PubMed] [Google Scholar]
- Keller MB, Lavori PW, Friedman B, Nielson E, Endicott J, McDonald-Scott P, Andreason NC. The Longitudinal Interval Follow-Up Evaluation. Archives of General Psychiatry. 1987;44:540–548. doi: 10.1001/archpsyc.1987.01800180050009. [DOI] [PubMed] [Google Scholar]
- Keller MB, Shapiro RW, Lavori PW, Wolfe N. Recovery in major depressive disorder: Analysis with the lifetable and regression models. Archives of General Psychiatry. 1982;39:905–910. doi: 10.1001/archpsyc.1982.04290080025004. [DOI] [PubMed] [Google Scholar]
- Lenzenweger MF. Stability and change in personality disorder features: Findings from a longitudinal study of personality disorders. Archives of General Psychiatry. 1999;56:1009–1015. doi: 10.1001/archpsyc.56.11.1009. [DOI] [PubMed] [Google Scholar]
- McCrae RR, Costa PT. Personality in adulthood. Guilford Press; New York: 1990. [Google Scholar]
- McDavid JD, Pilkonis PA. The stability of personality disorder diagnoses. Journal of Personality Disorders. 1996;10:1–15. [Google Scholar]
- McGlashan TH, Grilo CM, Skodol AE, Gunderson JG, Shea MT, Morey LC, et al. The Collaborative Longitudinal Personality Disorders Study: Baseline Axis I/II and II/II diagnostic co-occurrence. Acta Psychiatrica Scandinavica. 2000;102:256–264. doi: 10.1034/j.1600-0447.2000.102004256.x. [DOI] [PubMed] [Google Scholar]
- Nesselroade JR, Stigler SM, Baltes PB. Regression toward the mean and the study of change. Psychological Bulletin. 1980;88:622–637. [Google Scholar]
- Oldham JM, Skodol AE. Charting the future of Axis II. Journal of Personality Disorders. 2000;14:17–29. doi: 10.1521/pedi.2000.14.1.17. [DOI] [PubMed] [Google Scholar]
- Sanislow CA, McGlashan TH. Treatment outcome of personality disorders. Canadian Journal of Psychiatry. 1998;43:237–250. doi: 10.1177/070674379804300302. [DOI] [PubMed] [Google Scholar]
- Seivewright H, Tyrer P, Johnson T. Change in personality status in neurotic disorders. Lancet. 2002;359:2253–2254. doi: 10.1016/S0140-6736(02)09266-8. [DOI] [PubMed] [Google Scholar]
- Shea MT. Some characteristics of the Axis II criteria sets and implications for assessment of personality disorders. Journal of Personality Disorders. 1992;6:377–381. [Google Scholar]
- Shea MT, Glass DR, Pilkonis PA, Watkins J, Docherty JP. Frequency and implications of personality disorders in a sample of depressed inpatients. Journal of Personality Disorders. 1987;1:27–42. [Google Scholar]
- Shea MT, Stout RL, Gunderson JG, Morey LC, Grilo CM, McGlashan TH, et al. Short-term diagnostic stability of schizotypal, borderline, avoidant, and obsessive– compulsive personality disorders. American Journal of Psychiatry. 2002;159:2036–2041. doi: 10.1176/appi.ajp.159.12.2036. [DOI] [PubMed] [Google Scholar]
- Solomon DA, Keller MB, Leon AC, Mueller TI, Shea MT, Warshaw M, et al. Recovery from major depression: A 10-year prospective follow-up across multiple episodes. Archives of General Psychiatry. 1997;54:1001–1006. doi: 10.1001/archpsyc.1997.01830230033005. [DOI] [PubMed] [Google Scholar]
- Warshaw MG, Keller MB, Stout RL. Reliability and validity of the Longitudinal Interval Follow-Up Evaluation for assessing outcome of anxiety disorders. Journal of Psychiatric Research. 1994;28:531–545. doi: 10.1016/0022-3956(94)90043-4. [DOI] [PubMed] [Google Scholar]
- Zanarini MC, Frankenburg FR, Hennen J, Silk KR. The longitudinal course of borderline psychopathology: 6-year prospective follow-up of the phenomenology of borderline personality disorder. American Journal of Psychiatry. 2003;160:274–283. doi: 10.1176/appi.ajp.160.2.274. [DOI] [PubMed] [Google Scholar]
- Zanarini MC, Frankenburg FR, Sickel AE, Yong L. The Diagnostic Interview for DSM–IV Personality Disorders. McLean Hospital; Belmont, MA: 1996. [Google Scholar]
- Zanarini MC, Skodol AE, Bender D, Dolan R, Sanislow C, Schaeffer E, et al. The Collaborative Longitudinal Personality Disorders Study: Reliability of Axis I and II diagnoses. Journal of Personality Disorders. 2000;14:291–299. doi: 10.1521/pedi.2000.14.4.291. [DOI] [PubMed] [Google Scholar]