Abstract
The 21st century has seen an explosion of new high-throughput data from transcriptomic and proteomic studies. These data are highly relevant to the design and interpretation of modern physiological studies but are not always readily accessible to potential users in user-friendly, searchable formats. Data from our own studies involving transcriptomic and proteomic profiling of renal tubule epithelia have been made available on a variety of online databases. Here, we provide a roadmap to these databases and illustrate how they may be useful in the design and interpretation of physiological studies. The databases can be accessed through http://helixweb.nih.gov/ESBL/Database.
Keywords: proximal tubule, thick ascending limb of Henle, inner medullary collecting duct, mpkCCD
modern physiological research depends on integration of information at the gene or protein level with functional information obtained from classic technical approaches. For example, the development and exploitation of transgenic and knockout mice benefit from knowledge of gene expression patterns in the tissue of interest. Before initiation of a knockout mouse project, it is useful to know, for example, whether the gene to be knocked out is expressed in the target tissue, whether the target tissue expresses similar genes that may compensate for the deleted gene, and whether the gene of interest is expressed in different isoforms (e.g., splicing variants or with different posttranslational modifications). Similarly, a common approach in modern kidney physiology is to carry out probing genetic manipulations in cultured cell models. These manipulations can involve gene knockdowns, overexpression of dominant negatives, and mutational analysis to explore structure-function relationships. Again, knowledge of the gene expression profile in a cell culture model can be helpful in the design of informative studies. In addition, antibodies have become important tools in physiological research and can readily be designed to localize or quantify virtually every protein expressed in a given tissue. However, the choice of immunogen for antibody production and the interpretation of results from such studies can benefit from prior knowledge of the repertoire of genes expressed in the tissue being targeted.
The turn of the century saw the advent of genome-sequencing projects for a variety of organisms of physiological interest. Of the ∼21,000 protein-coding genes in mammalian genomes, ∼8,000–10,000 appear to be expressed in specific renal epithelial cell types (22, 25). Transcriptomic and proteomic techniques have been employed to map gene expression lists to specific cell types in the kidney and in cell culture models. We have placed the data acquired in our laboratory on publically accessible WWW sites for use in the design and interpretation of physiological experiments. The object of this short review is to give the reader a roadmap to these sites and to provide examples of how useful information can be extracted from the sites.
Transcriptomic Databases
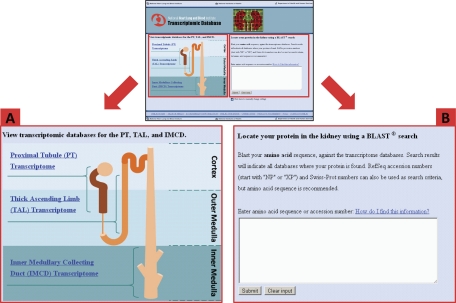
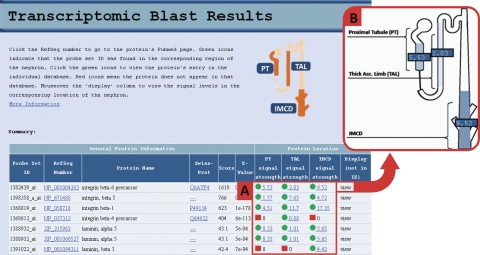
Using Affymetrix expression arrays, we have reported transcriptomic profiles for three renal tubule segments in rat [proximal tubule (25), medullary thick ascending limb (25), and inner medullary collecting duct (22)] and in a series of clones of the mpkCCD cell line (25). The WWW URLs for the corresponding databases are shown in Table 1. (Tested in Firefox [recommended], Safari, and Internet Explorer). For the renal tubule transcriptomic data, we have built an entry portal (Fig. 1; http://helixweb.nih.gov/ESBL/Database/Transcriptomic/index.html) which offers users two ways of accessing the data. Users can either go directly to one of the renal tubule segment-specific databases by clicking on the appropriate segment in the nephron diagram (Fig. 1A), or they can search all three databases simultaneously to determine in which of the three segments the gene of interest is expressed and the relative expression levels (Fig. 1B). The search is done by entering the amino acid sequence of the coded gene in FASTA protein format, which can be obtained at http://www.ncbi.nlm.nih.gov/protein.1 The search, using the BLAST2 algorithm, then finds the best protein matches from the entries in the three renal tubule databases. Note that the BLAST algorithm used on our website searches databases containing only entries for proteins found in the three renal tubule segments, in contrast to BLAST searches performed at the NCBI website (www.ncbi.nlm.nih.gov/BLAST/). Figure 2 shows a typical output for such a search using the amino acid sequence for “integrin-β6 precursor” (RefSeq identifier NP_001004263) as input.3 As can be seen, the search not only identified integrin-β6 as expressed in all three segments but also identified other integrins, two of which are selectively expressed in only one renal tubule segment.
Table 1.
Database URLs
| Transcriptome Databases | |
|---|---|
| Rat proximal tubule transcriptome | http://helixweb.nih.gov/ESBL/Database/Transcriptomic/PTdatabase.html |
| Rat TAL transcriptome | http://helixweb.nih.gov/ESBL/Database/Transcriptomic/TALdatabase.html |
| Rat IMCD transcriptome | http://helixweb.nih.gov/ESBL/Database/Transcriptomic/IMCDdatabase.html |
| Mouse mpkCCD clone 11 vs. clone 2 transcriptome | http://dir.nhlbi.nih.gov/papers/lkem/mpkccdtr/Default.aspx |
| Proteome Databases | |
|---|---|
| IMCD proteome database | http://helixweb.nih.gov/ESBL/Database/IMCD_Proteome/index.html |
| IMCD membrane protein Database | http://dir.nhlbi.nih.gov/papers/lkem/imp/ |
| Mouse mpkCCD clone 11 proteome database | http://dir.nhlbi.nih.gov/papers/lkem/mpkccdproteome/ |
| Phosphoproteome Databases | |
|---|---|
| Rat IMCD phosphoproteome database | http://dir.nhlbi.nih.gov/papers/lkem/mpkccdprot/ |
| Mouse mpkCCD phosphoproteome database | http://dir.nhlbi.nih.gov/papers/lkem/cdpd_private/ |
| Rat medullary TAL phosphoproteome database | http://dir.nhlbi.nih.gov/papers/lkem/mtalpd/ |
| Renal cortical membrane phosphoproteome database | http://dir.nhlbi.nih.gov/papers/lkem/rcmpd/ |
TAL, thick ascending limb of Henle; IMCD, inner medullary collecting duct; CCD, cortical collecting duct.
Fig. 1.
The transcriptomic database webpage presents the user with 2 options for accessing information: links to each of the 3 segment-specific databases individually by clicking on the appropriate database title (A) and a Basic Local Alignment Search Tool (BLAST) search of all 3 databases at once by inputting the amino acid sequence into the input box (B). The “Results” page will display all similar sequences from the transcriptomic databases and indicate which databases contain each matched transcript. (Note that to avoid scrolling, it may be necessary to increase screen resolution for this page and subsequent pages.)
Fig. 2.
Sample output of a BLAST search. The Results page gives a brief explanation, a diagram of the nephron for reference, and a summary table displaying the key results of the search. The table lists matches based on amino acid sequence and for each protein displays general information about the protein and about the protein's location. A: 3 columns highlighted correspond to each of the 3 segment-specific databases being searched. A green icon in a column means that the protein does appear in the corresponding database, and a red icon means the protein does not (determined if the Probe Set ID had a signal strength <0.2). The numbers beside each icon are the signal strengths. B: when the user holds the cursor over the word “view” a visual summary of the previous three columns is shown. The signal strengths are displayed over the correct nephron region. Each region is also shaded in blue, with darker blue shading corresponding to a higher signal level. IMCD, inner medullary collecting duct.
The output of each search includes the Affymetrix Probe Set ID, RefSeq number and Swiss-Prot number for each identified gene. The latter two numbers also serve as links to the corresponding protein records. The output also shows the BLAST similarity score and the corresponding expect value (E-value) using the selected substitution matrix (1) to help the user gauge the degree of similarity.4 The amino acid alignments for each match are provided at the bottom of the page (not shown in Fig. 2). The search uses protein sequences corresponding to transcripts and presents amino acid alignments here because of the physiological context of the tool, recognizing that proteins are the macromolecules that determine most molecular functions. The three columns highlighted in Fig. 2A display the quantitative data from the microarray studies (median normalized, but the experiments were performed separately for each renal tubule segment and the individual values do not necessarily reflect the actual relative expression levels among segments). The user can click on the individual values to navigate to the segment-specific database to see that protein highlighted. Finally, the user can mouse-over “view” to reveal a visual summary of the expression data (Fig. 2B) from the previous three columns (Firefox browser recommended).
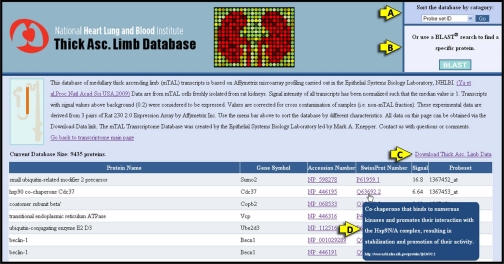
Figure 3 shows the upper portion of one of the segment-specific database pages, namely, the database of the Medullary Thick Ascending Limb Transcriptome. Figure 3A shows a dropdown menu that allows the user to sort the data by different attributes. Figure 3B shows another entry to the BLAST search page described in Fig. 2. Figure 3C highlights the link which allows the user to download all data as a flat file that can be viewed using spreadsheet software (right-click to select display program). Figure 3D illustrates a mouse-over feature that displays the information in the Swiss-Prot “Function” field for the selected gene product to help the user identify potential roles of proteins.
Fig. 3.
Transcriptomic database for the medullary thick ascending limb (TAL). The page provides a description of the methods used to collect the data and displays information for all of the Affymetrix Probe Set IDs found in the TAL. Each probe set ID is listed along with the associated protein name, gene symbol, accession number, Swiss-Prot number, and the fluorescent signal strength in the array readout. The database also includes the following features: the option to sort the database (A), a link to the BLAST search featured on the main page so that users can find a specific protein by amino acid sequence (B), a link that downloads the data into a spreadsheet (C), the Swiss-Prot function of the proteins visible by holding the cursor over the Swiss-Prot number (D).
The user can also access a similar database for different clones of the mpkCCD cell line, which is derived from cortical collecting duct of mouse (Table 1A) (25).
In addition to the highly detailed integrated databases described above, the same transcriptomic information is provided in a simplified format at https://intramural.nhlbi.nih.gov/labs/LKEM_G/LKEM/Pages/–TranscriptomicandProteomicDatabases.aspx.
Future studies will aim to provide similar data for all renal tubule cell types. The three target cell types (proximal tubule, medullary thick ascending limb, and inner medullary collecting duct) profiled up to now were chosen because they can be biochemically isolated from kidney tissue at a high degree of purity, as they are the most abundant renal tubule types in the cortex, outer medulla, and inner medulla, respectively. Database expansion is expected to involve the development and exploitation of transgenic mice that target selectable fluorescent proteins to specific cell types to allow sorting on a cellular or organellar level. Details of these methods are beyond the scope of the current review. Beyond this, it will be useful to carry out transcriptomic profiling of epithelial cell lines other than the mpkCCD cells discussed above.
Additional transcriptomic data are available from other sources for renal tubule segments and renal epithelial cell culture models. For example, transcriptomic data have been reported from application of Serial Analysis of Gene Expression (SAGE) for mpkCCD cells (17) and for various microdissected renal tubule segments (4–6, 15, 20, 24, 28). In addition, microarray data are available from a cultured renal proximal tubule cell line (8).
Proteomic Databases
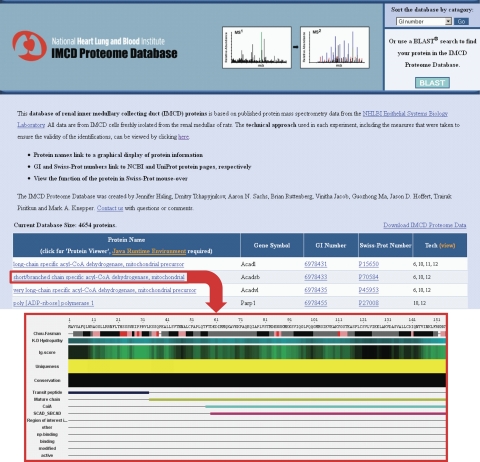
Using protein mass spectrometry, we have identified the proteomes of both the renal inner medullary collecting duct (2, 3, 10–13, 18, 19, 21, 23, 26, 27) and cultured mpkCCD cells (clone 11) (16). The URLs for the corresponding databases are shown in Table 1. The IMCD Proteome Database (http://helixweb.nih.gov/ESBL/Database/IMCD_Proteome/index.html) is organized in a manner similar to that of the transcriptomic databases discussed above. The “Tech view” feature allows the user to find the correct reference with the appropriate description of the techniques used to generate the data. One additional feature of the database is that each individual protein name links to the “Protein Viewer” feature, which shows a linear map of the protein from N terminus to C terminus with various features plotted as a function of amino acid number, including Kyte-Doolittle hydropathy, Chou-Fasman secondary structure predictions, and relative immunogenicity (Fig. 4). The Protein Viewer feature has been adapted from another program, NHLBI-AbDesigner (14), for design of peptide-directed antibodies. Note that Java Runtime Environment (JRE) is needed to show Java applets within Protein Viewer. JRE is preloaded on most desktop and laptop computers. If not, the user can download JRE free at http://www.java.com/en/.
Fig. 4.
IMCD Proteome Database contains the same features as the transcriptome databases (sorting options, BLAST search, downloadable data, and mouse-over Swiss-Prot functions). In addition, the name of each protein links the user to the “Protein Viewer,” which displays various features mapped along the length of the protein's amino acid sequence. The “Tech view” feature allows the user to find the correct reference with the appropriate description of the techniques used to generate the data.
Phosphoproteomic Databases
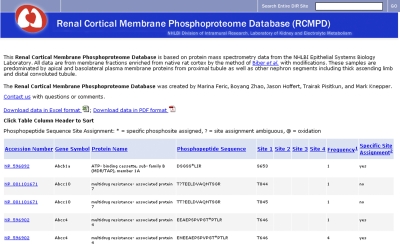
Protein phosphorylation is an important posttranslational modification that is part of virtually every signaling pathway in eukaryotic organisms. Consequently, we have carried out extensive studies in which we have identified and quantified phosphorylation sites in proteins using LC-MS/MS techniques in various renal tubule epithelia, viz., inner medullary collecting duct (2, 10), medullary thick ascending limb (9), proximal tubule and other renal cortical segments (7), and cultured mpkCCD (clone 11) cells (16). The URLs for the corresponding databases are shown in Table 1. Figure 5 shows a screen shot of the proximal tubule phosphoproteomics site. This and other phosphoproteomic databases show major features of the phosphopeptides detected in a tabular format listing the RefSeq Accession Number of the protein, the Official Gene Symbol, the protein name, the sequence of the identified phosphopeptide, the amino acid(s) phosphorylated, and the specificity of the site assignment (i.e., whether it is assigned with certainty or not). Many of the phosphorylation sites detected in these studies are novel, i.e., not previously reported. Consequently, investigators may discover something new about a given protein just by looking it up on each of the phosphoproteomic databases.
Fig. 5.
Phosphoproteomic database for proximal tubule and other renal cortical membrane proteins. The page provides a sortable table of phosphorylation sites detected along with the accession number, official gene symbol, protein name, phosphopeptide sequence detected, and site assignment information. In addition the user is able to download all the data as a spreadsheet or a PDF file.
DISCUSSION
Here, we have presented a series of transcriptomic and proteomic databases that provide a resource for modern renal physiological research. These databases are not comprehensive in the sense that not all renal cell types are covered and data from laboratories other than ours have not been incorporated. We propose that further work toward a comprehensive set of databases be carried out collaboratively among members of the renal community. Meanwhile, the data included in the databases presented here have been extensively employed in our own studies and hopefully provide information useful throughout the renal physiology community.
DISCLOSURES
No conflicts of interest, financial or otherwise, are declared by the authors.
AUTHOR CONTRIBUTIONS
Author contributions: J.C.H., T.P., J.D.H., and M.A.K. provided conception and design of research; J.C.H. and T.P. performed experiments; J.C.H., T.P., J.H.S., and M.-J.Y. analyzed data; J.C.H., T.P., M.-J.Y., and J.D.H. interpreted results of experiments; J.C.H., T.P., and M.A.K. prepared figures; J.C.H., T.P., and M.A.K. drafted manuscript; J.C.H., T.P., J.H.S., M.-J.Y., J.D.H., and M.A.K. edited and revised manuscript; J.C.H., T.P., J.H.S., M.-J.Y., J.D.H., and M.A.K. approved final version of manuscript.
ACKNOWLEDGMENTS
Present address for M.-J. Yu: Institute of Biochemistry and Molecular Biology, National Taiwan University College of Medicine, Taipei, Taiwan. This work was supported by the budget of the Division of Intramural Research, National Heart, Lung, and Blood Institute (NHLBI; project ZO1-HL001285, M. A. Knepper).
Footnotes
FASTA, pronounced “fast-A,” is a sequence alignment algorithm similar in many ways to BLAST (see below). It is not used very frequently now, but it introduced a particular format for representing sequence information and metadata that is now the standard representation format for most sequence alignment tasks, to wit “FASTA format.”
BLAST (or Basic Local Alignment Search Tool) is an computer algorithm that is used to compare a biological sequence (here, an amino acid sequence) with all sequences in a library of sequences to determine what members of the target library are most similar to the test sequence. The output is dependent on choice of internal parameters and the target library. Here, the purpose of the BLAST search is to find out whether a particular protein, represented by the test sequence, is present in a given cell-specific database. Accordingly, for this purpose, we use a library that we have constructed from a list of proteins or transcripts that have been detected in the renal cell type of interest.
This sequence can conveniently be found by clicking on “How do I find this information?” near the BLAST input box.
“E-value” is a value generated by BLAST that summarizes the chances of finding the observed degree of overlap between the input sequence and the target sequence purely by chance. The lower the E-value, the more likely the match indicates that the selected target protein is biologically related to the input sequence. If the specific protein of interest is present in the database, the E-value is usual 0.0, indicating a complete match. However, if the target sequence contains genetic variant sequences or sequencing errors, a very small non-zero value may be obtained.
REFERENCES
- 1. Altschul SF, Madden TL, Schaffer AA, Zhang J, Zhang Z, Miller W, Lipman DJ. Gapped BLAST and PSI-BLAST: a new generation of protein database search programs. Nucleic Acids Res 25: 3389–3402, 1997 [DOI] [PMC free article] [PubMed] [Google Scholar]
- 2. Bansal AD, Hoffert JD, Pisitkun T, Hwang S, Chou CL, Boja ES, Wang G, Knepper MA. Phosphoproteomic profiling reveals vasopressin-regulated phosphorylation sites in collecting duct. J Am Soc Nephrol 21: 303–315, 2010 [DOI] [PMC free article] [PubMed] [Google Scholar]
- 3. Barile M, Pisitkun T, Yu MJ, Chou CL, Verbalis MJ, Shen RF, Knepper MA. Large scale protein identification in intracellular aquaporin-2 vesicles from renal inner medullary collecting duct. Mol Cell Proteomics 4: 1095–1106, 2005 [DOI] [PMC free article] [PubMed] [Google Scholar]
- 4. Chabardes-Garonne D, Mejean A, Aude JC, Cheval L, Di SA, Gaillard MC, Imbert-Teboul M, Wittner M, Balian C, Anthouard V, Robert C, Segurens B, Wincker P, Weissenbach J, Doucet A, Elalouf JM. A panoramic view of gene expression in the human kidney. Proc Natl Acad Sci USA 100: 13710–13715, 2003 [DOI] [PMC free article] [PubMed] [Google Scholar]
- 5. Cheval L, Morla L, Elalouf JM, Doucet A. Kidney collecting duct acid-base “regulon.” Physiol Genomics 27: 271–281, 2006 [DOI] [PubMed] [Google Scholar]
- 6. Cheval L, Pierrat F, Dossat C, Genete M, Imbert-Teboul M, Duong Van Huyen JP, Poulain J, Wincker P, Weissenbach J, Piquemal D, Doucet A. Atlas of gene expression in the mouse kidney: new features of glomerular parietal cells. Physiol Genomics 43: 161–173, 2011 [DOI] [PubMed] [Google Scholar]
- 7. Feric M, Zhao B, Hoffert JD, Pisitkun T, Knepper MA. Large-scale phosphoproteomic analysis of membrane proteins in renal proximal and distal tubule. Am J Physiol Cell Physiol 300: C755–C770, 2011 [DOI] [PMC free article] [PubMed] [Google Scholar]
- 8. Garrett SH, Somji S, Sens MA, Zhang K, Sens DA. Microarray analysis of gene expression patterns in human proximal tubule cells over a short and long time course of cadmium exposure. J Toxicol Environ Health 74: 24–42, 2011 [DOI] [PubMed] [Google Scholar]
- 9. Gunaratne R, Braucht DW, Rinschen MM, Chou CL, Hoffert JD, Pisitkun T, Knepper MA. Quantitative phosphoproteomic analysis reveals cAMP/vasopressin-dependent signaling pathways in native renal thick ascending limb cells. Proc Natl Acad Sci USA 2010 [DOI] [PMC free article] [PubMed] [Google Scholar]
- 10. Hoffert JD, Pisitkun T, Wang G, Shen RF, Knepper MA. Quantitative phosphoproteomics of vasopressin-sensitive renal cells: regulation of aquaporin-2 phosphorylation at two sites. Proc Natl Acad Sci USA 103: 7159–7164, 2006 [DOI] [PMC free article] [PubMed] [Google Scholar]
- 11. Hoffert JD, van Balkom BW, Chou CL, Knepper MA. Application of difference gel electrophoresis to the identification of inner medullary collecting duct proteins. Am J Physiol Renal Physiol 286: F170–F179, 2004 [DOI] [PubMed] [Google Scholar]
- 12. Hoorn EJ, Hoffert JD, Knepper MA. Combined proteomics and pathways analysis of collecting duct reveals a protein regulatory network activated in vasopressin escape. J Am Soc Nephrol 16: 2852–2863, 2005 [DOI] [PMC free article] [PubMed] [Google Scholar]
- 13. Pisitkun T, Bieniek J, Tchapyjnikov D, Wang G, Wu WW, Shen RF, Knepper MA. High-throughput identification of IMCD proteins using LC-MS/MS. Physiol Genomics 25: 263–276, 2006 [DOI] [PMC free article] [PubMed] [Google Scholar]
- 14. Pisitkun T, Hoffert JD, Saeed F, Knepper MA. NHLBI-AbDesigner: an online tool for design of peptide-directed antibodies. Am J Physiol Cell Physiol 302: C154–C164, 2012 [DOI] [PMC free article] [PubMed] [Google Scholar]
- 15. Pradervand S, Zuber MA, Centeno G, Bonny O, Firsov D. A comprehensive analysis of gene expression profiles in distal parts of the mouse renal tubule. Pflügers Arch 460: 925–952, 2010 [DOI] [PubMed] [Google Scholar]
- 16. Rinschen MM, Yu MJ, Wang G, Boja ES, Hoffert JD, Pisitkun T, Knepper MA. Quantitative phosphoproteomic analysis reveals vasopressin V2-receptor-dependent signaling pathways in renal collecting duct cells. Proc Natl Acad Sci USA 107: 3862–3867, 2010 [DOI] [PMC free article] [PubMed] [Google Scholar]
- 17. Robert-Nicoud M, Flahaut M, Elalouf JM, Nicod M, Salinas M, Bens M, Doucet A, Wincker P, Artiguenave F, Horisberger JD, Vandewalle A, Rossier BC, Firsov D. Transcriptome of a mouse kidney cortical collecting duct cell line: effects of aldosterone and vasopressin. Proc Natl Acad Sci USA 98: 2712–2716, 2001 [DOI] [PMC free article] [PubMed] [Google Scholar]
- 18. Sachs AN, Pisitkun T, Hoffert JD, Yu MJ, Knepper MA. LC-MS/MS analysis of differential centrifugation fractions from native inner medullary collecting duct of rat. Am J Physiol Renal Physiol 295: F1799–F1806, 2008 [DOI] [PMC free article] [PubMed] [Google Scholar]
- 19. Simons BL, Wang G, Shen RF, Knepper MA. In vacuo isotope coded alkylation technique (IVICAT); an N-terminal stable isotopic label for quantitative liquid chromatography/mass spectrometry proteomics. Rapid Commun Mass Spectrom 20: 2463–2477, 2006 [DOI] [PubMed] [Google Scholar]
- 20. Soutourina O, Cheval L, Doucet A. Global analysis of gene expression in mammalian kidney. Pflügers Arch 450: 13–25, 2005 [DOI] [PubMed] [Google Scholar]
- 21. Tchapyjnikov D, Li Y, Pisitkun T, Hoffert JD, Yu MJ, Knepper MA. Proteomic profiling of nuclei from native renal inner medullary collecting duct cells using LC-MS/MS. Physiol Genomics 40: 167–183, 2010 [DOI] [PMC free article] [PubMed] [Google Scholar]
- 22. Uawithya P, Pisitkun T, Ruttenberg BE, Knepper MA. Transcriptional profiling of native inner medullary collecting duct cells from rat kidney. Physiol Genomics 32: 229–253, 2008 [DOI] [PMC free article] [PubMed] [Google Scholar]
- 23. van Balkom BW, Hoffert JD, Chou CL, Knepper MA. Proteomic analysis of long-term vasopressin action in the inner medullary collecting duct of the Brattleboro rat. Am J Physiol Renal Physiol 286: F216–F224, 2004 [DOI] [PubMed] [Google Scholar]
- 24. Virlon B, Cheval L, Buhler JM, Billon E, Doucet A, Elalouf JM. Serial microanalysis of renal transcriptomes. Proc Natl Acad Sci USA 96: 15286–15291, 1999 [DOI] [PMC free article] [PubMed] [Google Scholar]
- 25. Yu MJ, Miller RL, Uawithya P, Rinschen MM, Khositseth S, Braucht DW, Chou CL, Pisitkun T, Nelson RD, Knepper MA. Systems-level analysis of cell-specific AQP2 gene expression in renal collecting duct. Proc Natl Acad Sci USA 106: 2441–2446, 2009 [DOI] [PMC free article] [PubMed] [Google Scholar]
- 26. Yu MJ, Pisitkun T, Wang G, Aranda JF, Gonzales PA, Tchapyjnikov D, Shen RF, Alonso MA, Knepper MA. Large-scale quantitative LC-MS/MS analysis of detergent-resistant membrane proteins from rat renal collecting duct. Am J Physiol Cell Physiol 295: C661–C678, 2008 [DOI] [PMC free article] [PubMed] [Google Scholar]
- 27. Yu MJ, Pisitkun T, Wang G, Shen RF, Knepper MA. LC-MS/MS analysis of apical and basolateral plasma membranes of rat renal collecting duct cells. Mol Cell Proteomics 5: 2131–2145, 2006 [DOI] [PMC free article] [PubMed] [Google Scholar]
- 28. Zuber AM, Centeno G, Pradervand S, Nikolaeva S, Maquelin L, Cardinaux L, Bonny O, Firsov D. Molecular clock is involved in predictive circadian adjustment of renal function. Proc Natl Acad Sci USA 106: 16523–16528, 2009 [DOI] [PMC free article] [PubMed] [Google Scholar]


