Abstract
We used dynamic dense noise stimuli and local spectral reverse correlation methods to reveal the local sensitivities of neurons in visual area 2 (V2) of macaque monkeys to orientation and spatial frequency within their receptive fields. This minimized the potentially confounding assumptions that are inherent in stimulus selections. The majority of neurons exhibited a relatively high degree of homogeneity for the preferred orientations and spatial frequencies in the spatial matrix of facilitatory subfields. However, about 20% of all neurons showed maximum orientation differences between neighboring subfields that were greater than 25 deg. The neurons preferring horizontal or vertical orientations showed less inhomogeneity in space than the neurons preferring oblique orientations. Over 50% of all units also exhibited suppressive profiles, and those were more heterogeneous than facilitatory profiles. The preferred orientation and spatial frequency of suppressive profiles differed substantially from those of facilitatory profiles, and the neurons with suppressive subfields had greater orientation selectivity than those without suppressive subfields. The peak suppression occurred with longer delays than the peak facilitation. These results suggest that the receptive field profiles of the majority of V2 neurons reflect the orderly convergence of V1 inputs over space, but that a subset of V2 neurons exhibit more complex response profiles having both suppressive and facilitatory subfields. These V2 neurons with heterogeneous subfield profiles could play an important role in the initial processing of complex stimulus features.
Keywords: local spectral reverse correlation, receptive field subfields, extrastriate visual neurons, primates
the perception of global form depends on multiple stages of cortical processing (e.g., El-Shamayleh and Movshon 2011; Geisler et al. 2001; Orban 2008; Rust and Stocker 2010; Tanaka 1996; Willmore et al. 2010). The small receptive fields of V1 neurons are sensitive to stimulus orientation, spatial/temporal frequency, and contrast and thus are considered to encode local stimulus features or attributes of visual scenes (i.e., initial filtering stage). There is a considerable debate in the literature concerning exactly where and how local stimulus features are compared and pooled (second-stage processing). One idea regarding the second-stage processing is that the complex networks of V1 neurons play a critical role (Graf and Adams 2008; Jehee et al. 2007; Lamme 1995; Lamme et al. 2000; Lee et al. 2002; Levi 2007; Li and Gilbert, 2002; Li et al. 2004, 2006; Sceniak et al. 2001; Sigman et al. 2001; Shapley 2007; Smith et al. 2007).
Neurons in the extrastriate visual areas, with increasingly larger receptive field centers and more complex response properties, are thought to support a variety of global perceptual phenomena (see reviews by El-Shamayleh and Movshon 2011; Ghose and Maunsell 1999; Orban 2008; Roe et al. 2007). In this scheme, multiple inputs from V1 neurons tuned to various local stimulus features (e.g., orientation) converge on V2 neurons (also from V2 onto V4, and so on), and as a result, many of these “intermediate” extrastriate neurons acquire “new” sensitivities. For instance, a considerable proportion of V2 (Anzai et al. 2007; Bakin et al. 2000; Huang et al. 2008; Hegde and Van Essen 2000; Ito and Komatsu 2004; Kobatake and Tanaka 1994; Mahon and De Valois 2001; Marcus and Van Essen 2002; Schmid et al. 2009; Willmore et al. 2010; Zhou et al. 2000) and V4 neurons (Gallant et al. 1993, 1996; Pasupathy and Conner 1999, 2001, 2002) become sensitive to corners or angled contours that make up a part of a global shape by efficiently linking local feature information (but see El-Shamayleh and Movshon 2011; Hegde and Van Essen 2007).
To uncover neurons' local sensitivities to stimulus orientation, most of the previous V2 studies used spatially restricted grating stimuli at various locations within their receptive fields or a finite set of complex stimuli. Because of the relatively high spiking threshold and large nonlinearities of extrastriate neurons, mapping their receptive fields using a part of optimal stimuli, e.g., a small bar or a restricted patch of grating, often failed to activate these neurons (Ito and Komatsu 2004; Pasupathy and Connor 2001; Tanaka et al. 1991). An effective approach to overcome this difficulty is to quantitatively analyze the spatial profiles of neurons' receptive fields without depending on a finite set of luminance-defined stimuli. In this study, therefore, we applied dynamic dense white noise stimuli, which stimulated large visual areas over the receptive field and a local spectral reverse correlation (LSRC) analysis to reveal the local “subfield” sensitivities within the receptive fields of macaque V2 neurons (Nishimoto et al. 2006). The LSRC is based on spectral analyses in a two-dimensional spatial frequency domain for spatially localized areas within and around the receptive fields. It is an objective, quantitative method for measuring the response profiles containing local variations of orientation and spatial frequency tuning properties in neurons with substantial nonlinearity. The LSRC method is especially suitable to study the receptive field spatial structure in a subset of V2 neurons that may be sensitive to complex visual features, because such V2 neurons are thought to receive inhomogeneous inputs from the earlier stages of cortical processing (e.g., Anzai et al. 2007; Ito and Komatsu 2004; Nishimoto et al. 2006).
MATERIALS AND METHODS
Recordings were made in five adult macaque monkeys (Macaca mulatta) weighing between 4.0 and 6.0 kg. All experimental and animal care procedures were in compliance with the “Guiding Principles for Research Involving Animals and Human Beings” and were approved by the Institutional Animal Care and Use Committee of the University of Houston.
Surgical Preparation
The surgical preparation and the recording and stimulation methods have been described in detail elsewhere (Maruko et al. 2008). Briefly, monkeys were initially anesthetized with an intramuscular injection of ketamine hydrochloride (15–20 mg/kg) and acepromazine malerate (0.15–0.2 mg/kg). A cannula was placed in a superficial vein to facilitate the continuous infusion of propofol (4 mg·kg−1·h−1) and sufentanyl citrate (0.05 μg·kg−1·h−1). A tracheotomy was performed to allow artificial respiration. The subjects were then secured in a stereotaxic instrument. A small craniotomy and durotomy were made over the lunate sulcus to expose a small area for electrode insertion. The well covering the exposed dura and brain surface was filled with warm agar and closed with melted wax. After all surgical procedures were completed, the animals were paralyzed by an intravenous injection of vecuronium bromide (Norcuron; 0.1 mg·kg−1·h−1) and artificially ventilated with a mixture of 59% N2O, 39% O2, and 2% CO2. Core body temperature was kept at 37.6°C by a warming pad. Cycloplegia was produced by a topical instillation of 1% atropine, and the animals' corneas were protected with rigid gas-permeable, extended-wear contact lenses. Retinoscopy was used to determine the contact lens parameters required to focus the eyes on the stimulus screens.
Recording and Visual Stimulation
Visual stimuli were displayed on a cathode ray tube display with ultrashort persistence (frame rate = 140 Hz, 800 × 600 pixels). The viewing distance was set to 114 cm, at which the display subtended 20 deg (horizontal) × 15 deg (vertical). Tungsten-in-glass microelectrodes (Merrill and Ainsworth 1972; FHC, Bowdoin, ME) were used to record multiunit or single-unit activity from which activity of single cortical neurons was isolated using spike-sorting software. Action potentials were extracellularly recorded, amplified and digitized at 25 kHz, and stored to disk on a computer running the TDT (Tucker-Davis Technology, Alachua, FL) data acquisition components of our workstation.
For each isolated neuron, the receptive fields for both eyes were mapped on the tangent screen and its ocular dominance was initially determined using handheld stimuli. The mapped receptive fields were projected on the monitor screen by using a pair of gimbaled mirrors, and the responses of each neuron to a variety of stimuli were closely examined quantitatively as follows.
Measurement with sine wave gratings.
For drifting gratings, a neuron's responses were sampled at a rate of 140 Hz (7.14-ms bin widths) and compiled into peristimulus time histograms (PSTHs) that were equal in duration to, and synchronized with, the temporal cycle of the grating. For sine-wave gratings, the amplitude and phase of the temporal response components in the PSTHs were determined by Fourier analysis. The stimuli were presented multiple times in a randomly ordered sequence for relatively short periods (e.g., 3.22 s). During a given experiment, the re-randomized stimulus presentations were repeated 3–6 times, producing PSTHs for each stimulus that represent the neuron's response to 30–60 stimulus grating cycles. One or two blank stimuli (i.e., zero-contrast control) were included in each repeat of the re-randomized sequence to provide a measure of the neuron's maintained firing rate.
Responses to sine-wave gratings (contrast 80%, temporal frequency 3.0 Hz) were measured to characterize the monocular receptive field properties. Sine-wave gratings were presented randomly to either the left or the right eye for a given presentation. The orientation tuning functions were initially obtained using the qualitatively determined optimal spatial frequency for each neuron. This was followed by acquisition of the spatial frequency tuning functions at the neuron's preferred orientation and the preferred direction of drift. The preferred orientation and orientation bandwidth for each receptive field were determined by fitting the orientation tuning functions with wrapped Gaussian functions (Swindale 1998):
where θ = orientation, m1 = response amplitude, m2 = preferred orientation, and m3 = standard deviation of the Gaussian function. Orientation bias was calculated by using vector summation methods (Levick and Thibos 1982; Smith et al. 1990). Briefly, the response of a given neuron to a given orientation is expressed as the following complex number:
The response amplitude for a grating of orientation θ is described by a vector with a length of r at an angle coordinate of 2θ, where j is the square root of −1. The orientation bias is expressed as the mean response vector for a series of equally spaced stimulus orientations: Rmean = ΣR/N, where N = number of orientations. The mean response vector was then normalized with respect to the average amplitude of the vectors for all orientations, i.e., Σr/N. A normalized phasor for all stimulus orientations was computed using the following formula:
where ΣR is the vector sum for all 12 orientations and Σr is the scalar sum of the amplitudes of all of the response vectors. The normalized phasor b represents orientation bias, which varied between 0 (no orientation bias) and 1.0 (responsive to only 1 orientation). The term 2θp signifies the angular coordinates of the resultant vector, and the angle θp is the preferred stimulus orientation of the unit. The above normalization procedure minimizes the sensitivity of the measure to the responsiveness of the neuron (Thibos and Levick 1985).
To determine each cell's preferred spatial frequency, the spatial frequency response data were fitted with Gaussian functions (DeAngelis et al. 1993):
where f = spatial frequency, m1 = response amplitude, f0 = preferred spatial frequency, and s = standard deviation of the Gaussian function. Finally, size tuning functions were obtained for the receptive fields of each V2 neuron. We determined the receptive field center and surround of a given neuron and the strength of surround suppression by measuring area-summation functions with drifting high-contrast (80%) sinusoidal gratings that were optimized for the orientation, spatial frequency, and temporal frequency of the receptive field center (Zhang et al. 2005). The receptive field center size was determined by searching for the smallest center stimulus diameter at which neuronal discharges reached 95% of the peak firing rate.
LSRC method.
The details of visual stimulation and data analysis for the LSRC method have been described previously by Nishimoto et al. (2006). Briefly, the experiment control functions and the stimulus generations were performed using custom-written software on two Windows personal computers (Komputer, Houston, TX). For each cell, we presented a dynamic two-dimensional noise array. The area covered by the noise array was three times larger than the classical receptive fields in width and height (typical ranges were from 1 × 1 to 12 × 12 deg). The noise array consisted of 51 × 51 elements in which the luminance of each element was bright (99 cd/m2), dark (1 cd/m2), or equal to the mean luminance of the display (50 cd/m2). The noise array was redrawn with a new noise pattern every 28 ms (4 video frames). Typically, 15 blocks of the noise arrays (a total of 62,565 frames) were presented to obtain a sufficient number of spikes for data analysis.
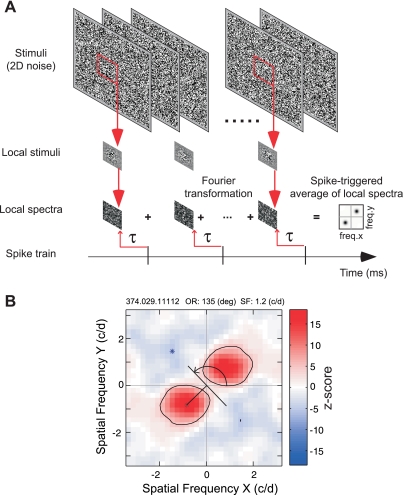
To obtain two-dimensional frequency tuning functions for spatially localized areas, we calculated LSRC. Specifically, we calculated the spike-triggered average of the amplitude spectra of a given subfield of the noise array to obtain a two-dimensional frequency tuning function for the given subfield (Fig. 1A). The subfields were windowed by a two-dimensional Gaussian function, and the frequency spectra were calculated by the standard fast Fourier transform algorithm with zero padding (Press et al. 1992). The center of the window was stepped typically by one standard deviation (1 SD) of the Gaussian function. By interpreting the two-dimensional frequency tuning as a polar coordinate representation, we obtained a joint spatial frequency and orientation profile. The distance from the origin to the peak of the excitation indicated the optimal spatial frequency for the local subfield of the receptive field. The angle perpendicular to the line connecting the origin and the excitation peak (with the horizontal axis) depicted the optimal orientation for the local subfield. By systematically changing positions of the subfield for calculating the spectra, we obtained a matrix of subfields in which each element of the matrix contained the two-dimensional frequency tuning functions (Fig. 1, A and B). Therefore, the final matrix describes the tuning profile of the neuron as a function of position (X, Y) as well as spatial frequency and orientation in a joint manner. We optimized the number of position/spacing for each unit depending on the spatial frequency tuning of the unit; for neurons with bandpass profile in their spatial frequency tuning functions, the analysis window covered at least one-half of the period of the optimal spatial frequency within 1 SD of the Gaussian. In rare cases where neurons had a low-pass SF tuning, we used the SD value corresponding to one-fifth of the mapped area.
Fig. 1.
Schematic diagram of the local spectral reverse correlation (LSRC) analysis (see the materials and methods for details). A: visual stimuli and analysis procedure used to derive LSRC maps. We calculated a cross-correlation between the spike train and the amplitude spectra of Gaussian-windowed stimuli to obtain a 2-dimensional (2D) frequency tuning function for the given subfield. τ, Correlation delay. B: example of spike-triggered average of local spectra (local spectral selectivity map or subfield). The X- and Y-axes show vertical and horizontal spatial frequency (SF), respectively, in cycles/deg (c/d). Facilitations and suppressions are indicated by red and blue, respectively. Asterisks show the location of the highest and lowest Z scores that correspond to the frequency of the maximum facilitation and suppression, respectively. Scale bar with Z scores is illustrated at right. The distance from the origin to the peak of the excitation indicates the optimal SF for the local subfield of the receptive field. The angle perpendicular to the line connecting the origin and the excitation peak (with the horizontal axis) depicts the optimal orientation for the local subfield (curved arrow). OR, orientation.
We calculated spike-triggered averages of stimulus local spectra for correlation delays from 0 to 150 ms in 15-ms steps. The optimal correlation delay was then determined as the delay for which the signal amplitude was maximal. Typical correlation delays varied from 45 to 90 ms. The average number of spikes for our population of neurons was 16,136 spikes per recording. The minimum and maximum were 1,574 and 77,271 spikes, respectively.
To evaluate the significance of the spike-triggered signals, we calculated the average and SD (noise level) of signals using shuffled correlations. We obtained the shuffled correlations by calculating cross-correlations between spike trains and shifted (unpaired) stimulus blocks. The mean and SD of the shuffled correlations were then used to normalize the original spike-triggered signals into Z-score representations. To reduce the computational burden, we assumed that the noise level was identical for a sequence of random patterns for any given subfield and spatial frequency. Therefore, for each neuron, we calculated a set of mean and SD values of the shuffled correlations and used it to normalize all spike-triggered signals for the neuron.
We used Z scores to represent the response strength in these spectral receptive field profiles, taking variability and statistical significance of responses into account. The Z scores were sometimes negative, which was interpreted as a reduction of activities below the baseline level. The statistical significance of signals was examined by the Z score, corrected for multiple comparisons using Bonferroni's method (Fig. 1B, right). The degree of freedom for the Bonferroni's correction was set to the number of subfields multiplied by the number of noise elements within ±1 SD of the analyzing Gaussian window. Black curves in the LSRC plot indicate contours for P = 0.05.
Anatomical Methods
To identify recording sites, small electrolytic lesions were produced at several locations along the electrode track by passing current through the electrode (5 μA for <5 s, electrode tip negative). At the end of the recording experiments, an overdose of pentobarbital sodium (100 mg/kg) was administered intravenously to induce a deep level of anesthesia, and the animals were euthanized. The animals were perfused through the heart with an aldehyde fixative (2% paraformaldehyde and 0.5% glutaraldehyde in 0.1 M phosphate buffer, pH = 7.4). The brains were removed immediately and kept overnight in fixative with 20% sucrose. The tissues were cut in 40-μm sections on a freezing microtome in the tangential, frontal, or sagittal plane. The sections were used to confirm that we recorded from comparable sites in different animals.
RESULTS
We quantitatively analyzed the responses of 149 V2 neurons. In each unit, we initially measured the orientation, spatial frequency, and size tuning functions using sine-wave gratings. Using the optimal parameters obtained in these experiments, we performed the LSRC analysis of the neuron using the dynamic dense noise stimuli.
Local Spectral Selectivity Maps With Facilitatory Profiles
High homogeneity of facilitatory profiles.
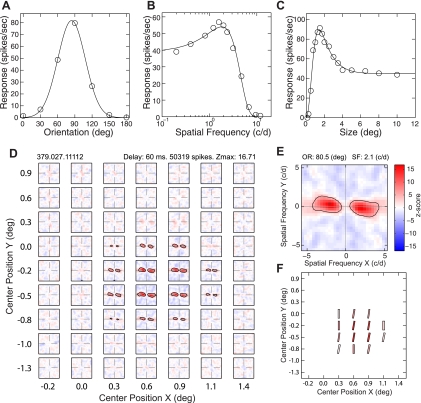
According to the previous studies using spatially restricted grating stimuli, a V2 neuron containing the small “subregions” within its receptive field that are different in preferred orientations could encode angles embedded in complex stimuli, e.g., “position-specific” curvature neurons (Anzai et al. 2007; Arai and Ohzawa 2010; Hegde and Van Essen 2000; Ito and Komatsu 2004). Using the LSRC method, we looked for the spatial matrix of subfields that would fulfill this requirement. The majority of V2 neurons in this study exhibited homogeneous matrices of facilitatory subfields. Figure 2 illustrates the responses of a typical V2 neuron to grating stimuli (A–C) and dynamic dense noise stimuli (D–F). In response to grating stimuli, this neuron showed the typical orientation tuning properties, having its preferred orientation at 84.2 deg and an orientation bias of 0.54 (Fig. 2A). The unit was tuned to relatively high spatial frequencies, having the preferred spatial frequency at 1.81 cycles/deg and the high-frequency cutoff at 12.8 cycles/deg (Fig. 2B). The receptive field center size of this unit was 1.4 deg, estimated from its size tuning function (Fig. 2C). Figure 2D shows the spatial matrix of subfields with facilitatory profiles (2-dimensional spatial frequency tuning) for this unit obtained by changing iteratively the center position of the Gaussian window. The detailed profile of the most responsive subfield (with the maximum Z score) is illustrated in Fig. 2E. The schematic diagram, showing the preferred orientation (bar angle) and spatial frequencies (width) and the maximum Z scores (saturation) of the subfields is illustrated in Fig. 2F. The preferred orientations of facilitatory subfields within the matrix were similar to the preferred orientation of the unit measured with sine-wave gratings (compare Fig. 2A with Fig. 2, E and F). The preferred spatial frequency of the subfields was also similar between subfields and was similar to the preferred spatial frequency of the unit determined by grating stimuli (compare Fig. 2B with Fig. 2E). The spatial extent (spatial matrix) of facilitatory subfields was confined within the receptive field center of this neuron, determined from the neuron's area summation function (compare Fig. 2C with Fig. 2D), and the strength of activation (Z scores) was highest near the center of the subfield matrix (saturation of each bar in Fig. 2F).
Fig. 2.
A spatial matrix of subfields with facilitatory profiles in a V2 neuron that exhibited spatial homogeneity of orientation and SF within its receptive field. A–C: selectivity to the orientation (A), SF (B), and size (C) measured using sinusoidal grating stimuli (temporal frequency 3.1 Hz; contrast 80%). D: spatial matrix of subfields with facilitatory profiles (2D spatial frequency tuning) obtained by changing iteratively the center position of the Gaussian window shown in Fig. 1. E: detailed profile of the subfield with the maximum Z score. F: schematic diagram showing the preferred orientation (bar angle) and SF (width) and the maximum Z scores (saturation) of the subfields illustrated in D. Zmax, maximum Z score.
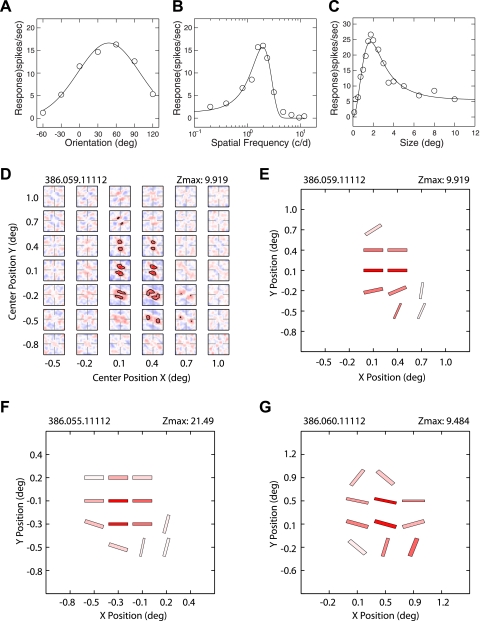
A subset of V2 neurons showed far more complex receptive field spatial profiles (Fig. 3). The spatial matrix of subfields for the unit in Fig. 3D showed highly inhomogeneous local sensitivities to stimulus orientations and spatial frequencies within its receptive field. The preferred orientation of the subfield with the maximum Z score was 0 deg, and the preferred spatial frequency was 1.3 cycles/deg. More importantly, the maximum orientation difference between a pair of subfields for this neuron was 83 deg, nearly orthogonal to each other (Fig. 3E). In response to grating stimuli, this V2 neuron had a relatively broad orientation tuning, having the preferred orientation at 48.0 deg (Fig. 3A). The preferred spatial frequency was 1.95 cycles/deg (Fig. 3B), and its receptive field center size was 1.8 deg in diameter (Fig. 3C). In contrast to the unit in Fig. 2, the preferred orientation and spatial frequency of the subfield with the maximum Z score were substantially different from the neuron's responses to gratings. Therefore, we measured the weighted sum of the subfield preferred orientations and spatial frequencies to determine if the weighted sum can correlate better with the preferred orientation and spatial frequency measured with gratings. We calculated the weighted sum of the subfield's preferred orientations by using a vector summation method; we determined a vector for each subfield using its Z score (value) and orientation (direction), and summing all vectors across subfields gave the “weighted” preferred orientation for the unit. The weighted sum of the preferred spatial frequencies of subfields was calculated by initially multiplying the preferred spatial frequency of each subfield with its Z score and then summing across the matrix of the unit. We divided this sum by the sum of Z scores. The weighted sums of the preferred orientations and spatial frequencies of the subfields for this neuron were 41.0 deg and 1.48 cycles/deg, respectively, both of which were very similar to the preferred orientation and spatial frequency of the unit measured with gratings. Finally, the schematic diagrams of subfield matrices in Fig. 3, F and G, show additional examples of the units exhibiting a broad range of preferred orientations and spatial frequencies among their facilitatory subfields.
Fig. 3.
Spatial matrix of subfields with facilitatory profiles in a V2 neuron that exhibited substantial inhomogeneity of orientation tuning within its receptive field. A–C: selectivity to the orientation (A), SF (B), and size (C) measured using sinusoidal grating stimuli (temporal frequency 3.1 Hz; contrast 80%). D: spatial matrix of subfields with facilitatory profiles of the unit. E: schematic diagram showing the preferred orientation (bar angle) and SF (width) and the maximum Z scores (saturation) of the subfields illustrated in D. F and G: schematic diagrams of the facilitatory subfields in 2 additional V2 neurons that showed relatively high spatial inhomogeneity.
Distribution of the orientation and spatial frequency differences.
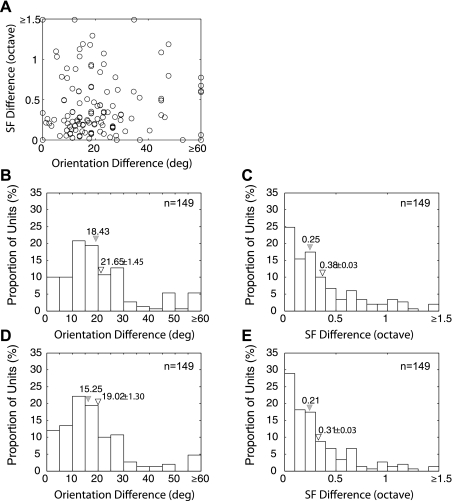
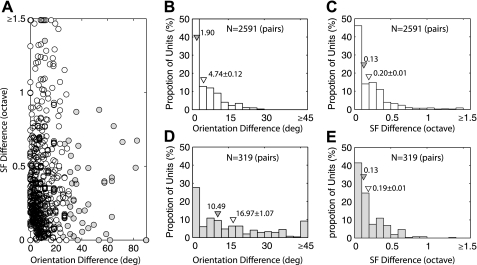
To quantify the degree of homogeneity in the matrix of subfields, we first analyzed the local variations in optimal orientation and spatial frequency between subfields with facilitatory profiles by calculating the largest difference between any pair of subfields (149 pairs in 149 units) (Nishimoto et al. 2006) (Fig. 4). Figure 4A plots the orientation difference as a function of the spatial frequency difference for each comparison. The majority of neurons had relatively small variations in both orientation and spatial frequency. For example, 61% of all pairs showed the orientation differences that were smaller than 20 deg (Fig. 4B), whereas 74% of all neurons had the spatial frequency differences less than 0.5 octaves (Fig. 4C). If we compare the largest differences for all neighboring pairs, the differences between pairs of subfields are similar but slightly smaller (Fig. 4, D and E). Although the facilitatory subfields in the majority of V2 neurons showed a relatively high homogeneity, over 20% of all neurons showed substantial inhomogeneities in their response profiles; the maximum orientation differences between neighboring facilitatory subfields were greater than 25 deg, and a small subset of neurons (5%) showed the orientation difference greater than 60 deg (e.g., Figs. 3, 4B, and 4D). These neurons could potentially show a higher sensitivity to angled or curved luminance elements in complex visual stimuli.
Fig. 4.
Spatial homogeneity of local spectral selectivity maps with facilitatory profiles across the receptive fields. A: maximum orientation differences between a pair of subfields within each neuron vs. SF differences. B: histogram illustrating the distribution of the maximum orientation differences (149 pairs). C: distribution of the maximum SF differences (149 pairs). D: distribution of the maximum orientation differences between neighboring pairs of subfields (149 pairs). E: distribution of the maximum SF differences between neighboring pairs of subfields (149 pairs). Filled inverted triangles indicate median values, and open inverted triangles indicate means ± SE.
The finer details of the relationship between neighboring subfields for a given receptive field, hence an analysis of its finer receptive field spatial structure, can be obtained by comparing the preferred orientation and spatial frequency of all possible neighboring pairs of subfields within a single matrix (Fig. 5). The overwhelming majority of the pairs showed orientation differences between neighboring subfields that were smaller than 10 deg and a spatial frequency difference less than 0.5 octaves (Fig. 5A). This result suggests that the receptive fields of most V2 neurons are made up of remarkably homogeneous V1 inputs. Interestingly, if the maximum difference in the preferred orientation between any pair of subfields for a given neuron was greater than 30 deg, the rest of the subfield pairs for the same neuron also had greater orientation differences, i.e., showed a more inhomogeneous subfield matrix (compare Fig. 5B with Fig. 5D). The spatial frequency differences were unaffected by this analysis (compare Fig. 5C with Fig. 5E).
Fig. 5.
Spatial homogeneity of local spectral selectivity maps with facilitatory profiles across the receptive fields. A: orientation differences between all pairs of neighboring subfields for all 149 units vs. SF differences. Filled circles indicate the subfield pairs of the unit where the maximum differences were >30 deg in preferred orientations. B: distribution of the orientation differences between all pairs of neighboring subfields for 149 units in which the maximum orientation difference for each unit was <30 deg. C: distribution of the SF differences between all pairs of neighboring subfields for 149 units in which the maximum orientation difference for each unit was <30 deg. D: distribution of the orientation differences between all pairs of neighboring subfields for 149 units in which the maximum orientation difference for each unit was ≥30 deg. E: distribution of the SF differences between all pairs of neighboring subfields for 149 units in which the maximum orientation difference in each unit was ≥30 deg. Filled inverted triangles indicate median values, and open inverted triangles indicate means ± SE.
Relationships between LSRC subfield responses and responses to gratings.
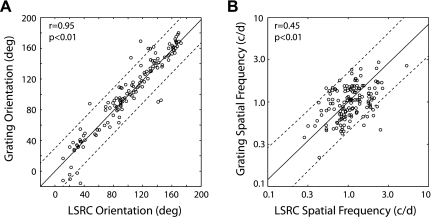
The preferred orientation and spatial frequency of the subfield for a given V2 neuron did not substantially differ from the preferred orientation and spatial frequency for the same neuron determined with grating stimuli (Fig. 6). We calculated the weighted sum of the preferred orientations and spatial frequencies of subfields using the method described above. The correlation for the preferred orientation between the two measurements was relatively strong (r = 0.95, P < 0.01), and except for a few units, the data points rarely fell out of the 95% confidence interval for the fitted regression line (Fig. 6A). The similar correlation for the preferred spatial frequency was weaker (r = 0.45, P < 0.01) (Fig. 6B). Nevertheless, these data support the idea that to a first approximation, the neuron's preferred orientation and spatial frequency are primarily determined by a weighted sum of the local sensitivities (subfields) for stimulus orientation and spatial frequency within the receptive field central regions (e.g., Anzai et al. 2007).
Fig. 6.
Comparisons of the preferred orientation and SF measured with drifting gratings and the LSRC method. A: preferred orientation of subfields measured with the weighted sum of all subfields in a give unit vs. preferred orientation measured with gratings. B: preferred SF of subfields with the weighted sum of all subfields in a given unit vs. preferred SF measured with gratings. Dotted lines above and below the unity line represent the 95% confidence interval of the fitted regression line.
Orientation anisotropy of subfields.
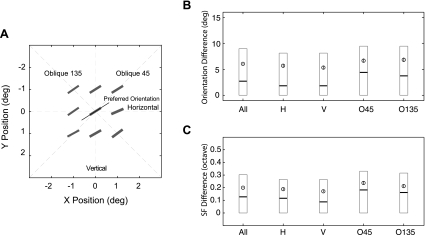
We next analyzed all possible pairs of subfields along each of the four major axes of the spatial matrix, i.e., vertical, horizontal, and two oblique orientations (Fig. 7). We classified each unit according to its preferred orientation into one of the four major primary orientation categories (±22.5 deg) (Fig. 7A). We then determined the largest orientation and spatial frequency differences between adjacent subfields for the unit. This analysis was designed to reveal any consistent inhomogeneity of the subfield map in the four primary orientations (anisotropy). The most important finding was that the receptive fields of those units preferring vertical or horizontal orientation (“cardinal” orientations) had significantly smaller orientation or spatial frequency differences between subfields than units preferring oblique orientations (Wilcoxon rank-sum test, P < 0.001 for orientation and P < 0.001 for spatial frequency) (Fig. 7, B and C). This result suggests that the overall sensitivity of V2 neurons could be potentially higher for vertically or horizontally oriented contour stimuli than for obliquely oriented contours, i.e., the “oblique effects” (Girshick et al. 2011; Li et al. 2003). Also, the result suggests that besides a higher prevalence of V1 neurons preferring the cardinal orientations (Chapman and Bonhoeffer 1998; De Valois et al. 1982; see Li et al. 2003 for a comprehensive review), there appears to be a novel cortical mechanism underlying the oblique effects. More specifically, the convergence of V1 inputs is more orderly in those V2 neurons preferring the vertical or horizontal orientation than in those tuned to oblique orientations.
Fig. 7.
Spatial homogeneity of subfields with facilitatory profiles along 4 major orientation axes. A: analysis method for a representative V2 neuron. The preferred orientation and spatial frequency of subfields are illustrated with short bars, and the preferred orientation of the unit determined with grating stimuli is shown with a thin line. B: statistics of the orientation difference in each major axis. Open circles and vertical bars represent means ± SE. Each box represents the 3-quartile range with each horizontal bar representing a quartile value. C: statistics of the SF difference in each major axis.
Local Spectral Selectivity Maps With Suppressive Profiles
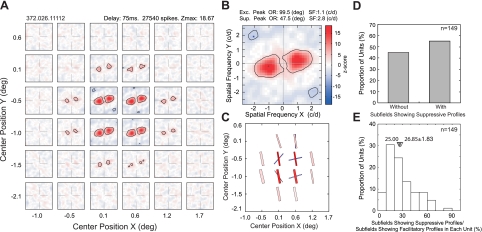
Contrary to the striate cortex of cats (Nishimoto et al. 2006), the majority of V2 neurons in macaque monkeys had suppressive response profiles along with facilitatory profiles (Fig. 8). Figure 8A shows a typical spatial matrix of a V2 neuron containing both suppressive (blue) and facilitatory profiles (red). The preferred orientations of 12 facilitatory subfields of this neuron were very similar with one exception in a peripheral location (Fig. 8, A and C). The preferred orientations of three suppressive profiles substantially differed from those for facilitatory profiles; in two cases, the relationship between facilitatory and suppressive profiles was nearly orthogonal, and in the subfield with the maximum Z score, the orientation difference was 52 deg (Fig. 8, B and C). However, there were two suppressive subfields that showed orientation preference similar to those for facilitatory subfields (Fig. 8, A and C). The preferred spatial frequency for the suppressive profile with the maximum Z score for this neuron (2.8 cycles/deg) was higher than that for the corresponding facilitatory profile (1.1 cycles/deg) (Fig. 8B). Fifty-five percent of 149 V2 neurons that we examined contained suppressive profiles (Fig. 8D). However, for a given neuron, the number of suppressive profiles was smaller than the number of facilitatory profiles (see below) (Fig. 8E).
Fig. 8.
A representative V2 neuron having subfields with both facilitatory and suppressive profiles. A: representative spatial matrix of subfields with both profiles. B: detailed profile of the subfield with the maximum Z scores. Location of the highest and lowest Z scores is indicated with asterisks. C: schematic diagram of the preferred orientations (bar angles) and SF (widths) of subfields with the facilitatory (red) and suppressive profiles (blue). D: proportion of V2 neurons having subfields with facilitatory profiles alone (left) or with both facilitatory and suppressive profiles (right). E: proportion of V2 neurons having different percentages of subfields with suppressive profiles relative to those without. Filled inverted triangle indicates median value, and open inverted triangle indicates mean ± SE.
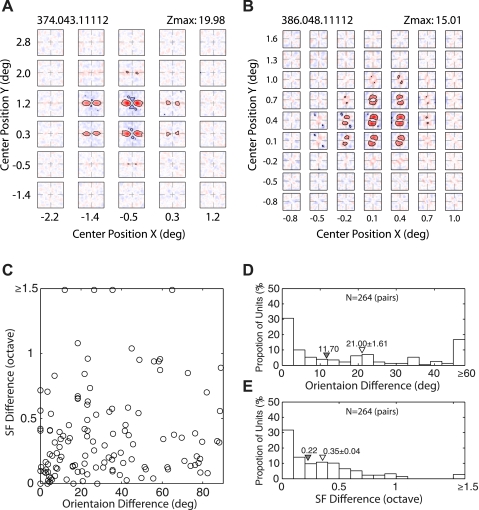
One of the more important differences between the suppressive and facilitatory profiles was that the homogeneity of the suppressive subfields was substantially lower than that of the facilitatory subfields (Fig. 9). The spectral maps in Fig. 9, A and B, illustrate the two additional examples of V2 neurons that exhibited complex spatial profiles of suppression. The suppressive subfields of the unit in Fig. 9A showed the widely different preferred orientations and spatial frequencies, whereas the spatial profiles of its facilitatory subfields were quite homogeneous. In contrast, the unit in Fig. 9B showed the heterogeneous spatial profiles in both suppressive and facilitatory subfields.
Fig. 9.
Spatial inhomogeneity of local spectral selectivity maps for suppressive profiles. A: example of the V2 neuron having subfields with homogeneous facilitatory profiles and inhomogeneous suppressive profiles. B: example of the V2 neuron having subfields with both inhomogeneous facilitatory and suppressive profiles. C: orientation differences vs. SF differences for all possible pairs of suppressive subfields. D: distribution of the orientation differences among subfields. E: distribution of SF differences. Filled inverted triangles indicate median values, and open inverted triangles indicate means ± SE.
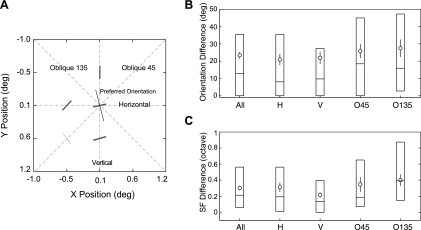
Comparisons of 264 neighboring pairs revealed a wide range of orientation differences among suppressive subfields (Fig. 9C). The median orientation difference was 11.7 deg (Fig. 9D) compared with 2.73 deg for facilitatory profiles (Fig. 5B), and this difference was statistically significant (Wilcoxon rank-sum test, P < 0.001). As with facilitatory profiles, there was substantial variations in the preferred spatial frequency of suppressive profiles, and the spatial frequency differences for the suppressive profiles were significantly greater than those for the facilitatory profiles (compare Fig. 9E with Fig. 5C) (Wilcoxon rank-sum test, P = 0.035). In a related matter, the homogeneity along the four major orientation axes for suppressive subfields showed similar anisotropy to those for facilitatory subfields: smaller differences for the vertical and horizontal orientations. However, this difference was not statistically significant (Wilcoxon rank-sum test, P = 0.12 for orientation and P = 0.21 for spatial frequency) (compare Fig. 10 with Fig. 6).
Fig. 10.
Spatial homogeneity of subfields with suppressive profiles along 4 major orientation axes. A: analysis method for a representative V2 neuron. Orientation and SF of subfields are illustrated with short bars, and the preferred orientation of the neuron determined with grating stimuli is shown with a thin line. B: statistics of the orientation difference in each major axis. Open circles and vertical bars represent means ± SE. Each box represents the 3-quartile range with each horizontal bar representing a quartile value. C: statistics of the SF difference in each major axis.
Relationships Between Suppressive and Facilitatory Profiles
Activation strengths.
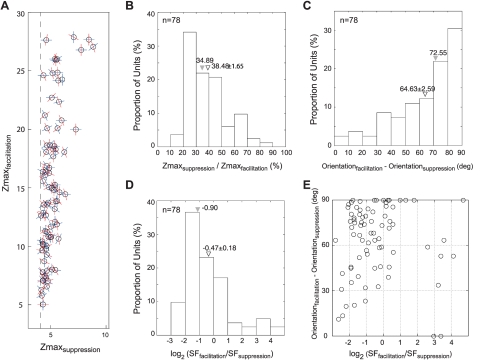
What are the relationships between the facilitatory and suppressive profiles in those individual subfields having both profiles? Figure 11A plots the Zmax value (defined as the highest z score for a given neuron) and the preferred orientation of the facilitatory (red) and suppressive profiles (blue) that had the highest plus or minus Z scores, respectively. The Zmax values for facilitatory profiles were always higher than those for paired suppressive profiles. However, the subfields with higher Zmax values for facilitatory profiles also had tendency to show higher Zmax values for suppressive profiles (higher negative Z scores) (r = 0.59, P < 0.001). The frequency histograms in Fig. 11B shows that over 80% of the subfields with both profiles had Zmax values for their suppressive profiles that were less than one-half of Zmax values for their facilitatory profiles.
Fig. 11.
Relationships between the suppressive profiles and the facilitatory profiles of subfields for individual V2 neurons. A: differences in Zmax values. For each neuron, the X value represents the Z score from the subfield with the maximum suppressive strength (Zmaxsuppression) and the Y value represents the Z score from the subfield with the maximum facilitatory strength (Zmaxfacilitation). Red bars represent the optimal orientation for the facilitatory profile, and blue bars represent the orientation of the suppressive profiles. Dashed line represents the Z score for suppressive profiles that was statistically significant (P < 0.05). B: distribution of the ratios of maximum suppressive Z scores over maximum facilitatory Z scores. C: distribution of differences in the preferred orientation of subfields between facilitatory and suppressive profiles. D: distributions of the preferred spatial frequency differences. E: scatter plot illustrating the distribution of the differences between the suppressive profiles and facilitatory profiles of subfields in individual neurons (i.e., a joint plot of information shown in C and D). Each circle represents a single V2 neuron. Filled inverted triangles indicate median values, and open inverted triangles indicate means ± SE.
Orientation and spatial frequency differences between facilitation and suppression.
Another clear and potentially more significant relationship in Fig. 11A was that in a relatively large percentage of subfields, the preferred orientation of the suppressive profile was very different from that for the facilitatory profile. Over 30% of all subfields showed orientation differences between 80 and 90 deg, and a little over 70% had orientation differences greater than 50 deg (Fig. 11C). These relationships between facilitatory and suppressive subfield profiles in the majority of V2 neurons resemble classical cross-orientation suppression in V1 neurons (e.g., Allison et al. 2001; Bonds 1989, 1991; DeAngelis et al. 1992; Heeger 1992; Kimura and Ohzawa 2009; Malone and Ringach 2008; Morrone et al. 1987; Ringach et al. 2002; Somers et al. 1995; Willmore et al. 2010). However, it should be noted that about 10% had similar preferred orientations and nearly 20% showed mildly different orientation differences (<50 deg) (see below for discussion of the interpretation of suppressive vs. facilitatory profiles). The homogeneity of facilitatory subfields in those units having suppressive subfields was not significantly different from that in those units without suppressive subfields; the median orientation differences were 18.4 deg for the units without suppression and 14.7 deg for those with suppression (Wilcoxon rank-sum test, P = 0.48).
With respect to the spatial frequency differences between the suppressive and facilitatory profiles, the preferred spatial frequencies of suppressive profiles were substantially higher than those of facilitatory profiles in the great majority of subfields. For example, 70% of the subfields with both profiles had suppressive profiles that had higher preferred spatial frequencies than their paired facilitatory profiles (Fig. 11D). This relationship is more clearly seen in Fig. 11E, where the orientation differences between the suppressive profiles and facilitatory profiles are plotted as a function of the spatial frequency differences. A significant proportion of the subfields (88%) showed relatively higher spatial frequencies for suppressive profiles; only 10 subfields exhibited facilitatory profiles that showed substantially higher spatial frequencies than their suppressive profiles. This result in V2 neurons substantially differs from the “delayed” suppression in V1 neurons “that are centered at low spatial frequencies” (Malone and Ringach 2008).
Timing of peak facilitatory and suppressive responses.
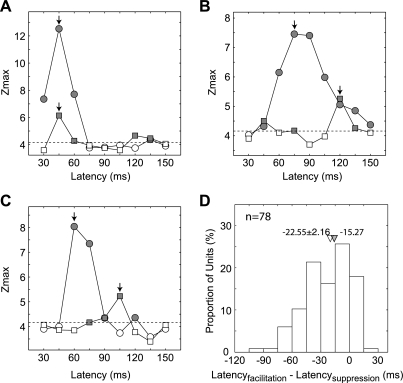
Another important relationship between the facilitatory and suppressive profiles of subfields was in their dynamics; specifically, the timing (correlation delays) of the peak responses between the two profiles was quite different. To quantify this relationship, we measured the Zmax value for the facilitatory and suppressive profile at all correlation delays between 30 and 150 ms in 15-ms steps. We then looked for the correlation delay at which the highest Z score was located for facilitatory and suppressive profiles. Each neuron had a different pattern of correlation delays. For example, the neuron in Fig. 12A did not show any difference in correlation delays between facilitatory and suppressive profiles (45 ms). The neuron in Fig. 12B had a substantially longer delay for the suppressive profiles (40–45 ms), although its facilitatory profiles were still present at the maximal delay for the suppressive profiles. The neuron in Fig. 12C was unique in that at the optimal delay for the facilitatory profiles (60 ms), it did not exhibit a suppressive profile. Moreover, at the optimal delay for the suppressive profiles (105 ms), the unit showed no facilitatory profile.
Fig. 12.
Differences in correlation delays (latency) between the facilitatory and suppressive subfields. A–C: examples of correlation delays. The Zmax values are shown at different delays for facilitatory (circles) and suppressive profiles (squares). Filled data points signify Zmax values that are significant. Arrows indicate the latency at which the peak response occurred for the facilitatory and the suppressive profiles, respectively. D: distribution of the differences in correlation delays (latency) between facilitatory and suppressive subfields. Filled inverted triangle indicates median value, and open inverted triangle indicates mean ± SE.
Figure 12D shows the distribution of the optimal delay differences between the subfield profiles (facilitatory − suppressive). The most notable result was that the correlation delay for the Zmax value (“latency”) for suppressive profiles was considerably longer than that for facilitatory profiles. Specifically, the majority of units (67%) with both subfield profiles had longer correlation delays for suppressive profiles than for facilitatory profiles (the median difference was 21 ms). In only 3% of all neurons, the delay was shorter for the suppressive profiles; 33% had nearly equal optimal correlation delays for both subfield profiles. Note that we calculated spike-triggered averages of stimulus local spectra for correlation delays from 0 to 150 ms in 15-ms steps, and then determined the optimal correlation delay as the delay for which the signal amplitude was maximal (maximal Z score) (Nishimoto et al. 2006). This means that the “actual” timing between the two profiles in each unit could be off by ±7.5 ms (see below for more discussion of the interpretation of the correlation delays between facilitatory and suppressive profiles).
Relationships Between Subfield Suppression and Receptive Field Properties Determined With Gratings
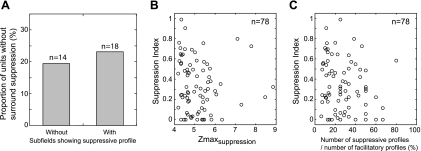
The source of suppressive profiles of V2 subfields is not known. We examined whether those neurons having strong surround suppression as revealed by grating stimuli showed a more robust group of subfields with suppressive profiles (Fig. 13). V2 neurons without measurable surround suppression had a nearly equal percentage of suppressive subfields to those that failed to show surround suppression (Fig. 13A) (χ2 test, P > 0.6). Moreover, the suppression index (the strength of surround suppression) for a given neuron obtained from its area summation function had little consistent relationship to its suppressive Zmax value (Fig. 13B) or to the ratio of suppressive to facilitatory subfields (Fig. 13C). These results suggest that the source of suppressive profiles may not be entirely explained by the mechanisms supporting receptive field surround suppression in V2 neurons.
Fig. 13.
Relationships between receptive-field surround suppression and subfields with suppressive profiles. A: proportion of units without surround suppression and having subfields with or without suppressive profiles. B: scatter plot relating suppression index of a neuron as a function of its Zmax value of suppressive subfields. C: scatter plot relating suppression index of a neuron as a function of its number of suppressive profiles relative to facilitatory profiles.
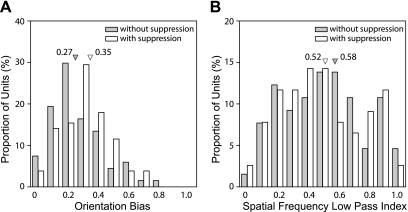
The local inhibitory connections in macaque V1 are known to sharpen a neuron's orientation selectivity (Ringach et al. 2002; Ringach 2007). We examined whether V2 neurons with suppressive subfields show sharper orientation tuning when measured with grating stimuli (Fig. 14A). Those V2 neurons that contained suppressive profiles in their subfields had significantly better orientation selectivity, i.e., exhibiting higher orientation biases to grating stimuli (Wilcoxon rank-sum test, P < 0.05). Finally, the spatial frequency tuning of V1 neurons is also influenced by local inhibitory connections, which mainly affect the low spatial frequency range (Ringach et al. 2002). We examined whether similar relationships are present in macaque V2. Unlike the orientation selectivity of V2 neurons in this study and what was expected from the previous results in V1, the spatial frequency tuning characteristics of macaque V2 neurons that had subfields with suppressive profiles were not different from those of neurons without suppressive subfields (Fig. 14B) (Wilcoxon rank-sum test, P > 0.6).
Fig. 14.
Relationships between suppressive subfields and orientation and SF tuning. A: distribution of orientation bias of neurons with suppressive subfields (open bars) and without (filled bars). Median values are indicated by inverted triangles. B: distribution of SF low-pass index of neurons with suppressive subfields (open bars) and without (filled bars). SF low-pass index was calculated using the following formula: SF low-pass index = R0/Rpeak, where R0 is the response at the lowest SF tested and Rpeak is the response at the optimal SF (Ringach et al. 2002). Median values are indicated by inverted triangles.
DISCUSSION
Several new results emerged from this study. The spatial matrix of subfields with facilitatory profiles of macaque V2 neurons had relatively high homogeneity, although a subset of neurons exhibited notable inhomogeneity. Over 50% of V2 receptive fields had subfields with suppressive profiles that differed widely in preferred orientation and spatial frequency from those for facilitatory profiles. The neurons preferring horizontal or vertical orientations showed less inhomogeneity in space than the neurons preferring oblique orientations. V2 neurons having suppressive profiles were more selective to stimulus orientations than those without suppressive subfields. The preferred spatial frequency of suppressive profiles was generally higher than that for facilitatory profiles, and the suppression tended to occur with longer delays than the facilitation.
Methodological Considerations
Sensitivity of the LSRC analysis.
A potential limitation of LSRC could be how high density one can make the subfield matrix. The window size depends on the spatial frequency tuning of a unit and the SD of the Gaussian window used for computing the spectrum at each window location. If the window size is too small, we could not acquire proper response profiles for low spatial frequency spectra, whereas if the window size is too large, we would lose spatial resolution (Nishimoto et al. 2006). The advantage of using LSRC is that we can choose the position, size, and steps of the Gaussian window after recording to calculate the optimal values for each unit. Therefore, we carefully optimized the number of position/spacing for each unit depending on the spatial frequency tuning of the unit (see materials and methods). A previous study that characterized the receptive field structure of V2 neurons set the number and location of stimulus patches (hence “subfields”) within a given receptive field during recording and therefore could not be varied or optimized during the data analysis (Anzai et al. 2007). The average density of the subfield matrix in our study, e.g., the window size and subfield separation, is estimated to be comparable to or better than the grid resolution used in Anzai et al. (2007). Overall, the sensitivity of the LSRC method should be greater than in previous studies of V2 receptive field profiles (e.g., Anzai et al. 2007; Ito and Komatsu 2004; see below).
Another analysis tool we considered to reveal subfields was the spike-triggered covariance (STC) technique (Rust et al. 2005; Touryan et al. 2002). There are two main reasons why we employed LSRC for our study rather than STC. First, although both STC and LSRC use white noise stimuli and are capable of revealing filtering profiles of a neuron, the LSRC is more efficient because it requires far fewer spikes. STC needs far more spikes to obtain reasonable signals because it belongs to a class of second-order approximations. On the other hand, LSRC is essentially a first-order approximation of filtering properties and hence requires far fewer spikes (Nishimoto et al. 2006). In other words, if you need a reasonable number of sample units from each subject, LSRC is a better choice. Second, STC assumes that the receptive fields can be characterized using a small number of discrete orthogonal bases, whereas LSRC does not have that kind of assumption and tries to characterize the receptive fields in a rather continuous manner. For our purpose of testing potential (continuous) curvature selectivity, the LSRC method is more advantageous.
Interpretation of the spectral maps with suppressive profiles.
The LSRC calculates the net sum of facilitation and suppression for each frequency and therefore can only visualize whichever is stronger (Nishimoto et al. 2006). The interpretation of the relationship between suppressive and facilitatory profiles in terms of the cortical mechanisms generating the suppression is not unambiguous. For instance, the preferred orientations of suppressive profiles relative to that of the facilitatory profiles in the same matrix of a unit (Fig. 8) may be interpreted as follows: 1) the suppressive effects exist for all orientations of the frequency range overlapped to the facilitatory one, or 2) they exist just for orientations nearly orthogonal to the optimal orientation for facilitatory profiles. These possibilities cannot be distinguished using the LSRC method. Similarly, the delay in appearance of suppressive profiles (Fig. 12) may reflect 1) the delayed onset of the suppressive effects or that 2) suppressive effects “decay more slowly.” The LSRC analysis cannot distinguish these two possibilities. Either of these issues (“masking effects” in preferred orientations or delays) is not a problem unique to the LSRC analysis but is a general problem of the extracellular recording. However, it is important to keep in mind that the “summed” information is represented in spiking output of neurons and thus is transmitted to the next neurons in the cascade of cortical processing. The data on suppression (e.g., Figs. 11 and 12) are therefore very informative with respect to how V2 neurons process information over space and time by spiking activity.
Joint information of preferred orientation and spatial frequency of subfields.
One of the advantages of using LSRC is that it is capable of revealing the response profiles that were not detectable with simple luminance stimuli such as small gratings optimized for a unit's spatial frequency (e.g., Anzai et al. 2007) or angled luminance bars (e.g., Ito and Komatsu 2004). Each subfield in our LSRC analysis contains information about its preferred orientation but also its preferred spatial frequency that may differ substantially from other subfields. In this regard, two new observations are notable: 1) the correlation between the preferred orientation of subfields and the preferred orientation measured with gratings was tighter than the correlation for the preferred spatial frequency (Fig. 6), and 2) in V2 neurons having both suppressive and facilitatory profiles, the preferred spatial frequencies of suppressive profiles were substantially higher than those of facilitatory profiles in the great majority of subfields (Fig. 11D). These results are consistent with the recent idea that “the suppressive mechanisms in V2 are tuned for specific spatial features present in natural images” that contain a wide range of orientation and spatial frequency information (Willmore et al. 2010). This sort of “tuned” suppression is rare in the striate cortex (Nishimoto et al. 2006; Willmore et al. 2010; also see below for more discussion).
Comparisons to Previous Studies
Proportions of V2 units that may show a higher sensitivity to “complex stimuli.”
A little over 20% of all V2 neurons in this study showed maximum orientation differences between neighboring subfields that were greater than 25 deg (Fig. 4). These neurons could potentially exhibit higher sensitivities to local line components embedded in small restricted areas of complex stimuli that differ in orientations as reported in previous studies (e.g., Anzai et al. 2007; Ito and Komatsu 2004). However, we found only 5% of units that had the largest orientation differences between a pair of subfields greater than 60 deg compared with nearly 30% of the samples in the study of Anzai et al. This difference could not be attributed to the sensitivity of our LSRC method, because LSRC, which simultaneously stimulates the area three times larger than the unit's receptive field center, should more easily overcome both the high threshold for spiking and relatively large nonlinearities of V2 neurons, rather than stimulating a small part of receptive fields with a patch of grating flashed for 40 ms as in the study of Anzai et al. Considering the comparable sample size and cell type in the two studies (136 complex cells in Anzai et al. and 149 complex cells in our study), differences in sampling methods, e.g., variations in recording sites with respect to cortical layers and/or cytochrome oxidase stripes, may have, at least in part, contributed to the differing results. Stimulus-dependent nonlinearity or adaptation effects (David et al. 2004; Felsen et al. 2005; Sharpee et al. 2006) could also have contributed to the apparent differences. Regardless, it is important to emphasize that 60–70% (Anzai et al. 2007) and 80% (this study) of V2 neurons had facilitatory “subfields” that had similar preferred orientations throughout the receptive fields.
Response profiles.
Direct comparisons of the detail response profiles of V2 neurons between this study and the previous studies are difficult, if not impossible, because the methodology (stimuli and/or computation, anesthetized or awake animals) is quite different between the studies, and also a detailed description of response profiles are lacking in some of the previous studies. For instance, Willmore et al. (2010) presented natural images as stimuli and used them to regularize regressions to reveal response profiles. They concluded that V2 has more tuned suppressions than V1, but they did not provide extensive descriptions or figures of actual receptive field profiles. In the study of Anzai et al. (2007), small circular gratings of various orientations were rapidly presented at 1 or 2 of the 19 locations over the area slightly bigger than the unit's classical receptive field. As mentioned earlier, the overall stimulus energy at any moment is relatively weak, and therefore it is difficult to directly compare their results with the response profiles that are obtained using broadband stimuli (e.g., natural images or white noise). In the study of Ito and Komatsu (2004), the “angle stimuli” were a combination of two straight lines that formed angles at the center of the receptive field and extended out into the receptive field surround. Although about 25% of V2 units responded quite selectively to a particular angle, there is no actual description of the response profiles within the receptive fields to explain such selectivity.
Surround effects.
The increased sensitivities of V2 neurons to angled or curved contours may be explained by their receptive field surround mechanisms that can pool local feature information over a larger range of space (e.g., Das and Gilbert 1999; Hubel and Wiesel 1965). We found no direct link between surround suppression index obtained by annular surround stimuli and the prevalence or the strength of suppressive subfields (Fig. 13). However, unlike the surround effect measured with annular surround stimuli (suppression index), we previously found that spatially restricted surround stimulations of V2 neurons can enhance or suppress center responses depending on the orientation, contrast, and/or location of spatially restricted surround stimuli (Zhang et al. 2008). Similar asymmetries in surround effects have been described for neurons of cat area 17 (DeAngelis et al. 1994; Kimura and Ohzawa 2009; Tanaka and Ohzawa 2009; Walker et al. 1999) and monkey V1 (Cavanaugh et al. 2002a), although these effects were all suppressive in nature (but see Tanaka and Ohzawa 2009). This sort of local differences in the center-surround interactions previously observed in macaque V2 and in cat area 17 (Tanaka and Ohzawa 2009) may be an additional mechanism for pooling local feature information over an extended range of space that would enable a V2 neuron to encode “angles” between neighboring stimulus elements. El-Shamayleh and Movshon (2011) recently proposed a potential involvement of “inhomogeneous” surround suppression in encoding texture-defined form by extrastriate neurons.
V2 versus V1.
There is no comparable study of the receptive field spatial structure of V2 neurons using the LSRC analysis for macaque V1. The original LSRC study by Nishimoto et al. (2006) analyzed neurons of cat area 17 and some units in area 18. Comparisons of the population summary of cat area 17 neurons (their Fig. 6) with the present results from macaque V2 (Fig. 4) show that our V2 spectral maps of subfields are less homogeneous than those in cat area 17. In cat area 17, only 7% of units, compared with 40% of macaque V2 neurons in this study, showed the maximum orientation differences between any pair of subfields that were greater than 20 deg (Fig. 4B). Moreover, the maximal spatial frequency difference between a pair of any subfields of neurons in cat area 17 was far smaller than that for V2 units in our monkeys. Incidentally, the study in cats reported that there was no significant difference between areas 17 and 18 with respect to the receptive field homogeneity. However, since area 18 in cats receives direct Y-cell inputs from the lateral geniculate nucleus (LGN), the comparison of macaque V2 with feline area 18 with respect to the response characteristics of subunits or filter properties here may not be appropriate.
Another important difference between the two studies of the subfields is that in cat area 17 (and 18), only 10 of 193 cells (5.2%) had suppressive profiles, whereas in macaque V2, over 50% of 149 neurons had suppressive profiles. These differences between V2 and V1, if the species difference can be ignored, suggest that the spatial structural organization of V2 receptive fields, revealed by the LSRC method, is more complex than that of V1 neurons. Importantly, the proportion of V2 neurons that showed suppression in this study was similar to the percentage of V2 neurons having tuned suppression in previous studies (slightly over 50%) (Schmid et al. 2009; Willmore et al. 2010).
It was proposed that the presence of tuned suppression in receptive fields plays a critical role in the emergence of selectivity in V2 neurons for complex stimulus features that is not extensively present in V1 neurons (Willmore et al. 2010). Our results on suppressive profiles (Figs. 9 and 11) are generally in agreement with the conclusion of their study. We also found that suppressive profiles cover a broad range of preferred orientations and spatial frequencies within a single receptive field. This heterogeneous array of suppressive profiles of a V2 unit could interact with its facilitatory profiles that show high homogeneity, thus altering their preferred orientations of the spiking output signals from these “homogeneous” facilitatory subfields. Consequently, the spatial response profile of the neuron determined by spiking output signals could become more heterogeneous.
Ringach and colleagues (Ringach et al. 2002; Malone and Ringach 2008) showed a relatively high prevalence of response suppression in V1 neurons that had different dynamics than response enhancement, with the emergence of suppression being relatively delayed. We also found longer delays to peak responses in subfields of V2 neurons with suppressive profiles relative to those in facilitatory profiles (Fig. 12). As mentioned above, the LSRC analysis does not detect suppression “masked” by stronger facilitation. However, our LSRC analysis revealed V2 representation that is transmitted to the next neuron, and we compared the delay time between the facilitatory and suppressive subfields at the respective maximum activation. Our results are also consistent with the earlier observations made in macaque V2 using a different analysis method (Schmid et al. 2009).
The orientation and spatial frequency tuning functions of V1 neurons were sharper in those units suppressed by nonoptimal stimuli (e.g., Ringach et al. 2002). We also found that those V2 neurons with suppressive profiles exhibited better orientation selectivity (orientation bias) than those without suppressive profiles (Fig. 14A). Why do V2 neurons with suppressive subfields show better orientation selectivity than those without? One possibility is that signals from V1 are better tuned; V1 neurons with the presence of suppression mechanism exclusively converge onto a single V2 neuron and therefore exhibit sharper tuning (Malone and Ringach 2008; Ringach et al. 2002; but see Willmore et al. 2010). Alternatively, the intrinsic local inhibitory network can improve the orientation selectivity of a V2 neuron by suppressing responses to nonpreferred orientation (i.e., similar to cross-orientation suppression). Also, V2 neurons with greater orientation selectivity may result from a more orderly spatiotemporal convergence of V1 inputs that may depend on the presence of suppressive mechanisms than more broadly tuned neurons. Obviously, these are not mutually exclusive and are likely to combine with different weights as suggested for V1 by Malone and Ringach (2008).
In a related matter, the cortical circuits generating the suppressive profiles of V2 neurons are difficult to isolate. In V1, suppression within a receptive field presumably originates from one or more of three known sources; feed-forward inhibitory input (e.g., Carandini et al. 2002; Freeman et al. 2002; Priebe and Ferster 2006), local intracortical inhibitory circuits underlying “cross-orientation suppression” (e.g., Albrecht and Geisler 1991; Carandini et al. 1997; DeAngelis et al. 1992; Heeger 1992; Kimura and Ohzawa 2008; Morrone et al. 1982; Williams and Shapley 2007), and long-range intrinsic or feedback connections (Angelucci et al. 2002; Cavanaugh et al. 2002a, 2002b; Ichida et al. 2007; Rust et al. 2005; Sceniak et al. 2001). Similar patterns of input for V2 neurons could exist: feed-forward inhibition that is a part of converging V1 inputs, local and long-range inhibitory network within V2, and feedback connections from higher-order visual areas. Again, these possibilities are not mutually exclusive.
Conclusions
The receptive fields of the majority of V2 neurons are made up of remarkably homogeneous V1 inputs, whereas a subset of V2 neurons exhibit relatively complex response profiles. More than one-half of V2 neurons contain heterogeneous suppressive subfields, and we speculate that such suppression plays an important role in the initial processing of complex stimulus features (Anzai et al. 2007; Willmore et al. 2010). Our results give new evidence for the view (e.g., El-Shamayleh and Movshon 2011; Rust and Stocker 2010; Willmore et al. 2010) that the complex features of visual scenes are “gradually,” instead of “abruptly,” processed in the multiple and successive stages along the hierarchy of extrastriate visual areas (also see Hegde and Van Essen 2007; Kobatake and Tanaka 1994; Willmore et al. 2010; Yamane et al. 2008). The present results caution against placing too much emphasis on a single extrastriate visual area such as V2 as a “site” where “encoding” of complex stimulus features takes place.
GRANTS
This work was supported by National Institutes of Health Grants R01 EY008128 (to Y. M. Chino), R01 EY003611 (to E. L. Smith III), and Core Grant P30 EY007551 (to E. L. Smith III and Y. M. Chino) and Ministry of Education, Culture, Sports, Science and Technology Grants-in-Aid for Scientific Research 22135006 and 22300110 (to I. Ohzawa).
DISCLOSURES
No conflicts of interest, financial or otherwise, are declared by the author(s).
AUTHOR CONTRIBUTIONS
Author contributions: X.T., B.Z., S.N., I.O., and Y.M.C. conception and design of research; X.T., B.Z., and Y.M.C. performed experiments; X.T., B.Z., and Y.M.C. analyzed data; X.T., B.Z., and Y.M.C. interpreted results of experiments; X.T., B.Z., and Y.M.C. prepared figures; X.T., B.Z., and Y.M.C. drafted manuscript; X.T., B.Z., E.L.S., S.N., I.O., and Y.M.C. edited and revised manuscript; X.T., B.Z., S.N., I.O., and Y.M.C. approved final version of manuscript.
REFERENCES
- Albrecht DG, Geisler WS. Motion selectivity and the contrast-response function of simple cells in the visual cortex. Vis Neurosci 7: 531–546, 1991 [DOI] [PubMed] [Google Scholar]
- Allison JD, Smith KR, Bonds AB. Temporal-frequency tuning of cross-orientation suppression in the cat striate cortex. Vis Neurosci 18: 941–948, 2001 [PubMed] [Google Scholar]
- Angelucci A, Levitt JB, Walton EJ, Hupe JM, Bullier J, Lund JS. Circuits for local and global signal integration in primary visual cortex. J Neurosci 22: 8633–8646, 2002 [DOI] [PMC free article] [PubMed] [Google Scholar]
- Anzai A, Peng X, Van Essen DC. Neurons in monkey visual area V2 encode combinations of orientations. Nat Neurosci 10: 1313–1321, 2007 [DOI] [PubMed] [Google Scholar]
- Arai T, Ohzawa I. Simulation analysis of transform domain reverse correlation in model neurons with position invariance in the visual cortex. Soc Neurosci Abstr 892–10, 2010 [Google Scholar]
- Bakin JS, Nakayama K, Gilbert CD. Visual responses in monkey areas V1 and V2 to three-dimensional surface configurations. J Neurosci 20: 8188–8198, 2000 [DOI] [PMC free article] [PubMed] [Google Scholar]
- Bonds AB. Role of inhibition in the specification of orientation selectivity of cells in the cat striate cortex. Vis Neurosci 2: 41–55, 1989 [DOI] [PubMed] [Google Scholar]
- Bonds AB. Temporal dynamics of contrast gain in single cells of the cat striate cortex. Vis Neurosci 6: 239–255, 1991 [DOI] [PubMed] [Google Scholar]
- Carandini M, Heeger DJ, Senn W. A synaptic explanation of suppression in visual cortex. J Neurosci 22: 10053–10065, 2002 [DOI] [PMC free article] [PubMed] [Google Scholar]
- Carandini M, Ringach DL. Predictions of a recurrent model of orientation selectivity. Vision Res 37: 3061–3071, 1997 [DOI] [PubMed] [Google Scholar]
- Cavanaugh JR, Bair W, Movshon JA. Nature and interaction of signals from the receptive field center and surround in macaque V1 neurons. J Neurophysiol 88: 2530–2546, 2002a [DOI] [PubMed] [Google Scholar]
- Cavanaugh JR, Bair W, Movshon JA. Selectivity and spatial distribution of signals from the receptive field surround in macaque V1 neurons. J Neurophysiol 88: 2547–2556, 2002b [DOI] [PubMed] [Google Scholar]
- Chapman B, Bonhoeffer T. Overrepresentation of horizontal and vertical orientation preferences in developing ferret area 17. Proc Natl Acad Sci USA 95: 2609–2614, 1998 [DOI] [PMC free article] [PubMed] [Google Scholar]
- Das A, Gilbert CD. Topography of contextual modulations mediated by short-range interactions in primary visual cortex. Nature 399: 655–661, 1999 [DOI] [PubMed] [Google Scholar]
- David SV, Vinje WE, Gallant JL. Natural stimulus statistics alter the receptive field structure of v1 neurons. J Neurosci 24: 6991–7006, 2004 [DOI] [PMC free article] [PubMed] [Google Scholar]
- DeAngelis GC, Freeman RD, Ohzawa I. Length and width tuning of neurons in the cat's primary visual cortex. J Neurophysiol 71: 347–374, 1994 [DOI] [PubMed] [Google Scholar]
- DeAngelis GC, Ohzawa I, Freeman RD. Spatiotemporal organization of simple-cell receptive fields in the cat's striate cortex. I. General characteristics and postnatal development. J Neurophysiol 69: 1091–1117, 1993 [DOI] [PubMed] [Google Scholar]
- DeAngelis GC, Robson JG, Ohzawa I, Freeman RD. Organization of suppression in receptive fields of neurons in cat visual cortex. J Neurophysiol 68: 144–163, 1992 [DOI] [PubMed] [Google Scholar]
- De Valois RL, Yund EW, Hepler N. The orientation and direction selectivity of cells in macaque visual cortex. Vision Res 22: 531–544, 1982 [DOI] [PubMed] [Google Scholar]
- El-Shamayleh Y, Movshon JA. Neuronal responses to texture-defined form in macaque visual area V2. J Neurosci 31: 8543–8555, 2011 [DOI] [PMC free article] [PubMed] [Google Scholar]
- Felsen G, Touryan J, Han F, Dan Y. Cortical sensitivity to visual features in natural scenes. PLoS Biol 3: e342, 2005 [DOI] [PMC free article] [PubMed] [Google Scholar]
- Freeman TC, Durand S, Kiper DC, Carandini M. Suppression without inhibition in visual cortex. Neuron 35: 759–771, 2002 [DOI] [PubMed] [Google Scholar]
- Gallant JL, Braun J, Van Essen DC. Selectivity for polar, hyperbolic, and Cartesian gratings in macaque visual cortex. Science 259: 100–103, 1993 [DOI] [PubMed] [Google Scholar]
- Gallant JL, Connor CE, Rakshit S, Lewis JW, Van Essen DC. Neural responses to polar, hyperbolic, and Cartesian gratings in area V4 of the macaque monkey. J Neurophysiol 76: 2718–2739, 1996 [DOI] [PubMed] [Google Scholar]
- Geisler WS, Perry JS, Super BJ, Gallogly DP. Edge co-occurrence in natural images predicts contour grouping performance. Vision Res 41: 711–724, 2001 [DOI] [PubMed] [Google Scholar]
- Ghose GM, Maunsell J. Specialized representations in visual cortex: a role for binding? Neuron 24: 79–85, 111–125, 1999 [DOI] [PubMed] [Google Scholar]
- Girshick AR, Landy MS, Simoncelli EP. Cardinal rules: visual orientation perception reflects knowledge of environmental statistics. Nat Neurosci 14: 926–932, 2011 [DOI] [PMC free article] [PubMed] [Google Scholar]
- Graf EW, Adams WJ. Surface organization influences bistable vision. J Exp Psychol Hum Percept Perform 34: 502–508, 2008 [DOI] [PubMed] [Google Scholar]
- Heeger DJ. Normalization of cell responses in cat striate cortex. Vis Neurosci 9: 181–197, 1992 [DOI] [PubMed] [Google Scholar]
- Hegde J, Van Essen DC. A comparative study of shape representation in macaque visual areas v2 and v4. Cereb Cortex 17: 1100–1116, 2007 [DOI] [PubMed] [Google Scholar]
- Hegde J, Van Essen DC. Selectivity for complex shapes in primate visual area V2. J Neurosci 20: RC61, 2000 [DOI] [PMC free article] [PubMed] [Google Scholar]
- Huang W, Jiao L, Jia J. Modeling contextual modulation in the primary visual cortex. Neural Netw 21: 1182–1196, 2008 [DOI] [PubMed] [Google Scholar]
- Hubel DH, Wiesel TN. Binocular interaction in striate cortex of kittens reared with artificial squint. J Neurophysiol 28: 1041–1059, 1965 [DOI] [PubMed] [Google Scholar]
- Ichida JM, Schwabe L, Bressloff PC, Angelucci A. Response facilitation from the “suppressive” receptive field surround of macaque V1 neurons. J Neurophysiol 98: 2168–2181, 2007 [DOI] [PubMed] [Google Scholar]
- Ito M, Komatsu H. Representation of angles embedded within contour stimuli in area V2 of macaque monkeys. J Neurosci 24: 3313–3324, 2004 [DOI] [PMC free article] [PubMed] [Google Scholar]
- Jehee JF, Roelfsema PR, Deco G, Murre JM, Lamme VA. Interactions between higher and lower visual areas improve shape selectivity of higher level neurons-explaining crowding phenomena. Brain Res 1157: 167–176, 2007 [DOI] [PubMed] [Google Scholar]
- Kimura R, Ohzawa I. Time course of cross-orientation suppression in the early visual cortex. J Neurophysiol 101: 1463–1479, 2009 [DOI] [PubMed] [Google Scholar]
- Kobatake E, Tanaka K. Neuronal selectivities to complex object features in the ventral visual pathway of the macaque cerebral cortex. J Neurophysiol 71: 856–867, 1994 [DOI] [PubMed] [Google Scholar]
- Lamme VA. The neurophysiology of figure-ground segregation in primary visual cortex. J Neurosci 15: 1605–1615, 1995 [DOI] [PMC free article] [PubMed] [Google Scholar]
- Lamme VA, Super H, Landman R, Roelfsema PR, Spekreijse H. The role of primary visual cortex (V1) in visual awareness. Vision Res 40: 1507–1521, 2000 [DOI] [PubMed] [Google Scholar]
- Lee TS, Yang CF, Romero RD, Mumford D. Neural activity in early visual cortex reflects behavioral experience and higher-order perceptual saliency. Nat Neurosci 5: 589–597, 2002 [DOI] [PubMed] [Google Scholar]
- Levi DM. Image segregation in strabismic amblyopia. Vision Res 47: 1833–1838, 2007 [DOI] [PMC free article] [PubMed] [Google Scholar]
- Levick WR, Thibos LN. Analysis of orientation bias in cat retina. J Physiol 329: 243–261, 1982 [DOI] [PMC free article] [PubMed] [Google Scholar]
- Li B, Peterson MR, Freeman RD. Oblique effect: a neural basis in the visual cortex. J Neurophysiol 90: 204–217, 2003 [DOI] [PubMed] [Google Scholar]
- Li W, Gilbert CD. Global contour saliency and local colinear interactions. J Neurophysiol 88: 2846–2856, 2002 [DOI] [PubMed] [Google Scholar]
- Li W, Piech V, Gilbert CD. Contour saliency in primary visual cortex. Neuron 50: 951–962, 2006 [DOI] [PubMed] [Google Scholar]
- Li W, Piech V, Gilbert CD. Perceptual learning and top-down influences in primary visual cortex. Nat Neurosci 7: 651–657, 2004 [DOI] [PMC free article] [PubMed] [Google Scholar]
- Mahon LE, De Valois RL. Cartesian and non-Cartesian responses in LGN, V1, and V2 cells. Vis Neurosci 18: 973–981, 2001 [PubMed] [Google Scholar]
- Malone BJ, Ringach DL. Dynamics of tuning in the Fourier domain. J Neurophysiol 100: 239–248, 2008 [DOI] [PMC free article] [PubMed] [Google Scholar]
- Marcus DS, Van Essen DC. Scene segmentation and attention in primate cortical areas V1 and V2. J Neurophysiol 88: 2648–2658, 2002 [DOI] [PubMed] [Google Scholar]
- Maruko I, Zhang B, Tao X, Tong J, Smith EL, 3rd, Chino YM. Postnatal development of disparity sensitivity in visual area 2 (v2) of macaque monkeys. J Neurophysiol 100: 2486–2495, 2008 [DOI] [PMC free article] [PubMed] [Google Scholar]
- Merrill EG, Ainsworth A. Glass-coated platinum-plated tungsten microelectrodes. Med Biol Eng 10: 662–672, 1972 [DOI] [PubMed] [Google Scholar]
- Morrone MC, Burr DC, Maffei L. Functional implications of cross-orientation inhibition of cortical visual cells. I. Neurophysiological evidence. Proc R Soc Lond B Biol Sci 216: 335–354, 1982 [DOI] [PubMed] [Google Scholar]
- Morrone MC, Burr DC, Speed HD. Cross-orientation inhibition in cat is GABA mediated. Exp Brain Res 67: 635–644, 1987 [DOI] [PubMed] [Google Scholar]
- Nakazono T, MI, Asakawa K, Ohzawa I. Response properties to combination of two spectral components in A17,18 and V2 neurons. Soc Neurosci Abstr 484–23, 2010 [Google Scholar]
- Nishimoto S, Ishida T, Ohzawa I. Receptive field properties of neurons in the early visual cortex revealed by local spectral reverse correlation. J Neurosci 26: 3269–3280, 2006 [DOI] [PMC free article] [PubMed] [Google Scholar]
- Orban GA. Higher order visual processing in macaque extrastriate cortex. Physiol Rev 88: 59–89, 2008 [DOI] [PubMed] [Google Scholar]
- Pasupathy A, Connor CE. Population coding of shape in area V4. Nat Neurosci 5: 1332–1338, 2002 [DOI] [PubMed] [Google Scholar]
- Pasupathy A, Connor CE. Responses to contour features in macaque area V4. J Neurophysiol 82: 2490–2502, 1999 [DOI] [PubMed] [Google Scholar]
- Pasupathy A, Connor CE. Shape representation in area V4: position-specific tuning for boundary conformation. J Neurophysiol 86: 2505–2519, 2001 [DOI] [PubMed] [Google Scholar]
- Press WH, Flannery BP, Teukolsky SA, Vetterling WT. Fast Fourier Transform. In: Numerical Recipes in Fortran: The Art of Scientific Computing. Cambridge, UK: Cambridge University Press, 1992, p. 490–529 [Google Scholar]
- Priebe NJ, Ferster D. Mechanisms underlying cross-orientation suppression in cat visual cortex. Nat Neurosci 9: 552–561, 2006 [DOI] [PubMed] [Google Scholar]
- Ringach DL. On the origin of the functional architecture of the cortex. PLoS One 2: e251, 2007 [DOI] [PMC free article] [PubMed] [Google Scholar]
- Ringach DL, Bredfeldt CE, Shapley RM, Hawken MJ. Suppression of neural responses to nonoptimal stimuli correlates with tuning selectivity in macaque V1. J Neurophysiol 87: 1018–1027, 2002 [DOI] [PubMed] [Google Scholar]
- Roe AW, Parker AJ, Born RT, DeAngelis GC. Disparity channels in early vision. J Neurosci 27: 11820–11831, 2007 [DOI] [PMC free article] [PubMed] [Google Scholar]
- Rust NC, Schwartz O, Movshon JA, Simoncelli EP. Spatiotemporal elements of macaque v1 receptive fields. Neuron 46: 945–956, 2005 [DOI] [PubMed] [Google Scholar]
- Rust NC, Stocker AA. Ambiguity and invariance: two fundamental challenges for visual processing. Curr Opin Neurobiol 20: 382–388, 2010 [DOI] [PubMed] [Google Scholar]
- Sceniak MP, Hawken MJ, Shapley R. Visual spatial characterization of macaque V1 neurons. J Neurophysiol 85: 1873–1887, 2001 [DOI] [PubMed] [Google Scholar]
- Schmid AM, Purpura KP, Ohiorhenuan IE, Mechler F, Victor JD. Subpopulations of neurons in visual area v2 perform differentiation and integration operations in space and time. Front Syst Neurosci 3: 15, 2009 [DOI] [PMC free article] [PubMed] [Google Scholar]
- Shapley R. Early vision is early in time. Neuron 56: 755–756, 2007 [DOI] [PubMed] [Google Scholar]
- Sharpee TO, Sugihara H, Kurgansky AV, Rebrik SP, Stryker MP, Miller KD. Adaptive filtering enhances information transmission in visual cortex. Nature 439: 936–942, 2006 [DOI] [PMC free article] [PubMed] [Google Scholar]
- Sigman M, Cecchi GA, Gilbert CD, Magnasco MO. On a common circle: natural scenes and Gestalt rules. Proc Natl Acad Sci USA 98: 1935–1940, 2001 [DOI] [PMC free article] [PubMed] [Google Scholar]
- Smith EL, 3rd, Chino YM, Ridder WH, 3rd, Kitagawa K, Langston A. Orientation bias of neurons in the lateral geniculate nucleus of macaque monkeys. Vis Neurosci 5: 525–545, 1990 [DOI] [PubMed] [Google Scholar]
- Smith MA, Kelly RC, Lee TS. Dynamics of response to perceptual pop-out stimuli in macaque V1. J Neurophysiol 98: 3436–3449, 2007 [DOI] [PubMed] [Google Scholar]
- Somers DC, Nelson SB, Sur M. An emergent model of orientation selectivity in cat visual cortical simple cells. J Neurosci 15: 5448–5465, 1995 [DOI] [PMC free article] [PubMed] [Google Scholar]
- Swindale NV. Orientation tuning curves: empirical description and estimation of parameters. Biol Cybern 78: 45–56, 1998 [DOI] [PubMed] [Google Scholar]
- Tanaka K. Inferotemporal cortex and object vision. Annu Rev Neurosci 19: 109–139, 1996 [DOI] [PubMed] [Google Scholar]
- Tanaka K, Ohzawa I. Surround suppression of V1 neurons mediates orientation-based representation of high-order visual features. J Neurophysiol 101: 1444–1462, 2009 [DOI] [PubMed] [Google Scholar]
- Tanaka K, Saito H, Fukada Y, Moriya M. Coding visual images of objects in the inferotemporal cortex of the macaque monkey. J Neurophysiol 66: 170–189, 1991 [DOI] [PubMed] [Google Scholar]
- Thibos LN, Levick WR. Orientation bias of brisk-transient y-cells of the cat retina for drifting and alternating gratings. Exp Brain Res 58: 1–10, 1985 [DOI] [PubMed] [Google Scholar]
- Touryan J, Lau B, Dan Y. Isolation of relevant visual features from random stimuli for cortical complex cells. J Neurosci 22: 10811–10818, 2002 [DOI] [PMC free article] [PubMed] [Google Scholar]
- Walker GA, Ohzawa I, Freeman RD. Asymmetric suppression outside the classical receptive field of the visual cortex. J Neurosci 19: 10536–10553, 1999 [DOI] [PMC free article] [PubMed] [Google Scholar]
- Williams PE, Shapley RM. A dynamic nonlinearity and spatial phase specificity in macaque V1 neurons. J Neurosci 27: 5706–5718, 2007 [DOI] [PMC free article] [PubMed] [Google Scholar]
- Willmore BD, Prenger RJ, Gallant JL. Neural representation of natural images in visual area V2. J Neurosci 30: 2102–2114, 2010 [DOI] [PMC free article] [PubMed] [Google Scholar]
- Yamane Y, Carlson ET, Bowman KC, Wang Z, Connor CE. A neural code for three-dimensional object shape in macaque inferotemporal cortex. Nat Neurosci 11: 1352–1360, 2008 [DOI] [PMC free article] [PubMed] [Google Scholar]
- Zhang B, Van den Bergh G, Tong J, Tao X, Smith EL, III, Chino YM. Effects of the orientation of spatially restricted surround stimuli on RF center-surround interactions in macaque V2 neurons. Soc Neurosci Abstr 853.5, 2008 [Google Scholar]
- Zhang B, Zheng J, Watanabe I, Maruko I, Bi H, Smith EL, Chino Y. Delayed maturation of receptive field center/surround mechanisms in V2. Proc Natl Acad Sci USA 102: 5862–5867, 2005 [DOI] [PMC free article] [PubMed] [Google Scholar]
- Zhou H, Friedman HS, von der Heydt R. Coding of border ownership in monkey visual cortex. J Neurosci 20: 6594–6611, 2000 [DOI] [PMC free article] [PubMed] [Google Scholar]


