

Abstract
PPARγ is a nuclear receptor that regulates numerous pathways including cytokine expression and immune responses and plays an important role in controlling colon inflammation. We aimed at determining the occurring PPARγ SNPs, at predicting the haplotypes, and at determining the frequency outcome in inflammatory bowel disease (IBD) patients in comparison with healthy controls. We determined genetic variants in the coding exons and flanking intronic sequences of the NR1C3 gene in 284 IBD patients and 194 controls and predicted NR1C3 haplotypes via bioinformatic analysis. We investigated whether certain NR1C3 variants are associated with susceptibility to IBD or its disease course. None of the detected 22 NR1C3 variants were associated with IBD. Two variants with allelic frequencies over 1% were included in haplotype/diplotype analyses. None of the NR3C1 haplotypes showed association with IBD development or disease course. We conclude that NR1C3 haplotypes are not related to IBD susceptibility or IBD disease activity.
1. Introduction
Crohn's disease (CD) and ulcerative colitis (UC) are chronic recurrent forms of inflammation of the gastrointestinal tract (inflammatory bowel disease, or IBD), which are characterized by an onset in young adulthood and by an unpredictable disease course that may lead to debilitating complications [1]. The combined prevalence of CD and UC is estimated to be 100 to 200 per 100 000 individuals in developed countries [2]. IBD is thought to be of multifactorial genesis including a complex interplay among genetic, environmental, microbial, and immune factors [3]. The exact molecular pathogenesis of IBD is not yet fully elucidated [4]. Although great advances have been made in the clinical management of IBD, curative therapeutic strategies do not exist.
It has been recognized that components of pro- and anti-inflammatory signalling cascades seem to play an important role in the pathogenesis of IBD. Initially, pro- and anti-inflammatory cytoplasmic receptors that are activated by bacterial lipopolysaccharides, such as nucleotide oligomerisation domain (NOD) 2/caspase recruitment domain (CARD) 15, and NOD1/CARD4, have been especially studied in the past and have been identified as IBD susceptibility genes. These findings emphasized the pivotal role of an interaction between enteric microbes and the intestinal immune system in the pathophysiology of IBD [5–8].
Current evidence suggests that an additional receptor, PPARγ, plays an important role in the regulation of colon inflammation. PPARγ belongs to the nuclear receptor family that consists of approximately 50 different transcription factors, which are known to be involved in the regulation of a wide range of different biological processes. PPARγ controls the expression of a large number of different genes and was initially identified as an important regulator of genes involved in lipid metabolism and insulin sensitisation [9]. PPARγ acts through heterodimerisation with another nuclear receptor, retinoid X receptor α (RXRα). The heterodimer binds to specific DNA response elements within the promoters of its target genes (peroxisome proliferator response elements, PPREs) [10]. PPARγ is mostly expressed in adipose tissue and the large intestine. Kidney, liver, and small intestine express intermediate levels, whereas PPARγ is barely found in muscle [11].
PPARγ is known to modulate the expression of key transcription factors and kinases involved in inflammatory signalling cascades such as NF-κB, c-Jun, c-Fos, and nuclear factor of activated T cell (NFAT). Thereby, PPARγ is able to inhibit the mucosal production of proinflammatory cytokines, such as interleukin 1β (IL-1β) and tumor necrosis factor-α (TNFα), and to downregulate the expression of various adhesion molecules [12, 13]. Based on these findings, it has been demonstrated in mouse models that activation of PPARγ leads to an efficient reduction of the severity of intestinal inflammation by suppressing excessive immunoinflammatory responses [14, 15]. As a consequence, PPARγ is currently under investigation as a potential target for novel anti-inflammatory agents [9]. Because of its central role in the regulation of colon inflammation, we hypothesized that PPARγ could be a putative susceptibility gene for the development of IBD. The PPARγ gene NR1C3 is located on chromosome 3 and is composed of 9 exons. Alternative splicing yields three different protein isoforms, PPARγ1, PPARγ2, and PPARγ3, which differ in the amino acid composition at their 5′ ends. The isoform PPARγ2 is the most abundant PPARγ protein found in a number of human tissues [11]. PPARγ is known to be polymorphically expressed. Several SNPs have been described, one of which has been shown to have consequences for both the conformational protein structure and protein function [16, 17]. So far, only a few studies have assessed the role of a few discrete NR1C3 gene polymorphisms in IBD pathogenesis. A systematic study to comprehensively investigate the role of global polymorphic features of the NR1C3 gene with a focus on its role in IBD susceptibility, such as the one presented here, has not been previously performed.
In the present study, we aimed at determining all occurring mutations and SNPs in the exonic regions of the PPARγ gene NR1C3, at bioinformatically predicting the arising haplotypes, and at evaluating their association with the risk to develop IBD and with IBD activity in a well-sized cohort of IBD patients and non-IBD controls.
2. Materials and Methods
2.1. Patients
Two hundred and eighty-four clinically diagnosed Swiss IBD patients (140 UC and 144 CD patients) were recruited at the centers participating in the Swiss Inflammatory Bowel Disease Cohort Study (SIBDCS) [18]. All patients gave their informed consent to the inclusion into the study. An ethical approval was obtained from the Medical Ethical Committees of the University Hospital Lausanne, Switzerland, and all local study sites. EDTA blood samples were stored at the central tissue repository at the Institute of Pathology, University of Bern, Switzerland. The SIBDCS data center at the University Hospital of Lausanne, Switzerland, provided data on demographics and past and current disease characteristics. Diagnosis of IBD (CD or UC) was confirmed by the study investigations based on clinical presentation, endoscopic findings, and histology. Demographic and clinical information on IBD patients is summarized in Table 1.
Table 1.
Demographic characteristics of IBD patients and non-IBD controls.
| Patient cohort | |||
|---|---|---|---|
| UC | CD | IBD total | |
| N (%) of patients | 140 (49.3) | 144 (50.7) | 284 (100) |
|
| |||
| Male/female N (%) | 77 (54.6)/64 (45.4) | 77 (55)/63 (45) | 140 (49.3)/144 (50.7) |
|
| |||
| Age at enrolment | 44.02 ± 14.69 | 38.59 ± 14.95 | 41.27 ± 15.04 |
|
| |||
| Disease location N (%) | Available for 110 UC patients: | Available for 125 CD patients (Montreal classification) | |
| E1: 11 (10%) | L1: 33 (26.4%) | ||
| E2: 58 (52.7%) | L2: 42 (33.6%) | ||
| E3: 41 (37.3%) | L3: 46 (36.8%) | ||
| L4: 4 (3.2%) | |||
|
| |||
| EIM frequency N (%) | Available for 139 UC patients: | Available for 142 CD patients: | Available for 281 IBD patients: |
| 51 (36.7) | 72 (50.7) | 123 (43.8) | |
|
| |||
| Fistula frequency N (%) | Available for 140 UC patients: | Available for 144 CD patients: | Available for 284 IBD patients: |
| 10 (7.1) | 73 (50.7) | 83 (29.2) | |
|
| |||
| Mean CDAI at enrolment | NA | Available for 127 CD patients: 110.56 ± 75.81 | NA |
|
| |||
| State of CD (quiescent/acute) N (%) | NA | Available for 127 CD pat.: | NA |
| 95 (74.8)/32 (25.2) | |||
|
| |||
| Mean mtwsi at enrolment | Available for 140 UC patients: 4.69 ± 4.31 | NA | NA |
|
| |||
| State of UC (inactive/active) N (%) | 118 (84.3)/22 (15.7) | NA | NA |
|
| |||
| Leucocytes at enrolment | Valid for 134 UC patients: 17.45 ± 79.29 | Available for 142 CD patients: 8.9 ± 7.85 | Available for 276 IBD patients: 13.05 ± 55.59 |
|
| |||
| CRP at enrolment | Valid for 127 CD patients: 9.58 ± 15.31 | Available for 138 CD patients: 12.23 ± 22.64 | Available for 265 IBD patients: 10.96 ± 19.48 |
|
| |||
| Control cohort | |||
| Control total | |||
|
| |||
| N of controls (%) | 194 (100) | ||
| Male/female N (%) | 77 (39.7)/117 (60.3) | ||
| Age at enrolment | 41.01 ± 16.5 | ||
N: absolute number; E1: rectal UC; E2: left-sided UC; E3: extensive UC; L1: ileal CD; L2: colonic CD; L3: ileocolonic CD; L4: CD of upper GI; EIMs: extraintestinal manifestations; CDAI: Crohn's activity index; mtwsi: modified Truelove Witts severity index.
2.2. Control Subjects
One hundred and ninety-four non-IBD controls were recruited from gastroenterological patients undergoing surveillance colonoscopy, who did not show any symptoms of IBD. History of colorectal cancer was used as an exclusion criterion for both IBD patients and non-IBD controls. All subjects provided their written informed consent to be included in the study. Ethical approvals were obtained from the local medical ethical committees of all study sites involved in the collection of non-IBD samples.
2.3. Sequencing Reactions
DNA was extracted from EDTA-blood or intestinal biopsies using the QIAcube robotic workstation and a standard procedure (QIAamp DNA Mini Kit, QIAGEN, Switzerland). The PCR and sequencing primer design was based on the NCBI reference sequence for NR1C3 (GenBank accession number NT_022175.18). Primers for genomic DNA were designed to span all 7 exons expressed in case of the most often occurring PPARγ protein variant 2 including at least 50 bp of flanking intronic sequences at both 5′ and 3′ ends. The DNA sequences of purified PCR fragments were obtained with an ABI 3730xl sequencing machine. Details of the PCR primers can be found in the Supplemental Table 1 available online at doi:10.1155/2012/349469. Optimized PCR conditions, and methods used for subsequent purification, and sequencing of the fragments are available upon request.
2.4. Statistical Analysis of Allele Frequencies and Genotype Distributions
To detect differences in SNP distribution between case and control groups or between disease activity groups, the Chi-Square test or the Fisher's exact test was used. A P value of <0.05 was considered as significant in noncorrected statistical tests and of <0.0023 after correction for multiple testing of 22 variants (according to Bonferroni). Differences in CDAI (Crohn's disease activity index), mtwsi (modified Truelove Witts severity index), or CRP (C-reactive protein) means in dependency of the genotype were calculated using the Mann-Whitney U test. The statistical analysis was performed using the software package SPSS 19 (SPSS Inc., Chicago, IL).
2.5. Haplotype and Diplotype Analysis
The FAMHAP software was used to calculate the haplotypes and diplotypes based on the detected SNPs and mutations in the NR1C3 gene and to detect differences in haplotypes and diplotype distributions in case and control groups. FAMHAP performs a permutation test on associations between estimated haplotypes and the affection state based on Monte Carlo simulations. A value of P < 0.05 was considered to be significant. Haplotype and diplotype calculations were performed on 256 IBD patients and 148 non-IBD controls, from which all sequence data of adequate quality were obtained. To allow referral to specific haplotypes, a frequency-based priority criterion was used to name haplo- and diplotypes (e.g., H_1 or D_1 for the most often occurring haplotype or diplotype, Table 8).
Table 8.
Haplotype and diplotype distribution in IBD cases and non-IBD controls.
| Subjects included | H1 (CC)(a) | H2 (CT) | H3 (GC) | H4 (GT) | P (c) | |
|---|---|---|---|---|---|---|
| IBD N (%) | 256 | 436.3 (85.2) | 41.3 (8.1) | 12.7 (2.5) | 21.7 (4.2) | 0.23 |
| OR (C.I.) | 1.27 (0.87–1.86) | 0.86 (0.52–1.42) | 0.5 (0.23–1.07) | 1.1 (0.53–2.28) | ||
| UC N (%) | 126 | 212.6 (84.4) | 22.6 (9) | 6.4 (2.5) | 10.4 (4.1) | 0.52 |
| OR (C.I.) | 1.19 (0.76–1.87) | 0.96 (0.54–1.72) | 0.51 (0.2–1.3) | 1.07 (0.45–2.51) | ||
| CD N (%) | 130 | 223.6 (86) | 18.6 (7.2) | 6.4 (2.5) | 11.4 (4.4) | 0.31 |
| OR (C.I.) | 1.36 (0.86–2.15) | 0.75 (0.41–1.39) | 0.49 (0.19–1.26) | 1.13 (0.49–2.6) | ||
| Controls | 148 | 242.5 (81.9) | 27.5 (9.3) | 14.5 (4.9) | 4.5 (3.9) | |
|
| ||||||
| D1 (CC/CC) (b) | D2 (CC/GT) | D3 (CC/GC) | D4 (CC/CT) | |||
|
| ||||||
| IBD N (%) | 256 | 184.0 (71.9) | 37.3 (14.6) | 12.0 (4.7) | 19.0 (7.4) | |
| OR (C.I.) | 1.3 (0.84–2.02) | 0.86 (0.49–1.5) | 0.51 (0.23–1.15) | 1.24 (0.55–2.81) | ||
| UC N (%) | 126 | 89.0 (70.6) | 19.6 (15.6) | 6.0 (4.8) | 9.0 (7.1) | |
| OR (C.I.) | 1.23 (0.73–2.05) | 0.93 (0.49–1.78) | 0.52 (0.19–1.41) | 1.19 (0.46–3.09) | ||
| CD N (%) | 130 | 95.0 (73.1) | 17.6 (13.5) | 6.0 (4.6) | 10.0 (7.7) | |
| OR (C.I.) | 1.39 (0.83–2.32) | 0.79 (0.41–1.54) | 0.5 (0.19–1.36) | 1.29 (0.51–3.27) | ||
| Controls | 148 | 98.0 (66.2) | 24.5 (16.6) | 13.0 (8.8) | 9.0 (6.1) | |
|
| ||||||
| D5 (CT/GT) | D6 (GC/GT) | D7 (GC/CT) | D8 (GT/GT) | P (c) | ||
|
| ||||||
| IBD N(%) | 2.0 (0.8) | 0.0 (0) | 0.7 (0.3) | 1.0 (0.4) | 0.409 | |
| OR (C.I.) | 0.58 (0.08–4.12) | — | — | — | ||
| UC N (%) | 1.0 (0.8) | 0.0 (0) | 0.0 (0) | 1.0 (0.8) | 0.716 | |
| OR (C.I.) | — | — | — | |||
| CD N (%) | 0.0 (0) | 0.0 (0) | 0.0 (0) | 0.0 (0) | 0.588 | |
| OR (C.I.) | — | — | — | |||
| Controls | 2.0 (1.4) | 1.0 (0.7) | 0.5 (0.3) (d) | 0.0 (0) | ||
OR: odds ratio; CI: confidence interval; N: absolute number; H1–H4: haplotype 1—haplotype 4; D1–D8: diplotype 1—diplotype 8; (a)the first base denotes the outcome at position rs1801282, the second base denotes the outcome at position rs1801282; (b)each base pair (before and after the slash) denotes one haplotype; (c) P values calculated with FAMHAP; (d)frequency predicted to be 0.0 when comparing UC patients with controls.
2.6. Calculation of Linkage Disequilibria
Linkage disequilibria (LD) were calculated using the r 2 statistics. Calculations were performed using the software package Haploview (http://www.broadinstitute.org/scientific-community/science/programs/medical-and-population-genetics/haploview/haploview).
3. Results
3.1. NR1C3 Sequence Variability
DNA samples from 284 IBD patients (CD or UC) and 194 healthy controls were initially sequenced for the seven NR1C3 splice variant 2 coding exons including at least 50 bp of the neighbouring intronic sequences. The sequencing results of 256 IBD patients (126 UC and 130 CD patients) and of 148 healthy controls were of adequate quality and complete for all seven exons to be further used in haplotype analyses. Table 1 shows the demographic data of the individuals included into the NR1C3 analysis.
The sequence data were screened for genetic variation in the NR1C3 gene, using the Basic Local Alignment Search Tool (BLAST; http://www.ncbi.nih.gov) and the GenBank entry NT_02257.18 as the reference sequence. As shown in Tables 2 and 3, altogether 22 variants were detected, which—with exception of one mutation (one individual was found to be homozygous for variant number 6)—were in Hardy-Weinberg equilibrium. The majority of variants were single-nucleotide substitutions. Only one variant was characterised by a base-pair insertion leading to a frame shift. The majority of variants have not yet been described in the NCBI SNP database. Nine variants were found in exonic regions, 11 variants were found in intronic regions, one variant was detected in the 5′-prime region, and 1 variant was found within the 3′ end of NR1C3. Only two of the detected variants (no. 1 and no. 7, Table 2) lead to nonsynonymous amino acid exchanges within the PPARγ protein. Furthermore, only two variants occurred with an allelic frequency of more than one percent (rs1801282 and rs3856806), thus fulfilling a definition of a genetic polymorphism (Table 3).
Table 2.
Genetic variants detected in NR1C3.
| SNP no. | Position in DNA( a) | Exon/ intron no. | Exon position | Intron/ exon | Base exchange | Position in RNA(b) | AA exchange(c) | SNP database |
|---|---|---|---|---|---|---|---|---|
| 1 | 12332979 | 1 | Intron | G>T | NA | Not found | ||
| 2 | 12333068 | 1 | Exon | insC | 68 | frame shift | Not found | |
| 3 | 12333070 | 1 | 5-prime | C>T | 70 | 5-prime | Not found | |
| 4 | 12333125 | 1 | 12333001–12333173 | Exon | C>G | 125 | 12 P [Pro]>A [Ala] | rs1801282 |
| 5 | 12333199 | 1 | Intron | T>G | NA | Not found | ||
| 6 | 12333213 | 1 | Intron | G>A | NA | Not found | ||
| 7 | 12361272 | 2 | 12361203–12361430 | Exon | C>T | 243 | 51 S [Ser]>F [Phe] | Not found |
| 8 | 12361422 | 2 | Exon | A>G | 393 | 101 E [Glu]>G [Gly] | Not found | |
| 9 | 12363017 | 3 | 12362821–12362990 | Intron | A>G | NA | Not found | |
| 10 | 12374014 | 4 | Intron | G>T | NA | Not found | ||
| 11 | 12374024 | 4 | Intron | A>T | NA | Not found | ||
| 12 | 12374091 | 4 | Intron | C>A | NA | rs4135333 | ||
| 13 | 12374110 | 4 | Intron | C>T | NA | Not found | ||
| 14 | 12374272 | 4 | 12374113–12374251 | Intron | A>T | NA | rs4135334 | |
| 15 | 12374352 | 4 | Intron | C>T | NA | Not found | ||
| 16 | 12387616 | 5 | 12387381–12387580 | Intron | G>A | NA | Not found | |
| 17 | 12398613 | 6 | 12398203–12398653 | Exon | C>T | 1321 | 410 S [Ser]>S [Ser] | Not found |
| 18 | 12415473 | 7 | Exon | G>A | 1438 | 449 L [Leu]>L [Leu] | Not found | |
| 19 | 12415557 | 7 | 12415397–12415855 | Exon | C>T | 1522 | 477 H [His]>H [His] | rs3856806 |
| 20 | 12415581 | 7 | Exon | G>A | 1546 | 485 K [Lys]>K [Lys] | Not found | |
| 21 | 12415647 | 7 | Exon | G>A | 1611 | 506 stop>stop | Not found | |
| 22 | 12415669 | 7 | 3′ end | C>T | 3′ end | Not found |
no.: number; AA: amino acid; (a)DNA reference sequence NT_02257.18; (b)RNA reference sequence NM_015869.4; (c)protein reference sequence P37231 (PPARG_HUMAN) SWISSPROT database.
Table 3.
Allele frequencies in IBD cases and healthy controls.
| SNP no. | Position in NT_02257.18* | IBD cases | Controls | ||||
|---|---|---|---|---|---|---|---|
| N alleles included | N variant alleles | Allele frequency in % | N alleles included | N variant alleles | Allele frequency in % | ||
| 1 | 12332979G>T | 566 | 0 | 0 | 364 | 1 | 0.27 |
| 2 | 12333068insC | 566 | 1 | 0.18 | 364 | 0 | 0 |
| 3 | 12333070C>T | 566 | 0 | 0 | 364 | 2 | 0.55 |
| 4 | 12333125C>G | 566 | 60 | 10.60 | 364 | 50 | 13.74 |
| 5 | 12333199T>G | 566 | 1 | 0.18 | 364 | 0 | 0 |
| 6 | 12333213G>A | 566 | 0 | 0 | 364 | 3 | 0.82 |
| 7 | 12361272C>T | 562 | 1 | 0.18 | 358 | 0 | 0 |
| 8 | 12361422A>G | 562 | 0 | 0 | 358 | 1 | 0.28 |
| 9 | 12363017A>G | 554 | 1 | 0.18 | 334 | 0 | 0 |
| 10 | 12374014G>T | 554 | 1 | 0.18 | 348 | 0 | 0 |
| 11 | 12374024A>T | 564 | 1 | 0.18 | 348 | 0 | 0 |
| 12 | 12374091C>A | 554 | 1 | 0.18 | 348 | 0 | 0 |
| 13 | 12374110C>T | 554 | 1 | 0.18 | 348 | 0 | 0 |
| 14 | 12374272A>T | 554 | 1 | 0.18 | 348 | 1 | 0.29 |
| 15 | 12374352C>T | 554 | 0 | 0 | 348 | 1 | 0.29 |
| 16 | 12387616G>A | 562 | 1 | 0.18 | 360 | 0 | 0 |
| 17 | 12398613C>T | 546 | 0 | 0 | 370 | 1 | 0.27 |
| 28 | 12415473G>A | 546 | 0 | 0 | 350 | 1 | 0.29 |
| 19 | 12415557C>T | 546 | 66 | 12.09 | 350 | 46 | 13.14 |
| 20 | 12415581G>A | 546 | 0 | 0 | 350 | 1 | 0.29 |
| 21 | 12415647G>A | 546 | 2 | 0.37 | 350 | 0 | 0 |
| 22 | 12415669C>T | 546 | 0 | 0 | 350 | 1 | 0.29 |
no.: number; N: absolute number; *DNA reference sequence signature in NCBI.
The two most often occurring variants rs1801282 and rs3856806 were found to be in moderately strong linkage (Figure 1, r 2 = 40%, SNP numbers 4 and 19) This finding is in good agreement with previous publications [19–21]. With the exception of two individuals, who were carriers of mutation numbers 18 and 20 or 7 and 10 in combination, no subject ever carried more than one rare NR1C3 variant.
Figure 1.
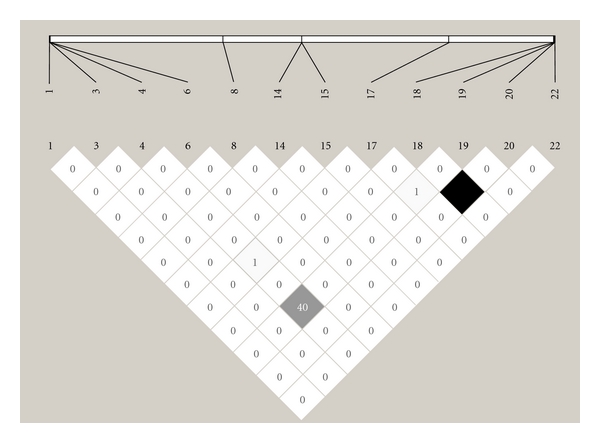
The LD plot for all NR1C3 variants that were found in the non-IBD control group. r 2 = 0 (white), 0 < r 2 < 100 (shadows of grey), and r 2 = 100 (black). Numbers within squares: r 2 values (0–100%), LD: linkage disequilibrium.
3.2. Distribution of Allele and Genotype Frequencies within IBD Patient and Healthy Control Group
As shown in Table 3, only two variants (rs1801282 and rs3856806) occurred in an allele frequency higher than 1% in IBD and non-IBD control group. No significant differences in allele frequencies were observed.
Table 4 shows the results when comparing the frequency of NR1C3 genotypes carrying distinct genetic variants in heterozygous or homozygous form in IBD patients and non-IBD controls. No significant differences in the distribution of variant carriers were observed. In case of the often occurring SNPs rs1801282 and rs3856806, we investigated also the variant carrier frequency outcome after stratification according to disease subgroup (CD or UC) and different disease activity parameters, such as fistula state, occurrence of extraintestinal manifestations (EIMs) and overall clinical disease activity as evaluated by the disease activity indices CDAI and mtwsi. As demonstrated in Tables 5, 6 and 7, none of the mentioned factors were significantly associated with the occurrence of variants rs1801282 or rs3856806.
Table 4.
Number of variant carriers in IBD and in non-IBD controls.
| SNP | SNP carriers in IBD | SNP carriers in controls | OR (CI) | P (a) | ||
|---|---|---|---|---|---|---|
| N of subjects | N (%) of variant carriers | N of subjects | N (%) of variant carriers | |||
| 12332979G>T | 283 | 0 (0) | 182 | 1 (0.5) | NA | 0.39 |
| 12333068insC | 283 | 1 (0.4) | 181 | 0 (0) | NA | 0.61 |
| 12333070C>T | 283 | 0 (0) | 181 | 1 (0.6) | NA | 0.39 |
| 12333125A>G | 283 | 58 (20.5) | 182 | 48 (26.4) | 0.72 | 0.14(b), (c) |
| 12333125A>G | 227 | Hom only: 2 (0.9) | 136 | Hom only: 2 (1.5) | 0.60 | 0.63(c) |
| 12333199T>G | 283 | 1 (0.4) | 181 | 0 (0) | NA | 0.61 |
| 12333213G>A | 283 | 0 (0) | 182 | 3 (1.6) | NA | 0.06 |
| 12361272C>T | 281 | 1 (0.4) | 179 | 0 (0) | NA | 0.61 |
| 12361422A>G | 281 | 0 (0) | 179 | 1 (0.6) | NA | 0.39 |
| 12363017A>G | 277 | 1 (0.4) | 167 | 0 (0) | NA | 0.62 |
| 12374014G>T | 280 | 1 (0.4) | 174 | 0 (0) | NA | 0.62 |
| 12374024A>T | 280 | 1 (0.4) | 174 | 0 (0) | NA | 0.62 |
| 12374091C>A | 280 | 1 (0.4) | 174 | 0 (0) | NA | 0.62 |
| 12374110C>T | 280 | 1 (0.4) | 174 | 0 (0) | NA | 0.62 |
| 12374272A>T | 280 | 1 (0.4) | 174 | 1 (0.6) | 0.62 | 0.62 |
| 12374352C>T | 280 | 0 (0) | 174 | 1 (0.4) | NA | 0.38 |
| 12387616G>A | 282 | 1 (0.4) | 179 | 0 (0) | NA | 0.61 |
| 12398613C>T | 281 | 0 (0) | 185 | 1 (0.5) | NA | 0.40 |
| 12415473G>A | 273 | 0 (0) | 175 | 1 (0.6) | NA | 0.39 |
| 12415557C>T | 273 | 63 (23.1) | 175 | 42 (24) | 0.95 | 0.82(b ), (c) |
| 12415557C>T | 213 | Hom only: 3 (1.4) | 137 | Hom only: 4 (2.9) | 0.48 | 0.44(c) |
| 12415581G>A | 273 | 0 (0) | 175 | 1 (0.6) | NA | 0.39 |
| 12415647G>A | 273 | 2 (0.7) | 175 | 0 (0) | NA | 0.37 |
| 12415669C>T | 273 | 0 (0) | 175 | 1 (0.6) | NA | 0.39 |
OR: odds ratio; CI: confidence interval; no.: number; N: absolute number; het: heterozygous; hom: homozygous; NA: not applicable; (a) P values calculated with Fisher's exact test; (b) P value calculated with Chi-Square test; (c)12333125A>G: adjusted for age and sex: P = 0.14 (OR 0.72 C.I. (0.46–1.11)) (het + hom); P = 0.53 (hom. only); 12415557C>T: adjusted for age and sex: P = 0.76 (OR 0.93 C.I. (0.59–1.46)) (het + hom), P = 0.35 (OR 0.7 C.I. (0.33–1.49)) (hom only).
Table 5.
Number of variant carriers (12333125A>G and 12415557C>T) in CD and UC patients compared to controls.
| Category | 12333125A>G | ||||||
|---|---|---|---|---|---|---|---|
| Genotype | N (a) | N (%) of SNP carriers | OR (C.I.) | P (c) | OR (C.I) (b) | P (b) | |
| CD | Het plus hom | 143 | 28 (19.6) | 0.68 (0.40–1–15) | 0.15(d) | 0.67 (0.40–1.14) | 0.14 |
| control | Het plus hom | 182 | 48 (26.4) | ||||
| CD | hom | 116 | 1 (0.9) | 0.58 (0.05–6.51) | 1.0 | 0.77 (0.23–2.61) | 0.68 |
| control | hom | 136 | 2 (1.5) | ||||
|
| |||||||
| UC | Het plus hom | 140 | 30 (21.4) | 0.76 (0.45–1.28) | 0.31(d) | 0.78 (0.46–1.32) | 0.35 |
| control | Het plus hom | 182 | 48 (26.4) | ||||
| UC | hom | 111 | 1 (0.9) | 0.61 (0.06–6.81) | 1.0 | 0.70 (0.21–2.38) | 0.57 |
| control | hom | 136 | 2 (1.5) | ||||
|
| |||||||
| 12415557C>T | |||||||
|
| |||||||
| CD | Het plus hom | 139 | 31 (22.3) | 0.91 (0.54–1.54) | 0.72(d) | 0.92 (0.54–1.56) | 0.74 |
| control | Het plus hom | 175 | 42 (24.0) | ||||
| CD | hom | 109 | 1 (0.9) | 0.31 (0.03–2.80) | 0.39 | 0.54 (0.18–1.62) | 0.27 |
| control | hom | 137 | 4 (2.9) | ||||
|
| |||||||
| UC | Het plus hom | 134 | 32 (23.9) | 0.99 (0.59–1.68) | 0.98(d) | 0.94 (0.55–1.62) | 0.83 |
| control | Het plus hom | 175 | 42 (24.0) | ||||
| UC | hom | 104 | 2 (1.9) | 0.65 (0.12–3.63) | 0.70 | 0.84 (0.35–1.99) | 0.69 |
| control | hom | 137 | 4 (2.9) | ||||
OR: odds ratio; CI: confidence interval; N: absolute number; het: heterozygous; hom: homozygous; (a)absolute number of all patients of the respective subgroup included into the analysis; (b)adjusted for age and sex; (c) P values calculated with Fisher's exact test; (d) P value calculated with Chi-Square test.
Table 6.
Impact of variant 12333125A>G on disease activity.
| Category | 12333125A>G | ||||||
|---|---|---|---|---|---|---|---|
| Genotype | N (a) | N (%) of SNP carriers | OR (C.I.) | P | OR (C.I.) (b) | P (b) | |
| Fistula | Het plus hom | 83 | 15 (18.1) | 1.24 (0.64–2.39) | 0.52 | 1.25 (0.65–2.4) | 0.51 |
| No Fistula | Het plus hom | 200 | 43 (21.5) | ||||
| Fistula | hom | 68 | 0 (0.0) | NA | 1(c) | NA | 1 |
| No Fistula | hom | 159 | 2 (1.3) | ||||
|
| |||||||
| EIM | Het plus hom | 122 | 23 (18.9) | 1.23 (0.68–2.21) | 0.5 | 1.22 (0.67–2.21) | 0.51 |
| No EIM | Het plus hom | 158 | 35 (22.2) | ||||
| EIM | hom | 100 | 1 (1.0) | 0.81 (0.05–13.03) | 1(c) | 0.87 (0.22–3.54) | 0.85 |
| No EIM | hom | 124 | 1 (0.8) | ||||
|
| |||||||
| Nonactive UC | Het plus hom | 118 | 26 (22.0) | 0.79 (0.25–2.53) | 0.79 | 0.89 (0.27–2.96) | 0.85 |
| active UC(d) | Het plus hom | 22 | 4 (18.2) | ||||
| NonActive UC | hom | 93 | 1 (1.1) | NA | 1(c) | NA | 1 |
| active UC | hom | 18 | 0 (0.0) | ||||
|
| |||||||
| Quiescent CD | Het plus hom | 94 | 17 (18.1) | 1.51 (0.58–3.93) | 0.4 | 1. 47 (0.56–3.88) | 0.44 |
| Acute CD(d) | Het plus hom | 32 | 8 (25.0) | ||||
| Quiescent CD | hom | 78 | 1 (1.3) | NA | 1(c) | NA | 1 |
| Acute CD | hom | 24 | 0 (0.0) | ||||
N: absolute number; OR: odds ratio; CI: confidence interval; het: heterozygous; hom: homozygous; NA: not applicable; EIMs: extraintestinal manifestations (a)absolute number of subjects included into the respective analysis; (b)OR and P value adjusted for age and sex; (c) P value calculated with Fisher's exact test (otherwise Chi- Square test was used); (d)a threshold of CDAI = 150, and an mtwsi of 10 points was evaluated as the beginning of active disease.
Table 7.
Impact of variant 12415557C>T on disease activity.
| Category | 12415557C>T | ||||||
|---|---|---|---|---|---|---|---|
| Genotype | N (a) | N (%) of SNP carriers | OR (C.I.) | P | OR (C.I.) (b) | P (b) | |
| Fistula | Het plus hom | 79 | 18 (22.8) | 1.02 (0.55–1.9) | 0.94 | 1.04 (0.56–1.95) | 0.89 |
| No Fistula | Het plus hom | 194 | 45 (23.2) | ||||
| Fistula | hom | 62 | 1 (1.6) | 0.89 (0.07–9.2) | 1(c) | 0.89 (0.26–3.01) | 0.85 |
| No Fistula | hom | 151 | 2 (1.3) | ||||
|
| |||||||
| EIM | Het plus hom | 116 | 26 (22.4) | 1.10 (0.62–1.94) | 0.76 | 1.09 (0.61–1.93) | 0.78 |
| No EIM | Het plus hom | 154 | 37 (24.0) | ||||
| EIM | hom | 92 | 2 (2.2) | 0.39 (0.03–4.31) | 0.58 | 0.65 (0.19–2.2) | 0.49 |
| No EIM | hom | 118 | 1 (0.8) | ||||
|
| |||||||
| Nonactive UC | Het plus hom | 114 | 28 (24.6) | 0.77 (0.24–2.49) | 0.78 | 0.89 (0.27–2.99) | 0.86 |
| active UC | Het plus hom | 20 | 4 (20.0) | ||||
| Nonactive UC | hom | 87 | 1 (1.1) | 5.30 (0.32–90–42) | 0.3 | 3.28 (0.74–14.49) | 0.12 |
| active UC | hom | 17 | 1 (5.9) | ||||
|
| |||||||
| Quiescent CD | Het plus hom | 91 | 21 (23.1) | 1.16 (0.45–2.97) | 0.76 | 1.22 (0.47–3.17) | 0.68 |
| Acute CD | Het plus hom | 31 | 25.8 (31) | ||||
| Quiescent CD | hom | 71 | 1 (1.4) | NA | 1(c) | NA | 1 |
| Acute CD | hom | 23 | 0 (0) | ||||
N: absolute number; OR: odds ratio; CI: confidence interval; het: heterozygous; hom: homozygous; NA: not applicable; (a)absolute number of subjects included into the respective analysis; (b)OR and P value adjusted for age and sex; (c) P value calculated with Fisher's exact test (otherwise Chi-Square test was used).
Furthermore a comparison of the mean values of leukocyte or CRP concentrations in plasma did not show any significant differences between IBD patients carrying the variant rs1801282 or rs3856806 and non-variant carriers within the patient group (data not shown).
3.3. Haplotype and Diplotype Analysis
The two NR1C3 genetic variants rs1801282 and rs3856806, which occurred in an allele frequency of higher than 1%, were included in the bioinformatic haplotype prediction using the computer programme FAMHAP. For this analysis, all individuals were considered, for which the sequencing outcome of all 22 variant loci was complete. Thus, it was possible to include 256 IBD patients (126 UC and 130 CD patients) and 148 controls. As shown in Table 8, four haplotypes (H1 to H4) were predicted to be in best reconstruction for both cohorts leading to eight different putatively occurring diplotypes (D1 to D8). All haplotypes and five diplotypes were predicted to occur at a frequency higher than 1% in the non-IBD control group.
Neither the overall haplotype nor the overall diplotype pattern varied significantly between the IBD group (or the IBD subgroups) and the control group. The result remained non-significant when investigating a possible relationship between the occurring haplotype or diplotype distribution pattern and disease activity (abundance of EIMs, fistulas, or high activity indices; Tables 9–11).
Table 9.
Haplotype and diplotype distribution in IBD cases with and without EIMs.
| Subjects included | H1 (CC) | H2 (CT) | H3 (GC) | H4 (GT) | P (a) | |
|---|---|---|---|---|---|---|
| IBD N (%) | 110 | 189.8 (86.2) | 10.2 (4.6) | 3.2 (1.5) | 16.8 (7.6) | 0.57 |
| OR (CI) | 1.18 (0.72–1.95) | 1.18 (0.50–2.80) | 0.44 (0.12–1.58) | 0.87 (0.46–1.67) | ||
| Controls(b) | 143 | 240.7 (84.1) | 11.4 (4.0) | 9.3 (3.3) | 24.7 (8.6) | |
| UC N (%) | 45 | 76.9 (85.5) | 5.1 (5.6) | 1.1 (1.2) | 6.9 (7.7) | 0.55 |
| OR (CI) | 1.15 (0.56–2.37) | 1.79 (0.51–6.25) | 0.36 (0.04–2.93) | 0.76 (0.3–1.93) | ||
| Controls(b) | 80 | 133.8 (83.6) | 5.2 (3.2) | 5.2 (3.2) | 15.8 (9.9) | |
| CD N (%) | 65 | 112.8 (86.8) | 5.2 (4.0) | 2.2 (1.7) | 9.8 (7.6) | 0.82 |
| OR (CI) | 1.18 (0.58–2.38) | 0.8 (0.24–2.66) | 0.49 (0.09–2.61) | 1.09 (0.42–2.79) | ||
| Controls(b) | 63 | 106.8 (84.8) | 6.2 (4.9) | 4.2 (3.3) | 8.8 (7.0) | |
|
| ||||||
| D1 (CC/CC) | D2 (CC/GT) | D3 (CC/GC) | D4 (CC/CT) | P (a) | ||
|
| ||||||
| IBD N (%) | 110 | 82.0 (74.5) | 14.8 (13.4) | 3.0 (2.7) | 8.0 (7.3) | |
| OR (CI) | 1.30 (0.75–2.27) | 0.82 (0.41–1.67) | 0.42 (0.11–1.58) | 0.94 (0.37–2.43) | ||
| Controls(b) | 143 | 99.0 (69.2) | 22.7 (15.8) | 9.0 (6.3) | 11.0 (7.7) | |
| UC N (%) | 45 | 33.0 (73.3) | (13.2) | 1.0 (2.2) | 4.0 (8.9) | |
| OR (CI) | 1.25 (0.55–2.82) | 0.73 (0.26–2.06) | 0.34 (0.04–3.01) | 1.46 (0.37–5.75) | ||
| Controls(b) | 80 | 55.0 (68.8) | 13.8 (17.3) | 5.0 (6.3) | 5.0 (6.3) | |
| CD N (%) | 65 | 49.0 (75.4) | 8.8 (13.6) | 2.0 (3.1) | 4.0 (6.2) | |
| OR (CI) | 1.32 (0.61–2.88) | 0.96 (0.35–2.63) | 0.47 (0.08–2.65) | 0.62 (0.17–2.32) | ||
| Controls(b) | 63 | 44.0 (69.8) | 8.8 (14.0) | 4.0 (6.3) | 6.0 (9.5) | |
|
| ||||||
| D5 (CT/GT) | D6 (GC/GT) | D7 (GC/CT) | D8 (GT/GT) | |||
|
| ||||||
| IBD N (%) | 2.0 (1.8) | NP | NP | 0.0 (0) | 0.36 | |
| OR (CI) | — | — | ||||
| Controls | 0.0 (0) | NP | NP | 1.0 (0.7) | ||
| UC N (%) | 1.0 (2.2) | NP | NP | 0.0 (0) | 0.6 | |
| OR (CI) | — | — | ||||
| Controls | 0.0 (0) | NP | NP | 1.0 (1.3) | ||
| CD N (%) | 1.0 (1.5) | NP | NP | NP | 0.73 | |
| OR (CI) | — | |||||
| Controls | 0.0 (0) | NP | NP | NP | ||
OR: odds ratio; CI: confidence interval; N: absolute number; H1–H4: haplotype 1—haplotype 4; D1–D8: diplotype 1—diplotype 8; EIMs: extraintestinal manifestations; NP: predicted not to appear in the case or control group; (a) P values calculated with FAMHAP; (b)the term “controls” denotes here the respective patient subgroup (IBD/UC/CD) without EIMs.
Table 11.
Haplotype and diplotype distribution in IBD cases with and without disease activity.
| Subjects included | H1 (CC) | H2 (CT) | H3 (GC) | H4 (GT) | P (a) | |
|---|---|---|---|---|---|---|
| IBD N (%) | 48 | 82.9 (84.6) | 3.1 (3.2) | 2.1 (2.2) | 9.9 (10.1) | 0.83 |
| OR (C.I.) | 0.99 (0.53–1.83) | 0.65 (0.19–2.21) | 0.88 (0.2–3.96) | 1.29 (0.6–2.74) | ||
| Controls (b) | 191 | 323.6 (84.7) | 18.4 (4.8) | 9.4 (2.5) | 30.6 (8.0) | |
| UC N (%) | 18 | 31.0 (86.0) | 1.0 (2.9) | 0.0 (0.1) | 4.0 (11.0) | 0.74 |
| OR (C.I.) | 1.16 (0.42–3.18) | 0.67 (0.08–5.23) | 0.04 (0.0–749.8) | 1.3 (0.41–4.09) | ||
| Controls (b) | 108 | 181.8 (84.2) | 9.2 (4.3) | 6.2 (2.9) | 18.8 (8.7) | |
| CD N (%) | 31 | 51.9 (83.7) | 2.1 (3.4) | 2.1 (3.4) | 5.9 (9.5) | 0.72 |
| OR (C.I.) | 0.88 (0.39–1.95) | 0.6 (0.13–2.76) | 1.79 (0.31–10.5) | 1.37 (0.49–3.86) | ||
| Controls (b) | 83 | 141.8 (85.4) | 9.2 (5.5) | 3.2 (1.9) | 11.8 (7.1) | |
|
| ||||||
| D1 (CC/CC) | D2 (CC/GT) | D3 (GC/CT) | D4 (CC/CT) | P (a) | ||
|
| ||||||
| IBD N (%) | 48 | 35.0 (71.4) | 8.9 (18.1) | NP | 2.0 (4.1) | |
| OR (C.I.) | 1.04 (0.52–2.08) | 1.31 (0.57–3.01) | 0.44 (0.10–1.95) | |||
| Controls (b) | 191 | 135.0 (70.7) | 27.6 (14.4) | NP | 17.0 (8.9) | |
| UC N (%) | 18 | 14.0 (77.8) | 3.0 (16.4) | NP | 0.0 (0) | |
| OR (C.I.) | 1.54 (0.47–5.03) | 1.07 (0.28–4.13) | — | |||
| Controls (b) | 108 | 75.0 (69.4) | 16.8 (15.5) | NP | 9.0 (8.3) | |
| CD N (%) | 31 | 21.0 (67.7) | 5.9 (19.0) | NP | 2.0 (6.5) | |
| OR (C.I.) | 0.81 (0.33–1.97) | 1.57 (0.52–4.72) | 0.65 (0.13–3.23) | |||
| Controls (b) | 83 | 60.0 (72.3) | 10.8 (13.0) | NP | 8.0 (9.6) | |
|
| ||||||
| D5 (CC/GC) | D6 (CT/GT) | D7 (GT/GT) | D8 (GC/GT) | |||
|
| ||||||
| IBD N (%) | 2.0 (4.1) | 1.0 (2.0) | 0.0 (0) | NP | 0.70 | |
| OR (C.I.) | 0.86 (0.18–4.12) | — | — | |||
| Controls | 9.0 (4.7) | 1.0 (0.5) | 1.0 (0.5) | NP | ||
| UC N (%) | 0.0 (0) | 1.0 (5.6) | 0.0 (0) | NP | 0.16 | |
| OR (C.I.) | — | — | — | |||
| Controls | 6.0 (5.6) | 0.0 (0) | 1.0 (0.9) | NP | ||
| CD N (%) | 2.0 (6.5) | 0.0 (0) | NP | NP | 0.80 | |
| OR (C.I.) | 1.84 (0.29–11.57) | — | ||||
| Controls | 3.0 (3.6) | 1.0 (1.2) | NP | NP | ||
OR: odds ratio; CI: confidence interval; N: absolute number; H1–H4: haplotype 1—haplotype 4; D1–D8: diplotype 1—diplotype 8; NP: predicted to not appear in the respective case or control group; (a) P values calculated with FAMHAP; (b)the term “controls” denotes here the respective patient subgroup (IBD/UC/CD) without the respective ongoing disease activity pattern investigated.
4. Discussion
PPARγ is an important modulator of pro- and anti-inflammatory signalling cascades involving NF-κB. The importance of PPARγ is underlined by the fact that efficient anti-inflammatory effects can be reached when targeting PPARγ therapeutically. An important example of an anti-inflammatory acting drug, which exerts agonistic effects on PPAR-γ and which is widely used in the therapy of especially UC is 5-aminosalicylic acid (5-ASA) [22].
Former studies, which investigated the impact of a polymorphic expression of PPARγ on diseases characterized by proinflammatory processes, focused specifically only on the analysis of the two commonly occurring NR1C3 SNPs rs1801282 and/or rs3856806. Several investigations showed that these NR1C3 gene variants are putatively associated with a moderately higher risk for the development of lifestyle-associated diseases (e.g., metabolic syndrome, coronary artery disease, and type 2 diabetes) or for colorectal cancer [23–29]. However, these findings were only partly supported in subsequent meta-analyses [30–32].
In the study presented here, we aimed at comprehensively investigating the occurring polymorphisms within the PPARγ gene by sequencing all exonic regions and neighbouring intronic sequences. We analysed the frequency of arising genotypes and haplotypes in a large cohort of IBD patients and non-IBD control subjects and investigated the impact of the observed NR1C3 variants on IBD susceptibility and disease course.
Interestingly, NR1C3 appears to be strongly conserved. Only the two genetic variants rs1801282 and rs3856806, which have already been described in the literature and which are characterized by a moderately strong linkage behaviour, were found to occur in an allelic frequency of >1%. This observation, together with the fact that all other detected NR1C3 gene mutations occurred alone in >99% of all cases and never in combination with other PPARγ gene variants in any individual included in our study, supports the important physiological function of PPARγ, which apparently does not allow a highly polymorphic expression of this protein.
We did not find any significant association of distinct NR1C3 haplotypes with higher IBD susceptibility or with a modified IBD course. A few other studies have hitherto investigated the impact of a polymorphic PPARγ expression on IBD susceptibility. These studies focused mainly on the investigation of the Pro12Ala polymorphism (rs1801282) and its putative influence on UC disease risk. These studies showed heterogeneous results. While [33] observing a significantly higher frequency of homozygous Pro12Ala SNP carriers in UC patients compared to controls in a Danish cohort, Shrestha et al. only observed a putative relationship between a higher UC disease activity and the occurrence of the Pro12Ala variant in a Dutch population, which they could not confirm in a Chinese cohort [34]. A third study focused specifically on the functional impact of the Pro12Ala SNP and showed that this variant appears to be associated with lower PPARγ mRNA levels in diseased mucosa of UC patients. This finding was combined with a higher prevalence of the Ala-variant in UC patients, when compared to CD patients and healthy controls. The latter observation, however, derives from only a relatively small number of individuals (29 UC and 10 CD patients, 134 controls), which were included in the analysis [35]. Two additional small studies did not find any significant impact of the SNP Pro12Ala on disease susceptibility for CD [36] or UC [37]. In the context of the heterogeneous study outcomes published so far, our study rather supports the hypothesis that a polymorphic expression of the PPARγ gene NR1C3 does not significantly influence the IBD risk or the course of the IBD forms, CD and UC.
5. Conclusions
In conclusion, we have performed a comprehensive study analyzing the role of NR1C3 genetic variants in IBD susceptibility and IBD course in a Swiss cohort of IBD patients. We showed that the polymorphic expression of the PPARγ gene is not a general modulating risk factor for IBD.
Supplementary Material
DNA sequences are shown in 5' to 3' direction. F, forward; R, reverse.
Table 10.
Haplotype and diplotype distribution in IBD cases with and without fistulas.
| Subjects included | H1 (CC) | H2 (CT) | H3 (GC) | H4 (GT) | P (a) | |
|---|---|---|---|---|---|---|
| IBD N (%) | 77 | 132.9 (86.3) | 7.1 (4.6) | 3.1 (2.0) | 10.9 (7.0) | 0.89 |
| OR (C.I.) | 1.13 (0.65–1.94) | 1.16 (0.46–2.9) | 0.77 (0.21–2.81) | 0.81 (0.40–1.67) | ||
| Controls (b) | 179 | 303.6 (84.8) | 14.4 (4.0) | 9.4 (2.6) | 30.6 (8.5) | |
| UC N (%) | 9 | 17.0 (94.4) | 0.0 (0.001) | 0.0 (0.001) | 1.0 (5.5) | 0.65 |
| OR (C.I.) | 0.02 (0.0–439897.28) | 0.03 (0.0–739520.9) | 0.57 (0.07–4.52) | |||
| Controls (b) | 117 | 195.8 (83.7) | 10.2 (4.4) | 6.2 (2.7) | 21.8 (9.3) | |
| CD N (%) | 68 | 115.8 (85.2) | 7.2 (5.3) | 3.2 (2.3) | 9.8 (7.2) | 0.90 |
| OR (C.I.) | 0.86 (0.43–1.74) | 1.6 (0.47–5.51) | 0.91 (0.19–4.42) | 1.02 (0.40–2.61) | ||
| Controls (b) | 72 | 107.8 (87.0) | 4.2 (3.3) | 3.2 (2.5) | 8.8 (7.1) | |
|
| ||||||
| D1 (CC/CC) | D2 (CC/GT) | D3 (GC/CT) | D4 (CC/CT) | P (a) | ||
|
| ||||||
| IBD N (%) | 77 | 57.0 (74.0) | 9.9 (12.8) | NP | 6.0 (7.8) | |
| OR (C.I.) | 1.17 (0.64–2.13) | 0.81 (0.37–1.76) | 1.08 (0.39–2.95) | |||
| Controls (b) | 179 | 127.0 (70.9) | 27.6 (15.4) | NP | 13.0 (7.3) | |
| UC N (%) | 9 | 8.0 (88.9) | 1.0 (11.0) | NP | 0.0 (0) | |
| OR (C.I.) | 3.56 (0.43–29.49) | 0.65 (0.08–5.53) | — | |||
| Controls (b) | 117 | 81.0 (69.2) | 18.8 (16.0) | NP | 9.0 (7.7) | |
| CD N (%) | 68 | 49.0 (72.1) | 8.8 (13.0) | NP | 6.0 (8.8) | |
| OR (C.I.) | 0.90 (0.41–1.95) | 0.90 (0.33–2.45) | 1.40 (0.38–5.23) | |||
| Controls (b) | 72 | 46.0 (74.2) | 8.8 (14.3) | NP | 4.0 (6.5) | |
|
| ||||||
| D5 (CC/GC) | D6 (CT/GT) | D7 (GT/GT) | D8 (GC/GT) | |||
|
| ||||||
| IBD N (%) | 3.0 (3.9) | 1.0 (1.3) | 0.0 (0) | NP | 0.98 | |
| OR (C.I.) | 0.77 (0.20–2.91) | — | — | |||
| Controls | 9.0 (5.0) | 1.0 (0.6) | 1.0 (0.6) | NP | ||
| UC N (%) | 0.0 (0) | 0.0 (0) | 0.0 (0) | NP | 0.67 | |
| OR (C.I.) | — | — | — | |||
| Controls | 6.0 (5.1) | 1.0 (0.9) | 1.0 (0.9) | NP | ||
| CD N (%) | 3.0 (4.4) | 1.0 (1.5) | NP | NP | 0.98 | |
| OR (C.I.) | 0.91 (0.18–4.67) | — | ||||
| Controls | 3.0 (4.8) | 0.0 (0) | NP | NP | ||
OR: odds ratio; CI: confidence interval; N: absolute number; H1–H4: haplotype 1—haplotype 4; D1–D8: diplotype 1—diplotype 8; NP: predicted to not appear in the respective case and control group; (a) P values calculated with FAMHAP; (b)the term “controls” denotes here the respective patient subgroup (IBD/UC/CD) without the appearance of fistulas.
Authors' Contribution
J. Mwinyi and C. Grete-Wenger contributed equally to this work.
Acknowledgments
The authors thank Christian Hiller for excellent technical assistance, members of our team for fruitful discussions, and the Swiss IBD Cohort Study Group (SIBDCS): Pierluigi Ballabeni, Peter Bauerfeind, Christoph Beglinger, Stefan Begré, José Bengoa, Janek Binek, Daniel Boller, Jan Borovicka, Christian Braegger, Patrick Brun, Patrick Bühr, Bernard Burnand, Rafael Camara, Dominique Criblez, Philippe de Saussure, Lukas Degen, Joakim Delarive, Tobias Ehmann, Matthias Engelmann, Ali El Wafa, Christian Felley, Alain Frei, Remus Frei, Michael Fried, Florian Froehlich, Suzanne Gallot-Lavallée, Tilman Gerlach, Martin Geyer, Marc Girardin, Oliver Goetze, Horst Haack, Serge Hediger, Peter Hengstler, Klaas Heyland, Patrick Janiak, Pascal Juillerat, Vera Kessler Brondolo, Christoph Knoblauch, Gerd A. Kullak-Ublick, Michael Manz, Rémy Meier, Christa Meyenberger, Pierre Michetti, Christian Mottet, Christoph Müller, Beat Müllhaupt, Thierry Nicolet, Andreas Nydegger, Isabelle Pache, Franziska Piccoli, Julia Pilz, Valérie Pittet, Ronald Rentsch, Jean-Pierre Rey, Silvia Rihs, Daniela Rogler, Gerhard Rogler, Markus Sagmeister, Bernhard Sauter, Niklaus Schaub, Susanne Schibli, Alain Schoepfer, Franck Seibold, Johannes Spalinger, Philippe Stadler, Michael Steuerwald, Alex Straumann, Michael Sulz, Michela Schäppi, Joël Thorens, John-Paul Vader, Stephan Vavricka, Jürg Vögtlin, Roland Von Känel, Gert Wachter, Jürg Wermuth, and Paul Wiesel. This study was financially supported by the Swiss National Science Foundation (Grant 320030_120463), the Swiss IBD Cohort Study (SNF Grant 33CSC0-108792), Zurich University Research Priority Programme “Integrative Human Physiology” (ZIHP), the Center of Clinical Research at the University Hospital Zurich, the Novartis Foundation for Biomedical Research, the IBD Research Foundation, and the Olga Mayenfisch Foundation.
Abbreviations
- IBD:
Inflammatory bowel disease
- UC:
Ulcerative colitis
- CD:
Crohn's disease
- PPARγ:
Peroxisome proliferator-activated receptor gamma
- SNP:
Single nucleotide polymorphism
- NR1C3:
Nuclear receptor subfamily 1, group C, member 3
- EIMs:
Extraintestinal manifestations.
- MTWSI:
Modified truelove witts severity index
- CDAI:
Crohn's disease activity index.s
References
- 1.Bosani M, Ardizzone S, Porro GB. Biologic targeting in the treatment of inflammatory bowel diseases. Biologics. 2009;3:77–97. [PMC free article] [PubMed] [Google Scholar] [Retracted]
- 2.Weersma RK, Stokkers PC, van Bodegraven AA, et al. Molecular prediction of disease risk and severity in a large Dutch Crohn's disease cohort. Gut. 2009;58(3):388–395. doi: 10.1136/gut.2007.144865. [DOI] [PubMed] [Google Scholar]
- 3.Ferguson LR, Huebner C, Petermann I, et al. Single nucleotide polymorphism in the tumor necrosis factor-alpha gene affects inflammatory bowel diseases risk. World Journal of Gastroenterology. 2008;14(29):4652–4661. doi: 10.3748/wjg.14.4652. [DOI] [PMC free article] [PubMed] [Google Scholar]
- 4.Glas J, Stallhofer J, Ripke S, et al. Novel genetic risk markers for ulcerative colitis in the IL2/IL21 region are in epistasis with IL23R and suggest a common genetic background for ulcerative colitis and celiac disease. American Journal of Gastroenterology. 2009;104(7):1737–1744. doi: 10.1038/ajg.2009.163. [DOI] [PubMed] [Google Scholar]
- 5.Hugot JP, Chamaillard M, Zouali H, et al. Association of NOD2 leucine-rich repeat variants with susceptibility to Crohn's disease. Nature. 2001;411(6837):599–603. doi: 10.1038/35079107. [DOI] [PubMed] [Google Scholar]
- 6.Ogura Y, Bonen DK, Inohara N, et al. A frameshift mutation in NOD2 associated with susceptibility to Crohn's disease. Nature. 2001;411(6837):603–606. doi: 10.1038/35079114. [DOI] [PubMed] [Google Scholar]
- 7.McGovern D, Ahmad T. New IBD genes? Gut. 2005;54(8):1060–1061. doi: 10.1136/gut.2004.048918. [DOI] [PMC free article] [PubMed] [Google Scholar]
- 8.Rigoli L, Romano C, Caruso RA, et al. Clinical significance of NOD2/CARD15 and Toll-like receptor 4 gene single nucleotide polymorphisms in inflammatory bowel disease. World Journal of Gastroenterology. 2008;14(28):4454–4461. doi: 10.3748/wjg.14.4454. [DOI] [PMC free article] [PubMed] [Google Scholar]
- 9.Dubuquoy L, Rousseaux C, Thuru X, et al. PPARγ as a new therapeutic target in inflammatory bowel diseases. Gut. 2006;55(9):1341–1349. doi: 10.1136/gut.2006.093484. [DOI] [PMC free article] [PubMed] [Google Scholar]
- 10.Kliewer SA, Umesono K, Noonan DJ, Heyman RA, Evans RM. Convergence of 9-cis retinoic acid and peroxisome proliferator signalling pathways through heterodimer formation of their receptors. Nature. 1992;358(6389):771–774. doi: 10.1038/358771a0. [DOI] [PMC free article] [PubMed] [Google Scholar]
- 11.Fajas L, Auboeuf D, Raspé E, et al. The organization, promoter analysis, and expression of the human PPARγ gene. Journal of Biological Chemistry. 1997;272(30):18779–18789. doi: 10.1074/jbc.272.30.18779. [DOI] [PubMed] [Google Scholar]
- 12.Desreumaux P, Dubuquoy L, Nutten S, et al. Attenuation of colon inflammation through activators of the retinoid X receptor (RXR)/peroxisome proliferator-activated receptor γ (PPARγ) heterodimer: a basis for new therapeutic strategies. Journal of Experimental Medicine. 2001;193(7):827–838. doi: 10.1084/jem.193.7.827. [DOI] [PMC free article] [PubMed] [Google Scholar]
- 13.Yang XY, Wang LH, Chen T, et al. Activation of human T lymphocytes is inhibited by peroxisome proliferator-activated receptor γ (PPARγ) agonists. PPARγ co-association with transcription factor NFAT. Journal of Biological Chemistry. 2000;275(7):4541–4544. doi: 10.1074/jbc.275.7.4541. [DOI] [PubMed] [Google Scholar]
- 14.Bassaganya-Riera J, Reynolds K, Martino-Catt S, et al. Activation of PPAR γ and δ by conjugated linoleic acid mediates protection from experimental inflammatory bowel disease. Gastroenterology. 2004;127(3):777–791. doi: 10.1053/j.gastro.2004.06.049. [DOI] [PubMed] [Google Scholar]
- 15.Desreumaux P, Dubuquoy L. PPARγ agonists as a new class of effective treatment for ulcerative colitis. Inflammatory Bowel Diseases. 2009;15(6):959–960. doi: 10.1002/ibd.20765. [DOI] [PubMed] [Google Scholar]
- 16.Yen CJ, Beamer BA, Negri C, et al. Molecular scanning of the human peroxisome proliferator activated receptor γ (hPPARγ) gene in diabetic Caucasians: identification of a Pro12Ala PPARγ2 missense mutation. Biochemical and Biophysical Research Communications. 1997;241(2):270–274. doi: 10.1006/bbrc.1997.7798. [DOI] [PubMed] [Google Scholar]
- 17.Deeb SS, Fajas L, Nemoto M, et al. A Pro12Ala substitution in PPARγ2 associated with decreased receptor activity, lower body mass index and improved insulin sensitivity. Nature Genetics. 1998;20(3):284–287. doi: 10.1038/3099. [DOI] [PubMed] [Google Scholar]
- 18.Pittet V, Juillerat P, Mottet C, et al. Cohort profile: the Swiss Inflammatory Bowel Disease Cohort Study (SIBDCS) International Journal of Epidemiology. 2009;38(4):922–931. doi: 10.1093/ije/dyn180. [DOI] [PubMed] [Google Scholar]
- 19.Heude B, Pelloux V, Forhan A, et al. Association of the Pro12Ala and C1431T variants of PPARγ and their haplotypes with susceptibility to gestational diabetes. Journal of Clinical Endocrinology and Metabolism. 2011;96(10):E1656–E1660. doi: 10.1210/jc.2011-0381. [DOI] [PubMed] [Google Scholar]
- 20.Meirhaeghe A, Fajas L, Helbecque N, et al. Impact of the Peroxisome Proliferator Activated Receptor γ2 Pro12Ala polymorphism on adiposity, lipids and non-insulin-dependent diabetes mellitus. International Journal of Obesity. 2000;24(2):195–199. doi: 10.1038/sj.ijo.0801112. [DOI] [PubMed] [Google Scholar]
- 21.Valve R, Sivenius K, Miettinen R, et al. Two polymorphisms in the peroxisome proliferator-activated receptor-γ gene are associated with severe overweight among obese women. Journal of Clinical Endocrinology and Metabolism. 1999;84(10):3708–3712. doi: 10.1210/jcem.84.10.6061. [DOI] [PubMed] [Google Scholar]
- 22.Rousseaux C, Lefebvre B, Dubuquoy L, et al. Intestinal antiinflammatory effect of 5-aminosalicylic acid is dependent on peroxisome proliferator-activated receptor-γ . Journal of Experimental Medicine. 2005;201(8):1205–1215. doi: 10.1084/jem.20041948. [DOI] [PMC free article] [PubMed] [Google Scholar]
- 23.Altshuler D, Hirschhorn JN, Klannemark M, et al. The common PPARγ Pro12Ala polymorphism is associated with decreased risk of type 2 diabetes. Nature Genetics. 2000;26(1):76–80. doi: 10.1038/79216. [DOI] [PubMed] [Google Scholar]
- 24.Landi S, Moreno V, Gioia-Patricola L, et al. Association of common polymorphisms in inflammatory genes interleukin (IL)6, IL8, tumor necrosis factor α, NFKB1, and peroxisome proliferator-activated receptor γ with colorectal cancer. Cancer Research. 2003;63(13):3560–3566. [PubMed] [Google Scholar]
- 25.Koh WP, Yuan JM, van den Berg D, Ingles SA, Yu MC. Peroxisome proliferator-activated receptor (PPAR) γ gene polymorphisms and colorectal cancer risk among Chinese in Singapore. Carcinogenesis. 2006;27(9):1797–1802. doi: 10.1093/carcin/bgl001. [DOI] [PubMed] [Google Scholar]
- 26.Meirhaeghe A, Fajas L, Helbecque N, et al. A genetic polymorphism of the peroxisome proliferator-activated receptor γ gene influences plasma leptin levels in obese humans. Human Molecular Genetics. 1998;7(3):435–440. doi: 10.1093/hmg/7.3.435. [DOI] [PubMed] [Google Scholar]
- 27.Jiang J, Gajalakshmi V, Wang J, et al. Influence of the C161T but not Pro12Ala polymorphism in the peroxisome proliferator-activated receptor-gamma on colorectal cancer in an Indian population. Cancer Science. 2005;96(8):507–512. doi: 10.1111/j.1349-7006.2005.00072.x. [DOI] [PMC free article] [PubMed] [Google Scholar]
- 28.Wang XL, Oosterhof J, Duarte N. Peroxisome proliferator-activated receptor γ C161→ T polymorphism and coronary artery disease. Cardiovascular Research. 1999;44(3):588–594. doi: 10.1016/s0008-6363(99)00256-4. [DOI] [PubMed] [Google Scholar]
- 29.Chao TH, Li YH, Chen JH, et al. The 161TT genotype in the exon 6 of the peroxisome-proliferator-activated receptor γ gene is associated with premature acute myocardial infarction and increased lipid peroxidation in habitual heavy smokers. Clinical Science. 2004;107(5):461–466. doi: 10.1042/CS20040014. [DOI] [PubMed] [Google Scholar]
- 30.Zafarmand MH, van der Schouw YT, Grobbee DE, de Leeuw PW, Bots ML. Peroxisome proliferator-activated receptor gamma-2 P12A polymorphism and risk of acute myocardial infarction, coronary heart disease and ischemic stroke: a case-cohort study and meta-analyses. Vascular Health and Risk Management. 2008;4(2):427–436. doi: 10.2147/vhrm.s2397. [DOI] [PMC free article] [PubMed] [Google Scholar]
- 31.Xu W, Li Y, Wang X, et al. PPARgamma polymorphisms and cancer risk: a meta-analysis involving 3238 subjects. Oncology Reports. 2010;24(2):579–585. [PubMed] [Google Scholar]
- 32.Gouda HN, Sagoo GS, Harding AH, Yates J, Sandhu MS, Higgins JPT. The association between the peroxisome proliferator-activated receptor-γ2 (PPARG2) Pro12Ala gene variant and type 2 diabetes mellitus: a HuGE review and meta-analysis. American Journal of Epidemiology. 2010;171(6):645–655. doi: 10.1093/aje/kwp450. [DOI] [PMC free article] [PubMed] [Google Scholar]
- 33.Andersen V, Christensen J, Ernst A, et al. Polymorphisms in NF-κB, PXR, LXR, PPARγ and risk of inflammatory bowel disease. World Journal of Gastroenterology. 2011;17(2):197–206. doi: 10.3748/wjg.v17.i2.197. [DOI] [PMC free article] [PubMed] [Google Scholar]
- 34.Shrestha UK, Karimi O, Crusius JB, et al. Distribution of peroxisome proliferator-activated receptor-gamma polymorphisms in Chinese and Dutch patients with inflammatory bowel disease. Inflammatory Bowel Diseases. 2010;16(2):312–319. doi: 10.1002/ibd.21059. [DOI] [PubMed] [Google Scholar]
- 35.Aoyagi Y, Nagata S, Kudo T, et al. Peroxisome proliferator-activated receptor γ 2 mutation may cause a subset of ulcerative colitis. Pediatrics International. 2010;52(5):729–734. doi: 10.1111/j.1442-200X.2010.03195.x. [DOI] [PubMed] [Google Scholar]
- 36.Leung E, Hong J, Fraser AG, Merriman TR, Vishnu P, Krissansen GW. Peroxisome proliferator-activated receptor-γ gene polymorphisms and Crohn's disease. International Journal of Colorectal Disease. 2007;22(4):453–454. doi: 10.1007/s00384-005-0085-2. [DOI] [PubMed] [Google Scholar]
- 37.Wang F, Tahara T, Arisawa T, et al. Polymorphism of peroxisome proliferator-activated receptor gamma is not associated to Japanese ulcerative colitis. Hepato-Gastroenterology. 2008;55(81):73–75. [PubMed] [Google Scholar]
Associated Data
This section collects any data citations, data availability statements, or supplementary materials included in this article.
Supplementary Materials
DNA sequences are shown in 5' to 3' direction. F, forward; R, reverse.