

Abstract
Motivation: The identity of cells and tissues is to a large degree governed by transcriptional regulation. A major part is accomplished by the combinatorial binding of transcription factors at regulatory sequences, such as enhancers. Even though binding of transcription factors is sequence-specific, estimating the sequence similarity of two functionally similar enhancers is very difficult. However, a similarity measure for regulatory sequences is crucial to detect and understand functional similarities between two enhancers and will facilitate large-scale analyses like clustering, prediction and classification of genome-wide datasets.
Results: We present the standardized alignment-free sequence similarity measure N2, a flexible framework that is defined for word neighbourhoods. We explore the usefulness of adding reverse complement words as well as words including mismatches into the neighbourhood. On simulated enhancer sequences as well as functional enhancers in mouse development, N2 is shown to outperform previous alignment-free measures. N2 is flexible, faster than competing methods and less susceptible to single sequence noise and the occurrence of repetitive sequences. Experiments on the mouse enhancers reveal that enhancers active in different tissues can be separated by pairwise comparison using N2.
Conclusion: N2 represents an improvement over previous alignment-free similarity measures without compromising speed, which makes it a good candidate for large-scale sequence comparison of regulatory sequences.
Availability: The software is part of the open-source C++ library SeqAn (www.seqan.de) and a compiled version can be downloaded at http://www.seqan.de/projects/alf.html
Contact: goeke@molgen.mpg.de; vingron@molgen.mpg.de
Supplementary information: Supplementary data are available at Bioinformatics online.
1 INTRODUCTION
Mammalian organisms consist of several hundred different cell types. Every cell has the same repertoire of genes; however, only a subset will be expressed to enable cell type-specific phenotypes. Many different factors regulate gene expression, of which genetically encoded transcriptional regulation seems to play the major part (Wilson et al., 2008). Sequence-dependent gene regulation is mainly achieved through the binding of transcription factors at short DNA motifs. These transcription factor binding sites often occur in regulatory clusters in the genome, called cis-regulatory modules (CRMs). Some CRMs can repress transcription, whereas others, referred to as ‘enhancers’, can enhance gene expression. Studies in Drosophila showed that the combination of binding sites together with the set of transcription factors actively recruited to a CRM determines its cell type specificity (Goto et al., 1989; Small et al., 1991; Zinzen et al., 2009). More generally speaking, regulatory sequences with a similar binding site content can be expected to drive similar expression patterns. This is analogous to coding sequences, where sequence similarity has been used for many years to estimate functional similarity. The pairwise similarity of coding sequences is usually computed using global (Needleman and Wunsch, 1970) or local (Smith and Waterman, 1981) alignments. This approach works well for sequences which are at least partially alignable; however, this is not the case for non-homologous CRMs. The location and orientation of binding sites in CRMs that show similar cell type-specific activity may differ widely, making it impossible to produce alignments.
Alignment-free methods compare sequences according to their word content, see (Vinga and Almeida, 2003) for an overview. The initial purpose was to design a fast and accurate measure of pairwise (dis-)similarity that could be used in databases where traditional alignments were too slow (Blaisdell, 1986; Carpenter et al., 2002; Hide et al., 1994). In the meantime, alignment-free methods have been applied in other contexts such as phylogeny (Wu et al., 2009) and motif finding (Gordân et al., 2010). The idea to describe a sequence by its word content directly fits the model of CRMs, where we assume that a similar function is reflected in a similar binding site content.
Word count-based methods have been used to compare regulatory sequences (Kantorovitz et al., 2007; van Helden, 2004). However, these methods calculate the similarity of sequences based on exact word counts, whereas transcription factor binding sites are generally more flexible patterns. Furthermore, the genomic orientation of CRMs and of the binding sites within is most often unknown, highlighting the need to compare sequences according to the word counts on both strands simultaneously. As an example, the word w=CATAAT might be bound by the same transcription factor as the words CTTAAT and ATTATG, the former having one substitution, the latter being on the reverse strand. Exact word comparison methods consider these words dissimilar. More generally, let n(w) be the set of words which are similar to w (the ‘neighbourhood’ of w). To overcome the limitation of exact word comparison methods, we need to develop a similarity measure that compares sequences based on word neighbourhoods. Theoretical approaches that consider approximate word matches have been studied before (Burden et al., 2008; Forêt et al., 2006); however, no applicable method has been published for the purpose of pairwise comparison.
In this study we define N2, an alignment-free comparison method that integrates all words in the neighbourhood of w. We compare N2 to other alignment-free methods on simulated sequences and tissue-specific enhancer sequences identified in vivo in mouse embryos. The code and an executable file of the N2 similarity and other alignment-free methods presented here is available as part of the open-source C++ library SeqAn (Doering et al., 2008).
2 METHOD
2.1 The N2 similarity score
Traditionally, the idea of alignment-free methods is to compare two sequences S1 and S2, of length l1 and l2, based on the numbers of occurrences of all words w of length k over the alphabet Σ={A, C, G, T}. Let A be the set of all such words w with |A| being the total number of words (4k in the case of DNA sequences). We associate a sequence S of length l with the word count vector
| (1) |
| (2) |
To overcome the restriction to exact word counts, we extend Equation (2) to word neighbourhood counts. We define the set of words in the neighbourhood of the word w as n(w). The neighbourhood may be defined appropriately for every application, for example, to fit transcription factor binding motifs, to allow for reverse complement word counts or to include mismatches. Integrating neighbourhood counts for every word w reduces the influence of w itself. This leads to word counts ‘smoothing’, i.e. inexact words are considered similar, and also to ‘blurring’, since inexact words might not be related. To control for these effects, we associate every word w′ in n(w) with a weight aw′ which may differ for the considered application. We then compute the weighted word neighbourhood counts Nn(w) for every word w of the sequence S:
Depending on the choice of n(w), Nn(w)S might be the sum of highly dependent variables since word occurrences of overlapping words such as CAAAA and AAAAA are strongly correlated. Additionally, the variance of individual word counts should be considered, since, for example, a high number of CAGCTG occurrences is more informative than a high count of self overlapping words such as AAAAAA where a Poly-A stretch of length 15 already gives 10 occurrences. Furthermore, some words are more likely to occur than others, GC-rich words for example are less frequent in mammalian genomes than AT-rich words. We correct for inter-variable dependency, word count variances and word probabilities by standardizing the word neighbourhood counts:
Since the word counts might be dependent, the covariance of all words in the word neighbourhood has to be computed to obtain 𝕍[Nn(w)S] (Section 2.2). We now calculate the normalized standardized neighbourhood count vector 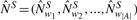 with
with
where ‖·‖ represents the Euclidean norm. We define the N2 similarity of two sequences as the inner product of their normalized standardized word neighbourhood count vectors:
| (3) |
| (4) |
As a consequence of the normalization, −1≤N2(S1, S2)≤1, and S1=S2⇒N2(S1, S2)=1, i.e. equal sequences will always have the maximum pairwise similarity of 1.
2.2 Calculation of expected value and variance
The N2 score can be computed with Markov models of any order. Here, we illustrate the calculation of the expected value 𝔼[Nn(w)S] and variance 𝕍[Nn(w)S] assuming a first-order Markov model. For clarity, the superscript indicator for sequence S is omitted in the following. Let the sequences be modelled by a first-order homogeneous stationary Markov chain with transition probabilities π(i, j) (Robin et al., 2005). The probability μ(w) that a word w occurs at a specific position i depends on the probability that the first letter occurs, denoted μ(w[1]) (stationarity of the Markov chain) and can be calculated as follows:
With this at hand, we can calculate the expected value 𝔼[Nn(w)] of the word neighbourhood counts (Robin et al., 2005):
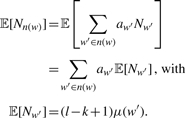 |
The variance is important to correct for the dependency of overlapping words in the word neighbourhood. The variance 𝕍[Nn(w)] of the word neighbourhood counts corresponds to the variance of the sum of the weighted word counts Nw:
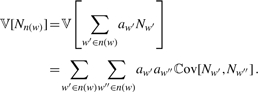 |
The covariance of word counts can be calculated according to (Robin et al., 2005):
| (5) |
| (6) |
| (7) |
| (8) |
| (9) |
| (10) |
| (11) |
| (12) |
with ϵ indicating word overlaps:
In the case where w=w′, we have ℂov[Nw, Nw′]=𝕍[Nw]. The word count variance can be calculated as follows (Robin et al., 2005):
| (13) |
| (14) |
| (15) |
| (16) |
| (17) |
Terms (17) and (11) are costly to compute and have minor effects on the variance and covariance. In the following, we will therefore neglect those terms, thereby assuming that the occurrence of non-overlapping words is independent of the sequence in between (μ(w[1])≈πt(w[k], w[1])).
2.3 Implementation and instances of N2
The implementation that we provide for N2 is part of the SeqAn library (Doering et al., 2008). It requires a set of sequences in .fasta format as input and returns a matrix with all pairwise similarity scores. The word length k (default k=5) and the background model order (default 1) may be chosen manually and the normalized standardized word neighbourhood counts may be returned to obtain additional information on important words. The calculation of the scores is divided into two steps, a pre-processing step and a comparison step.
The pre-processing step is run for every sequence individually. We estimate the background Markov model, count the words and calculate the word's probabilities and covariances. To avoid computing the full covariance matrix, only required entries are dynamically computed and stored. We then compute the standardized normalized word neighbourhood counts. The running time of this step depends on the length of the input sequences, the Markov model's order, the word length and the size of the word neighbourhood. It is linear in the number of input sequences.
In the comparison step, the inner product of the standardized normalized word neighbourhood counts is computed for all pairs of sequences. The running time of this step depends on the word's length and is quadratic in the number of input sequences.
The most basic instance of N2, with n(w)=w will be referred to as N2*. In our implementation, n(w) may be extended to include its reverse complement (rc),
| (18) |
all words equal to w with one mismatch (mm),
| (19) |
or the combination of both (mm, rc), where
| (20) |
In the following, we will refer to these instances as N2rc, N2mm, N2mm,rc. The word count of w (and its reverse complement when selected) is always weighted with aw=1, for all other words w′ in n(w) an alternative weight aw′ may be chosen. The weights for mismatch neighbourhood counts are indicated in superscript, we use aw′=1 (N2mm(1.0)) if not stated otherwise. Note that in Equations (19) and (20) our neighbourhood definition only covers direct neighbours, not neighbours of neighbours.
2.4 Other methods
The simplest score between two sequences S1 and S2 is obtained by calculating either the euclidean distance (Blaisdell, 1986) or the inner product (Lippert et al., 2002) of the word count vectors NS1 and NS2 as defined in Equation(1). Both methods are called D2 and have been applied to biological data (Carpenter et al., 2002; Hide et al., 1994). Here we focus on the latter version using the inner product:
 |
D2 is directly dependent on the length of the sequences, it can therefore not be used for comparing sequences of different length.
The D2 z−score (D2z) was proposed to obtain a standardized D2 score for which the significance can be estimated (Kantorovitz et al., 2007):
The expected value for D2 has been studied for approximate word matches, and upper and lower bounds for the variance have been calculated (Burden et al., 2008). This work is largely of theoretical nature for Bernoulli background models and no implementation is provided, and therefore we could not integrate this work into the analysis (Section 4).
The D2*score (Reinert et al., 2009) standardizes the word counts instead of the inner product. Similarly to N2, D2*is defined as the inner product of the standardized word counts as shown in Equation (3), but in this case n(w) only contains w itself, and the background model is computed on the concatenation of both sequences.
Let μ(w) be the probability of w, the expectation of NwS is then estimated by 𝔼[NwS]=(l−k+1)μ(w). The authors assume a Poisson distribution, which implies that the variance is equal to the expected value. D2*was originally proposed with a Bernoulli background model for the computation of μ(w). Here, we extended this score to use Markov background models of higher order. For the purpose of pairwise comparison, the D2, D2*and D2z scores have been implemented in the SeqAn library (Doering et al., 2008) and are part of the executable that is available online.
2.5 Estimating the background Markov model
Calculation of the expected value and variance of the word counts assumes that we know the background model that describes the sequence. For N2, we estimate the background model separately for every sequence. This allows us to precompute word probabilities and variances (Section 2.3) leading to a great reduction in computational costs. Since CpG dinucleotides in mammalian genomic sequences are very rare (Gardiner-Garden and Frommer, 1987), a Bernoulli background model is insufficient to estimate word probabilities. This can be seen on simulations, where the first-order Markov model consistently outperforms the Bernoulli model across all methods (Supplementary Table S1). The optimal order for the Markov background model for enhancer sequences is an unknown function of organism complexity and sequence length. Due to the limited size of enhancer sequences, estimating higher order Markov models likely results in overfitting and poor estimates. Our analysis will therefore rely on a first-order Markov chain as background model for all methods throughout this analysis.
2.6 Masking repeats
Repeats such as SINE elements have a substantial influence on pairwise scores. We use the UCSC pre-masked genome sequence [hg19, RepeatMasker (www.repeatmasker.org), TandemRepeatsFinder (Benson, 1999)] in order to hide those repetitive elements. Any repeat-masked sequence is split into a set of repeat-free subsequences by cutting out all repeat regions. Words are counted in this set such that no artificial words are created by concatenation. We use (number of counted words)+k−1 as an estimation of the length of the repeat-free sequence. Repeat-masked sequences are treated equally for all methods. Note that this is slightly different to the original method proposed for D2z, which introduced artificial words by concatenating sequences.
3 RESULTS
3.1 N2 can be computed quickly
Genome-wide datasets consist of many thousand regulatory sequences. The computation of pairwise similarities needs to be efficient for large-scale usage. We estimated the running time of each score on sets with various numbers of sequences where we computed the matrix of all pairwise similarities (quadratic number of scores computed). The methods show strong differences in practise (Fig. 1), but N2 and its variants are always faster than the other scores with a statistical model for realistically chosen numbers. Computing pairwise scores for 5000 enhancers with k=6 takes 2 h for N2*(4 h for N2rc, 20 h for N2rc,mm), it takes about 42 h for D2*and 91 h for D2z.
Fig. 1.
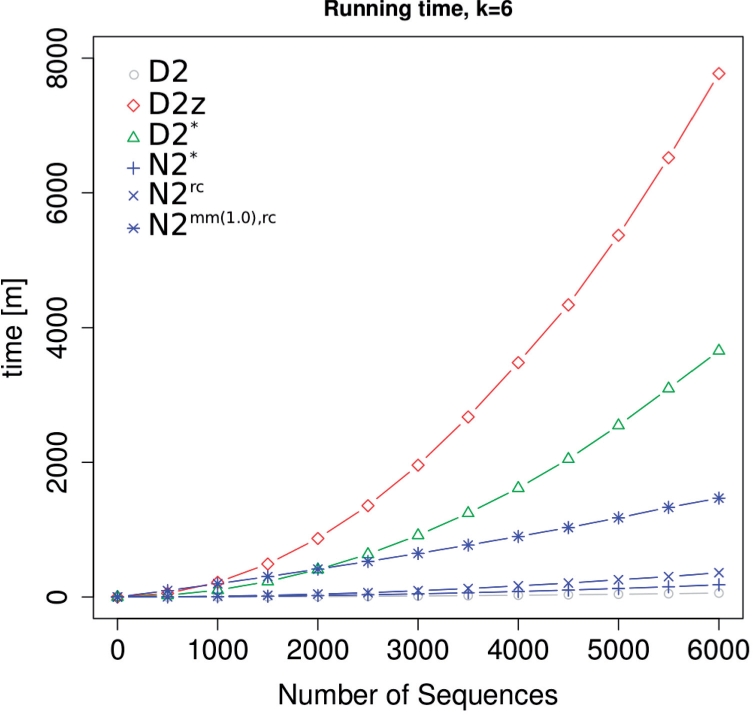
Running time comparison. All pairwise scores were calculated for random sequences of length 1000 bp.
The computation of N2 is dominated by the pre-processing step, which scales linearly in the number of sequences since the neighbourhood counts are calculated once for every sequence in advance (Fig. 1, Table 1, Section 2). In contrast, D2z and D2*cannot pre-compute normalized counts like N2, and scale quadratically in the number of sequences. D2z calculates z-scores on pairs of sequences which are not pre-processed (Kantorovitz et al., 2007), and D2*calculates the background model on the concatenation of sequences that cannot be pre-computed (Reinert et al., 2009). While this is likely to increase the accuracy of the model, running times are drastically higher. Computing pairwise scores for realistically large datasets is therefore nearly impossible for both D2z and D2*. This makes the N2 score very attractive for large-scale applications such as classification of regulatory sequences, or applications that support pre-computed data structures such as database searches.
Table 1.
Running time of the different methods in O notation.
| Running time in O notation | |
|---|---|
| D2 | O(nl+n24k) |
| D2z | (Kantorovitz et al., 2007) |
| D2* | O(n2(l+4k+4m)) |
| N2 | O(n(l+4m+4kNeighbourhoodSize2)+n24k) |
n: number of sequences; l: average sequence length; k:k-mer size; m: Markov model order. The running time for D2*is dominated by the quadratic term. The running time for N2 is dominated by the linear term (pre-processing).
3.2 N2 is robust against single sequence noise
Ideally, the pairwise score between two sequences should reflect the sequences' similarity. However, in practise, word count-based methods can be heavily influenced by noise specific to individual sequences, meaning that some sequences will intrinsically have high (or low) scores (Lippert et al., 2002; Reinert et al., 2009). Without proper correction, the pairwise score is an attribute of the individual sequence rather than of the pair of sequences. This is especially prominent for D2, where a high number of occurrences of a repetitive self-overlapping word (such as AAAAA) in one sequence will always induce high pairwise scores. To quantify the influence of single sequence-specific noise on pairwise scores, we studied the behaviour of D2, D2z, D2 and N2 for scoring pairs of unrelated sequences simulated by the same background model. We calculated scores for all sequence pairs (Si, Sj) for 500 such unrelated sequences. We chose a threshold t to select the top 5% highest scoring sequence pairs (high scoring pairs). For every sequence Si, we calculated the number of high scoring pairs Ci: Ci=∑j1(score(Si, Sj)≥t). Since all sequences were generated by the same model, the expected value of Ci, 𝔼(Ci), is equal for all sequences Si. Here, 5% of the 499 sequence pairs of Si are expected to have a score greater than t, thus 𝔼(Ci)=24.95. As as reference, we calculated C={C1,…, Ci} when we randomly assign scores to sequence pairs. This method is not influenced by the sequence at all and therefore recapitulates the expected behaviour for the unrelated sequence pairs (Fig. 2, black line). We then calculated C for the four alignment-free sequence comparison methods.
Fig. 2.

Influence of single sequences on pairwise scores. All pairwise scores for 500 sequences generated by the same model were calculated. Ci measures the number of sequence pairs for sequence Si among the highest 5% of all scores (high scoring pairs). Since all sequences were created using the same model, the distribution of C={C1,…, Ci} from alignment-free methods should be similar to the distribution of C obtained from a random scoring method (‘expected’, black line). A different distribution would indicate that the number of high scoring pairs is strongly dependent on the individual sequence, indicating that pairwise scores are dependent on the single sequence noise rather than on the similarity of the sequence pair. (A) Uniform nucleotide distribution, all methods show the expected behaviour. (B) AT-rich nucleotide distribution, D2 and D2z differ from the expected behaviour, showing that these pairwise scores are strongly influenced by the sequence composition.
The distribution of C when N2*is used is close to the expected distribution for unrelated sequences (Fig. 2). This shows that N2 is robust against single sequence-specific noise as the numbers of high scoring sequence pairs are not influenced by the individual sequences (see Supplementary Figs S1 and S2 for N2rc and N2mm,rc). In contrast, D2 and D2z show a very different distribution of C from the expected behaviour in the non-uniform case. Figure 2B shows that the number of high scoring pairs strongly varies, suggesting that the expected number for Ci is different for every sequence Si, even though all sequences were generated by the same model. This shows that the number of high scoring pairs detected with these methods is strongly influenced by the individual sequence, indicating that pairwise scores measure the individual sequence composition and not the similarity of the sequence pair. Prior work comparing regulatory sequences using alignment-free methods did not consider this effect (Dai et al., 2008; Kantorovitz et al., 2007). The above results confirm that neither the D2 nor the D2z-score should be applied to real biological sequences (Lippert et al., 2002; Reinert et al., 2009).
Other sequence noise such as repeats and stretches of low complexity occurs frequently in genomic data. N2 is more robust to this type of noise than D2*and D2z due to its correction for word overlaps and normalization of counts (Supplementary Table S2). Our analysis suggests that N2 should be used when repeat-masking is not an option.
3.3 Simulation studies
To test the performance of N2 on simulated data, we randomly generated sequences with a similar dinucleotide content as the mouse genome (Thomas-Chollier et al., 2011) (mm9) as background sequences (negative set). We then implanted m randomly chosen motifs of length 5 r times into the same background sequences to simulate CRMs (‘positive set’; m1r8: m=1, r=8; m4r2: m=4, r=2). Following (Kantorovitz et al., 2007), we computed all pairwise scores for the corresponding negative and the positive sets. The pairwise scores from the negative and the positive sets were combined and ranked. Based on this ranked list, we evaluated the performance of the above methods for pairwise sequence comparison using the area under ROC curve (AUC ROC) and area under precision–recall curve (AUC PR). We further estimated the interpolated precision at 5% recall which we term 5 precision for short. Results show average values over 25 simulations, each time drawing 100 random sequences of length 1000 bp and inserting random motifs, thus covering different motif compositions in an unbiased way. We tested the performance counting words of size k=6 using a first-order Markov model for word probabilities (see Supplementary Tables S3 and S4 for k=5).
We simulated two different settings to evaluate the performance of the neighbourhood concept of N2. First, we implanted randomly sampled 5mers into the forward and backward strand of the sequences to simulate the orientation independence of binding sites in CRMs. We specifically designed the N2rc variant for this scenario and, indeed, N2rc performs best (Table 2). Second, we randomly sampled words and implanted these with one mismatch at a random position to simulate more flexible motifs. The N2mm variant was designed for this scenario as it considers the word neighbourhood for the similarity. In these simulations, the N2mm variant with mismatch weights aw=1.0 shows the best performance, demonstrating the value of neighbourhood counts to score sequences with approximate word matches (Table 3, see Supplementary Figs S3 and S4 for different choices of aw). These simulations confirm the value of extending exact word count methods to word neighbourhoods.
Table 2.
Comparison of the different methods (k=6) when the genomic orientation of the motif is unknown
| Performance with implanted k-mers, random strand |
|||||||
|---|---|---|---|---|---|---|---|
| 5%Precision |
AUC ROC |
AUC PR |
|||||
| Motif setting: | m1r8 | m4r2 | m1r8 | m4r2 | m1r8 | m4r2 | |
| D2 | 0.88 | 0.59 | 0.72 | 0.54 | 0.72 | 0.54 | |
| D2z | 0.91 | 0.64 | 0.74 | 0.56 | 0.73 | 0.56 | |
| D2* | 0.87 | 0.66 | 0.71 | 0.58 | 0.70 | 0.57 | |
| N2* | 0.86 | 0.65 | 0.71 | 0.58 | 0.70 | 0.57 | |
| N2rc | 0.93 | 0.71 | 0.77 | 0.60 | 0.77 | 0.59 | |
Bold numbers indicate best performance.
Table 3.
Comparison of the different methods (k=6) when motifs are sampled from all k-mers with one mismatch to the word
| Performance with implanted k-mers, mismatch |
|||||||
|---|---|---|---|---|---|---|---|
| 5 Precision |
AUC ROC |
AUC PR |
|||||
| Motif setting: | m1r8 | m4r2 | m1r8 | m4r2 | m1r8 | m4r2 | |
| D2 | 0.59 | 0.51 | 0.53 | 0.48 | 0.53 | 0.49 | |
| D2z | 0.59 | 0.54 | 0.54 | 0.51 | 0.53 | 0.51 | |
| D2* | 0.60 | 0.54 | 0.54 | 0.51 | 0.54 | 0.51 | |
| N2* | 0.59 | 0.54 | 0.54 | 0.51 | 0.54 | 0.51 | |
| N2mm(0.01) | 0.60 | 0.54 | 0.55 | 0.51 | 0.54 | 0.51 | |
| N2mm(1.0) | 0.65 | 0.55 | 0.57 | 0.52 | 0.57 | 0.53 | |
Bold numbers indicate best performance.
3.4 Pairwise comparison of tissue-specific enhancers
The above simulations demonstrated the ability of N2 to distinguish artificial CRMs from unrelated sequences. Currently, our knowledge on regulatory sequences is limited and simulations can only approximate the real nature of enhancers. Tissue-specific enhancers in mouse embryos have been identified in a genome-wide manner using the co-activator protein p300 (Blow et al., 2010; Visel et al., 2009). These datasets allow us to test whether alignment-free methods are able to discriminate in vivo identified enhancers that show similar activity from genomic background. We used enhancers active in forebrain, midbrain, limb and heart tissue of the developing mouse embryo as positive sets (Blow et al., 2010; Visel et al., 2009). We compared pairwise scores from these tissue-specific enhancers with pairwise scores from genomic sequences of the same length randomly sampled from the mouse genome, ensuring a maximum of 30% of repetitive sequence for every negative sample. To obtain accurate estimations, we calculated the average over 25 samples, each time drawing 500 sequences from the positive set. Using the same evaluation measures as in the previous section, we tested the ability of alignment-free sequence comparison methods to detect functional similarity of regulatory sequences.
The choice of parameters will influence the results obtained from alignment-free comparisons. For N2, the main parameters are the length of the k-mers k and the weights of the words in the neighbourhood (aw). We therefore tested k=4, 5, 6 and mismatch weights aw={1, 0.75, 0.5, 0.25, 0.1, 0.05, 0.01, 0.001} (Supplementary Figs S5–S8). This analysis indicates that aw should be larger for higher values of k where the expected number of k-mer occurrences is <1. While different parameters might improve results for different datasets (Kantorovitz et al., 2007), we selected k=6 and mismatch weights of 1 as reasonable parameters throughout the analysis to have a consistent and comparable setup.
Figure 3 and Table 4 show the results for pairwise comparison of tissue-specific enhancers with alignment-free methods. Across all tissues, N2mm(1.0),rc gives the best results, demonstrating that N2 is most suitable to detect tissue-specific activity of regulatory sequences. The results also confirm the value of the word neighbourhood concept: comparing N2rc with N2*shows that the neighbourhood extension to the reverse complement is always preferable (Table 4). Extending the word neighbourhood to all words with one mismatch (N2mm(1.0),rc) further improves the results by 6–15% (Table 4). These results support the usage of N2 with word neighbourhood counts to score the similarity of regulatory sequences.
Fig. 3.

Precision–recall curve for enhancers active during mouse development. The plots show the precision average over 25 samples each time drawing 500 enhancer sequences (positive) and 500 unrelated genomic sequences of equal length as the enhancers (negative). (A) Precision–recall curve for forebrain enhancers. (B) Precision-recall curve for limb enhancers.
Table 4.
Comparison of the different methods on tissue-specific enhancers
| Performance on tissue-specific enhancer sequences |
|||||||||||||
|---|---|---|---|---|---|---|---|---|---|---|---|---|---|
| 5% Precision |
AUC ROC |
AUC PR |
|||||||||||
| Tissue | F | M | L | H | F | M | L | H | F | M | L | H | |
| D2 | 0.61 | 0.64 | 0.55 | 0.50 | 0.55 | 0.55 | 0.50 | 0.45 | 0.54 | 0.55 | 0.51 | 0.47 | |
| D2z | 0.66 | 0.69 | 0.63 | 0.56 | 0.57 | 0.57 | 0.56 | 0.53 | 0.57 | 0.57 | 0.55 | 0.52 | |
| D2* | 0.71 | 0.70 | 0.67 | 0.60 | 0.62 | 0.62 | 0.59 | 0.55 | 0.60 | 0.60 | 0.58 | 0.54 | |
| N2* | 0.65 | 0.64 | 0.62 | 0.58 | 0.58 | 0.57 | 0.56 | 0.53 | 0.57 | 0.56 | 0.55 | 0.53 | |
| N2rc | 0.71 | 0.67 | 0.68 | 0.60 | 0.61 | 0.59 | 0.58 | 0.55 | 0.60 | 0.58 | 0.58 | 0.55 | |
| N2mm(1.0),rc | 0.84 | 0.82 | 0.79 | 0.66 | 0.66 | 0.64 | 0.63 | 0.57 | 0.66 | 0.64 | 0.63 | 0.57 | |
Bold numbers indicate the best performance. Positive sequences were obtained by ChIP-Seq of p300 in forebrain (F), midbrain (M), limb (L) and heart (H) tissue of the mouse embryo. Negative sequences were randomly sampled from the mouse genome. All pairwise scores were computed with repeats masked, k=6, background Markov model of order 1. Results show average values over 25 samples each time drawing 500 sequences.
Tissue-specificity of enhancers.
The above results indicate that tissue-specific enhancer sequences indeed have a similar word content. However, a comparison of ChIP-Seq data with randomly sampled genomic sequences might be biased towards measuring similarities introduced by the technology, such as similar GC content. To test this, we verified whether we can discriminate enhancers according to the tissue where they drive expression. For that purpose, we computed all pairwise scores of enhancers active in the same tissue (positive set) and all pairwise scores between enhancers active in other tissues (negative set), discarding all enhancers active in multiple tissues. To correct for length differences between datasets from different tissues, we selected 750 bp in the middle of the reported enhancer sequences. Figure 4 shows that tissue-specific enhancers can be discriminated by alignment-free methods (see Supplementary Fig S9 for the other datasets). While the performance decreases compared to using random sequences as the negative set, these results show that activity in a similar tissue is indeed reflected in a higher sequence similarity. gain, the neighbourhood extensions of N2 improves the results, further highlighting the value of this concept for regulatory sequences.
Fig. 4.

Precision–recall curve for forebrain enhancers in the mouse. Enhancers active in different tissues were used as the background set.
4 DISCUSSION
In this study, we showed that N2 improves alignment-free sequence comparison through its flexible extension to word neighbourhood counts, thereby covering approximate and orientation-independent word matches. Previously, the D2z score has been extended to allow for approximate matching words using estimates for the expectations and the variances based on a Bernoulli background model; however, no implementation is available (Burden et al., 2008; Forêt et al., 2006). The framework that we present here is much more general and powerful. We allow for any desired word neighbourhood and associate words with weights such that the signal of words matching exactly is not lost. Furthermore, N2 can be computed on any background model order, which is essential to properly describe genomic sequences. Finally, N2 is much faster than D2z even without approximate matching, suggesting that a z-score calculation for an approximate D2 score would be infeasible for any dataset of realistic size.
The differences between N2*as used in this study and D2*are mainly due to the estimation of the background model. The better performance of D2*suggests that the concatenation of the sequences improves the accuracy of the background model; however, it drastically increases the running time. Here we observe that the improvement due to the extension to the word neighbourhood (N2*versus N2mm,rc) is better than the improvement due to different background model estimates (N2*versus D2*, Table 4).
With simulation studies we showed that N2 performs well on the task it was designed for, namely finding similarities between sequences based on shared words. Importantly, N2 is also able to measure similarity of in vivo identified enhancer sequences. This allows us to verify and increase our understanding of the architecture of regulatory elements: word count-based similarity measures are able to detect tissue-specific activity of enhancers, suggesting that CRMs contain scattered binding sites that contribute to their tissue specificity. Extending the word neighbourhood to the reverse complement (N2rc) improves the performance, showing that binding sites can occur on both strands of the CRM. Extending the neighbourhood to words with one mismatch (N2rc,mm) further improves the performance on experimentally identified enhancers. This suggests that there are subtle signals like a common content of similar but not equal words which are characteristic of genomic enhancers.
In this work, we assume that a high number of shared words represents a similar binding site content of enhancers. This assumption is violated by repeats, having a high number of shared words only due to high sequence similarity. For this reason, we mask repeats before calculating pairwise scores. Although some transcription factor binding sites have been found in repetitive sequences (Kunarso et al., 2010; Zemojtel et al., 2009), the sequence similarity of repeats is largely unrelated to regulatory activity and will eclipse any shared word count from common DNA binding motifs. We therefore recommend the usage of repeat masked sequences when comparing regulatory elements.
The N2 similarity can be applied to other tasks than pairwise comparison. Alignment-free methods have been used to predict CRMs in flies and mouse (Kantorovitz et al., 2009). Our results on pairwise comparison of enhancers suggests that the N2 similarity could as well be used to predict the regulatory outcome of enhancers. In contrast to pairwise comparison, where we only rely on two sequences, prediction would allow to use training data, therefore we expect that the performance would improve for this task. Nevertheless, the large size of mammalian genomes limits prediction of regulatory sequences in a genome-wide manner due to an inevitable large number of false positive predictions. Among the applications where N2 might be very insightful are clustering and classification of regulatory sequences obtained from genome-wide studies using transcription factor or co-activator binding data (Lee et al., 2011), DNase hypersensitivity sites or enhancer-specific histone modifications.
5 CONCLUSION
In this study, we have presented N2, a novel alignment-free measure of sequence similarity that overcomes the limitations imposed by traditional exact word count-based methods. We have included the general concept of weighted word neighbourhood counts and shown that it improves the ability to detect similarity between regulatory sequences. The task of pairwise comparison of regulatory sequences is much harder than traditional pairwise alignment since only very few shared words might lead to a similar activity. We have demonstrated on a large-scale dataset of mammalian enhancer sequences that pairwise sequence similarity of non-homologous regulatory sequences is able to estimate similar in vivo activity. We are therefore getting closer to understanding the sequence-dependent regulatory code within CRMs that enables the establishment of a large diversity of cell types coded in one genomic sequence.
Supplementary Material
ACKNOWLEDGEMENTS
We thank Sarah Behrens and Alena Myšičková for their help on word statistics, Knut Reinert for helpful suggestions and discussions, and David Weese and Manuel Holtgrewe for their support with the SeqAn library. We additionally thank three anonymous reviewers for their helpful and constructive comments.
FUNDING
JG acknowledges funding from the International Max Planck Research School for Computational Biology and Scientific Computing (IMPRS-CBSC) and the Dahlem Research School (DRS).
Conflict of Interest: none declared.
REFERENCES
- Benson G. Tandem repeats finder: a program to analyze dna sequences. Nucleic Acids Res. 1999;27:573–580. doi: 10.1093/nar/27.2.573. [DOI] [PMC free article] [PubMed] [Google Scholar]
- Blaisdell B.E. A measure of the similarity of sets of sequences not requiring sequence alignment. Proc. Natl Acad. Sci. USA. 1986;83:5155–5159. doi: 10.1073/pnas.83.14.5155. [DOI] [PMC free article] [PubMed] [Google Scholar]
- Blow M.J., et al. Chip-seq identification of weakly conserved heart enhancers. Nat. Genet. 2010;42:806–810. doi: 10.1038/ng.650. [DOI] [PMC free article] [PubMed] [Google Scholar]
- Burden C.J., et al. Approximate word matches between two random sequences. Ann. Appl. Probab. 2008;18:1–21. [Google Scholar]
- Carpenter J.E., et al. Assessment of the parallelization approach of d2-cluster for high-performance sequence clustering. J. Comput. Chem. 2002;23:755–757. doi: 10.1002/jcc.10025. [DOI] [PubMed] [Google Scholar]
- Dai Q., et al. Markov model plus k-word distributions: a synergy that produces novel statistical measures for sequence comparison. Bioinformatics. 2008;24:2296–2302. doi: 10.1093/bioinformatics/btn436. [DOI] [PubMed] [Google Scholar]
- Doering A., et al. SeqAn an efficient, generic C++ library for sequence analysis. BMC Bioinformatics. 2008;9:11. doi: 10.1186/1471-2105-9-11. [DOI] [PMC free article] [PubMed] [Google Scholar]
- Forêt,S., et al. Asymptotic behaviour and optimal word size for exact and approximate word matches between random sequences. BMC Bioinformatics. 2006;7(Suppl. 5):S21. doi: 10.1186/1471-2105-7-S5-S21. [DOI] [PMC free article] [PubMed] [Google Scholar]
- Gardiner-Garden M., Frommer M. CpG islands in vertebrate genomes. J. Mol. Biol. 1987;196:261–282. doi: 10.1016/0022-2836(87)90689-9. [DOI] [PubMed] [Google Scholar]
- Gordân,R., et al. Finding regulatory dna motifs using alignment-free evolutionary conservation information. Nucleic Acids Res. 2010;38:e90. doi: 10.1093/nar/gkp1166. [DOI] [PMC free article] [PubMed] [Google Scholar]
- Goto T., et al. Early and late periodic patterns of even skipped expression are controlled by distinct regulatory elements that respond to different spatial cues. Cell. 1989;57:413–422. doi: 10.1016/0092-8674(89)90916-1. [DOI] [PubMed] [Google Scholar]
- Hide W., et al. Biological evaluation of d2, an algorithm for high-performance sequence comparison. J. Comput. Biol. 1994;1:199–215. doi: 10.1089/cmb.1994.1.199. [DOI] [PubMed] [Google Scholar]
- Kantorovitz M.R., et al. A statistical method for alignment-free comparison of regulatory sequences. Bioinformatics. 2007;23:i249–i255. doi: 10.1093/bioinformatics/btm211. [DOI] [PubMed] [Google Scholar]
- Kantorovitz M.R., et al. Motif-blind, genome-wide discovery of cis-regulatory modules in drosophila and mouse. Dev. Cell. 2009;17:568–579. doi: 10.1016/j.devcel.2009.09.002. [DOI] [PMC free article] [PubMed] [Google Scholar]
- Kunarso G., et al. Transposable elements have rewired the core regulatory network of human embryonic stem cells. Nat. Genet. 2010;42:631–634. doi: 10.1038/ng.600. [DOI] [PubMed] [Google Scholar]
- Lee D., et al. Discriminative prediction of mammalian enhancers from DNA sequence. Genome Res. 2011 doi: 10.1101/gr.121905.111. [Epub ahead of print, doi:10.1101/gr.121905.111, August 29, 2011] [DOI] [PMC free article] [PubMed] [Google Scholar]
- Lippert R.A., et al. Distributional regimes for the number of k-word matches between two random sequences. Proc. Natl Acad. Sci. USA. 2002;99:13980–13989. doi: 10.1073/pnas.202468099. [DOI] [PMC free article] [PubMed] [Google Scholar]
- Needleman S.B., Wunsch C.D. A general method applicable to the search for similarities in the amino acid sequence of two proteins. J. Mol. Biol. 1970;48:443–453. doi: 10.1016/0022-2836(70)90057-4. [DOI] [PubMed] [Google Scholar]
- Reinert G., et al. Alignment-free sequence comparison (i): Statistics and power. J. Comput. Biol. 2009 doi: 10.1089/cmb.2009.0198. [DOI] [PMC free article] [PubMed] [Google Scholar]
- Robin S., et al. DNA, Words and Models. Cambridge University Press; 2005. [Google Scholar]
- Small S., et al. Transcriptional regulation of a pair-rule stripe in drosophila. Genes Dev. 1991;5:827–839. doi: 10.1101/gad.5.5.827. [DOI] [PubMed] [Google Scholar]
- Smith T.F., Waterman M.S. Identification of common molecular subsequences. J. Mol. Biol. 1981;147:195–197. doi: 10.1016/0022-2836(81)90087-5. [DOI] [PubMed] [Google Scholar]
- Thomas-Chollier M., et al. RSAT 2011: regulatory sequence analysis tools. Nucleic Acids Res. 2011;39:W86–W91. doi: 10.1093/nar/gkr377. [DOI] [PMC free article] [PubMed] [Google Scholar]
- van Helden J. Metrics for comparing regulatory sequences on the basis of pattern counts. Bioinformatics. 2004;20:399–406. doi: 10.1093/bioinformatics/btg425. [DOI] [PubMed] [Google Scholar]
- Vinga S., Almeida J. Alignment-free sequence comparison-a review. Bioinformatics. 2003;19:513–523. doi: 10.1093/bioinformatics/btg005. [DOI] [PubMed] [Google Scholar]
- Visel A., et al. Chip-seq accurately predicts tissue-specific activity of enhancers. Nature. 2009;457:854–858. doi: 10.1038/nature07730. [DOI] [PMC free article] [PubMed] [Google Scholar]
- Wilson M.D., et al. Species-specific transcription in mice carrying human chromosome 21. Science. 2008;322:434–438. doi: 10.1126/science.1160930. [DOI] [PMC free article] [PubMed] [Google Scholar]
- Wu G.A., et al. Whole-proteome phylogeny of large dsdna virus families by an alignment-free method. Proc. Natl Acad. Sci. USA. 2009;106:12826–12831. doi: 10.1073/pnas.0905115106. [DOI] [PMC free article] [PubMed] [Google Scholar]
- Zemojtel T., et al. Methylation and deamination of cpgs generate p53-binding sites on a genomic scale. Trends Genet. 2009;25:63–66. doi: 10.1016/j.tig.2008.11.005. [DOI] [PubMed] [Google Scholar]
- Zinzen R.P., et al. Combinatorial binding predicts spatio-temporal cis-regulatory activity. Nature. 2009;462:65–70. doi: 10.1038/nature08531. [DOI] [PubMed] [Google Scholar]
Associated Data
This section collects any data citations, data availability statements, or supplementary materials included in this article.