Figure 1.

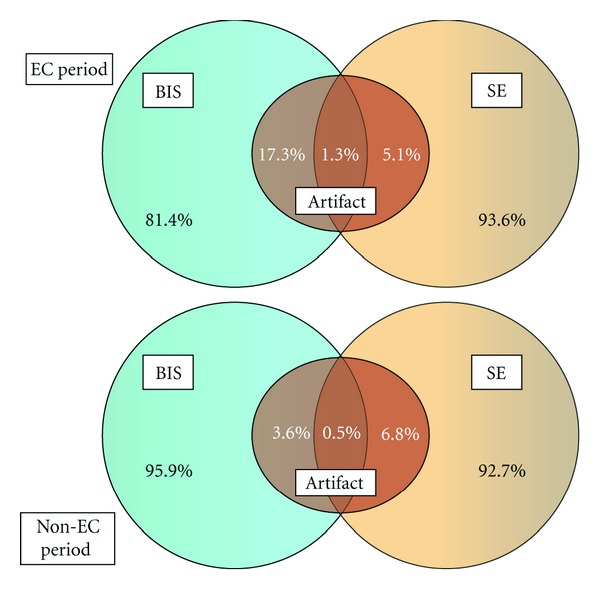
Bispectral index (BIS) and state entropy (SE) data with (top diagram) or without (bottom diagram) electrocautery (EC) use. The central set in each diagram represents data with artifact, whereas remaining set areas show good signal.

Bispectral index (BIS) and state entropy (SE) data with (top diagram) or without (bottom diagram) electrocautery (EC) use. The central set in each diagram represents data with artifact, whereas remaining set areas show good signal.